APO RESEARCH · REPORT
Magnetic Levitation Molecular Pump
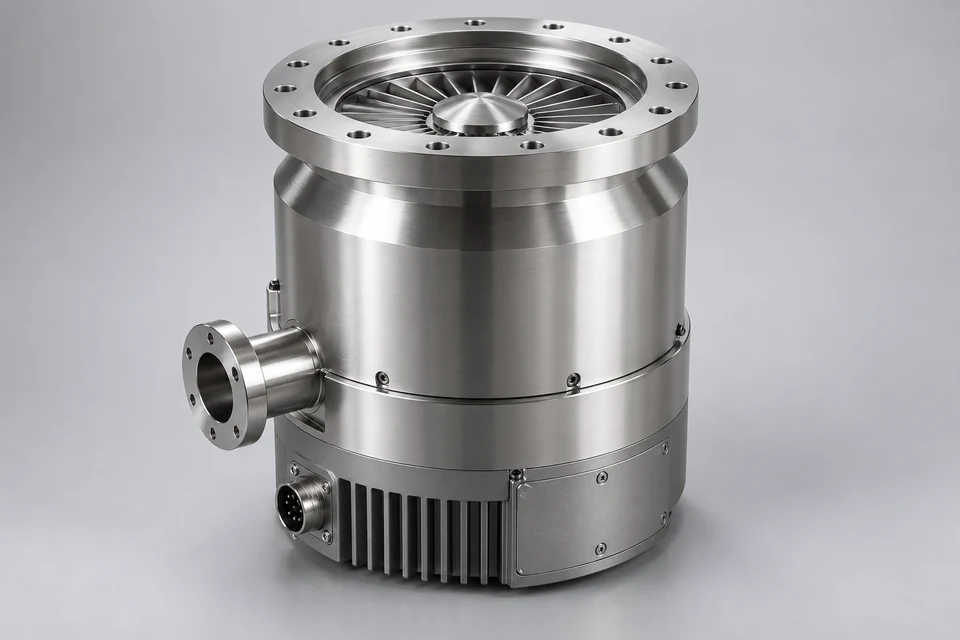
Magnetic Levitation Molecular Pump is a high vacuum kinetic pump in which the high speed rotor is suspended and controlled by magnetic bearings without continuous mechanical contact during normal operation.
Product & engineering
Understand the product.
Magnetic Levitation Molecular Pump is a high vacuum kinetic pump in which the high speed rotor is suspended and controlled by magnetic bearings without continuous mechanical contact during normal operation. The pumping element generally consists of multiple turbomolecular rotor and stator stages and may incorporate molecular drag stages to increase compression capability and allowable foreline pressure. Gas molecules entering the inlet receive directional momentum from rapidly rotating blades or drag surfaces and are progressively transferred toward the exhaust side, enabling operation in the molecular and transitional flow regimes required for high and ultra high vacuum systems.
The rotor assembly is normally supported in radial and axial directions by actively controlled electromagnetic bearings. Position sensors continuously measure rotor displacement, while the bearing controller regulates magnetic forces to maintain the rotor within its operating position at rotational speeds commonly reaching several tens of thousands of revolutions per minute. Permanent magnetic elements may provide part of the axial or radial load support in some architectures. Catcher or backup bearings remain mechanically isolated during normal operation and protect the rotor during power interruption, excessive displacement or abnormal deceleration.
A typical magnetic levitation molecular pump integrates the rotor, stator, high speed motor, magnetic bearing system, position sensors, power electronics, control electronics, cooling structure, purge gas interfaces and foreline connection within a compact vacuum assembly. Semiconductor and other process resistant versions may incorporate corrosion resistant materials, protective surface treatments, controlled heating, purge gas management and internal temperature regulation to tolerate reactive gases, condensable byproducts and deposition loading. Principal technical parameters include pumping speed for specified gases, compression ratio, ultimate pressure, maximum gas throughput, maximum foreline pressure, rotational speed, vibration level, thermal operating range and allowable process gas load.
The absence of continuous mechanical bearing contact reduces friction, lubricant dependence, particle generation and mechanically transmitted vibration at the rotor support. This operating architecture is widely used where clean high vacuum, stable high speed operation, low vibration and compatibility with demanding process gases are required, including semiconductor manufacturing, display manufacturing, photovoltaic manufacturing, vacuum coating and surface processing, analytical instrumentation, scientific research and industrial vacuum processing.
Equipment converts a defined input into a required mechanical or process result. Usable capacity depends on duty, auxiliaries, control, loading and maintenance, rather than an isolated maximum nameplate value.
What turns activity into demand
Production or operating duty leads to purchases when capacity, qualification and replacement requirements match the supplied machine or component. Site output alone does not determine equipment orders without the installed capacity and duty.
The commercial boundary
For Magnetic Levitation Molecular Pump, distinguish the supplied product from its inputs and the complete application. Report types and applications may overlap; retain the selected edition's product definition, geography, period, unit and transaction basis when comparing estimates.
Which conditions determine usable magnetic levitation molecular pump performance?
Magnetic Levitation Molecular Pump is a high vacuum kinetic pump in which the high speed rotor is suspended and controlled by magnetic bearings without continuous mechanical contact during normal operation. Compare the complete supplied assembly under the same operating conditions, including upstream and downstream interfaces, energy use and service requirements. Separate machine hardware, installed process line and maintenance revenue when defining the research boundary.
Selected research
Market Structure
Global Magnetic Levitation Molecular Pump Market by Size, by Type, by Application, by Region, History and Forecast 2021-2032
Market perspective
According to APO Research, Inc, the global Magnetic Levitation Molecular Pump market was valued at USD 632.48 million in 2025 and is estimated at USD 736.22 million in 2026, before reaching USD 1,079.71 million in 2032, representing a CAGR of 6.59% from 2026 to 2032. The market value increases 16.40% in 2026, followed by a more normalized expansion over the forecast period. The near term increase is consistent with the current semiconductor equipment cycle. SEMI projects global wafer fab equipment sales of USD 143.9 billion in 2026, up 23.1%, while global installed 300 mm semiconductor capacity is projected to increase about 7% in 2026. Memory equipment investment alone is expected to reach USD 52 billion, including USD 37 billion for DRAM and USD 14 billion for 3D NAND. These investments increase the installed base of vacuum intensive etch, deposition, ion implantation, inspection and related process equipment.
Magnetic levitation molecular pumps carry a relatively high unit value because the pump combines a high speed rotor, active magnetic bearings, position sensors, electromagnetic control, drive electronics, precision balancing and vacuum compatible mechanical assemblies. Commercial product specifications also show a wide performance range. Edwards offers magnetic levitation pumps with pumping speeds from about 300 L/s to 4,500 L/s. Osaka Vacuum covers about 340 L/s to 4,200 L/s. ULVAC offers magnetic bearing models from about 300 L/s to 4,000 L/s, while Pfeiffer supplies magnetic levitation products from compact 255 L/s units to large models around the 3,000 L/s class. Shimadzu magnetic bearing products extend from compact units below 200 L/s to large pumps around 4,000 L/s and above. The resulting market value therefore reflects both shipment volume and product mix, with large pumping speed, high gas throughput, corrosive process and low vibration configurations carrying materially higher value per unit.
Semiconductor manufacturing remains the largest source of incremental demand through 2032. Etching and CVD place particularly high requirements on gas throughput, process resistance and continuous operation, while inspection, metrology, lithography and research systems emphasize vibration control and clean vacuum performance. Magnetic bearings eliminate mechanical contact during normal rotor operation, reducing wear, lubricant contamination and vibration. Edwards specifies five axis active magnetic bearing control for its STP pumps, while Osaka Vacuum similarly uses active control across five axes. These characteristics increase adoption in process chambers with demanding uptime and cleanliness requirements. Coating equipment, display manufacturing, analytical instruments, high energy physics, aerospace research and other scientific vacuum systems provide additional demand outside semiconductor fabrication.
Read the full market overview
The USD 343.49 million increase from 2026 to 2032 is expected to be concentrated in China, Taiwan, Korea, Japan, the Americas and other major semiconductor manufacturing regions. Taiwan investment is increasingly associated with advanced logic capacity, Korea with HBM and advanced DRAM, China with continued domestic wafer capacity expansion, and the Americas with new advanced semiconductor manufacturing capacity. SEMI expects logic and memory to remain the largest areas of 300 mm equipment spending, with global installed 300 mm capacity continuing to expand through 2029. Higher process complexity also increases the number and specification level of vacuum systems required per unit of wafer capacity.
Competition is led by established vacuum manufacturers including Edwards, Shimadzu, Pfeiffer Vacuum, Osaka Vacuum and ULVAC, together with an expanding group of Chinese suppliers. Edwards delivered its 250,000th STP turbomolecular pump in July 2025, demonstrating a large installed base for magnetic levitation technology. Shimadzu reported FY2025 turbomolecular pump sales of JPY 37.8 billion and stated that demand grew in Europe, China and other Asian markets. Its recurring revenue ratio for TMP reached 24%, reflecting increasing service activity around the installed base. Manufacturing economics are influenced by precision rotor machining, dynamic balancing, magnetic bearing control, sensors, drive electronics, thermal management, final vacuum testing and OEM qualification. These technical requirements limit rapid capacity expansion and help sustain the value contribution of higher specification pumps as shipment volume increases through 2032.
The report provides an overview of the global Magnetic Levitation Molecular Pump market in terms of capacity, output, revenue, and price, analyzing global market trends using historical revenue and sales data for 2021-2025, estimates for 2026, and projected CAGRs through 2032.
The study covers key producers of Magnetic Levitation Molecular Pump and consumption patterns in major regions and countries, assesses future market potential, and highlights priority regions and countries for segmenting the market into sub-sectors, with country-specific market value data for the U.S., Canada, Mexico, Brazil, China, Japan, South Korea, Southeast Asia, India, Germany, the U.K., Italy, the Middle East, Africa, and other countries.
The report also presents Magnetic Levitation Molecular Pump sales, revenue, market share, and industry ranking for the main manufacturers for 2021-2026, identifies the major stakeholders in the global market, and analyzes their competitive landscape and market positioning based on recent developments and segmental revenues.
In addition, the report analyzes segment data by type and application—covering sales, revenue, and price—for 2021-2032, and evaluates and forecasts the Magnetic Levitation Molecular Pump market size, projected growth trends, production technologies, key applications, and end-use industries.
Magnetic Levitation Molecular Pump Segment by Company
Edwards
Pfeiffer Vacuum
Shimadzu Corporation
Leybold GmbH
ULVAC, Inc.
Osaka Vacuum, Ltd.
EBARA CORPORATION
Beijing KYKY Co., Ltd.
Tianjin EMAGING Technology
Hefei Yuchi Vacuum Technology
Zhongke Jiuwei Technology
Beijing Grand Hitek
Suzhou Supermag Intelligent Technology
Magnetic Levitation Molecular Pump Segment by Type
Up to 1000 L/s
Above 1000 to 3000 L/s
Above 3000 L/s
Magnetic Levitation Molecular Pump Segment by Application
Semiconductor Manufacturing
Display Manufacturing
Photovoltaic Manufacturing
Vacuum Coating and Surface Processing
Analytical Instrumentation
Scientific Research
Industrial Vacuum Processing
Magnetic Levitation Molecular Pump Segment by Region
North America
United States
Canada
Mexico
Europe
Germany
France
U.K.
Italy
Russia
Spain
Netherlands
Switzerland
Sweden
Poland
Asia-Pacific
China
Japan
South Korea
India
Australia
Taiwan
Southeast Asia
South America
Brazil
Argentina
Chile
Colombia
Middle East & Africa
Egypt
South Africa
Israel
Türkiye
GCC Countries
Study Objectives
1. To analyze and research the global status and future forecast, involving, production, value, consumption, growth rate (CAGR), market share, historical and forecast.
2. To present the key manufacturers, capacity, production, revenue, market share, and Recent Developments.
3. To split the breakdown data by regions, type, manufacturers, and Application.
4. To analyze the global and key regions market potential and advantage, opportunity and challenge, restraints, and risks.
5. To identify significant trends, drivers, influence factors in global and regions.
6. To analyze competitive developments such as expansions, agreements, new product launches, and acquisitions in the market.
Reasons to Buy This Report
1. This report will help the readers to understand the competition within the industries and strategies for the competitive environment to enhance the potential profit. The report also focuses on the competitive landscape of the global Magnetic Levitation Molecular Pump market, and introduces in detail the market share, industry ranking, competitor ecosystem, market performance, new product development, operation situation, expansion, and acquisition. etc. of the main players, which helps the readers to identify the main competitors and deeply understand the competition pattern of the market.
2. This report will help stakeholders to understand the global industry status and trends of Magnetic Levitation Molecular Pump and provides them with information on key market drivers, restraints, challenges, and opportunities.
3. This report will help stakeholders to understand competitors better and gain more insights to strengthen their position in their businesses. The competitive landscape section includes the market share and rank (in volume and value), competitor ecosystem, new product development, expansion, and acquisition.
4. This report stays updated with novel technology integration, features, and the latest developments in the market.
5. This report helps stakeholders to gain insights into which regions to target globally.
6. This report helps stakeholders to gain insights into the end-user perception concerning the adoption of Magnetic Levitation Molecular Pump.
7. This report helps stakeholders to identify some of the key players in the market and understand their valuable contribution.
Chapter Outline
Chapter 1: Provides an overview of the Magnetic Levitation Molecular Pump market, including product definition, global market growth prospects, production value, capacity, and average price forecasts (2021-2032).
Chapter 2: Analysis key trends, drivers, challenges, and opportunities within the global Magnetic Levitation Molecular Pump industry.
Chapter 3: Detailed analysis of Magnetic Levitation Molecular Pump market competition landscape. Including Magnetic Levitation Molecular Pump manufacturers' output value, output and average price from 2021 to 2026, as well as competition analysis indicators such as origin, product type, application, merger and acquisition information, etc.
Chapter 4: Provides the analysis of various market segments by type, covering the market size and development potential of each market segment, to help readers find the blue ocean market in different market segments.
Chapter 5: Provides the analysis of various market segments by application, covering the market size and development potential of each market segment, to help readers find the blue ocean market in different downstream markets.
Chapter 6: Provides profiles of key players, introducing the basic situation of the main companies in the market in detail, including product production/output, value, price, gross margin, product introduction, recent development, etc.
Chapter 7: Production/Production Value of Magnetic Levitation Molecular Pump by region. It provides a quantitative analysis of the market size and development potential of each region in the next six years.
Chapter 8: Consumption of Magnetic Levitation Molecular Pump in regional level and country level. It provides a quantitative analysis of the market size and development potential of each region and its main countries and introduces the market development, future development prospects, market space, and production of each country in the world.
Chapter 9: Analysis of industrial chain, including the upstream and downstream of the industry.
Chapter 10: Concluding Insights of the report.
More report detail
Tables and figures
Scope & coverage.
Types
- Up to 1000 L/s
- Above 1000 to 3000 L/s
- Above 3000 L/s
Applications
- Semiconductor Manufacturing
- Display Manufacturing
- Photovoltaic Manufacturing
- Vacuum Coating and Surface Processing
- Analytical Instrumentation
- Scientific Research
- Industrial Vacuum Processing
Companies covered
- Edwards
- Pfeiffer Vacuum
- Shimadzu Corporation
- Leybold GmbH
- ULVAC, Inc.
- Osaka Vacuum, Ltd.
- EBARA CORPORATION
- Beijing KYKY Co., Ltd.
- Tianjin EMAGING Technology
- Hefei Yuchi Vacuum Technology
- Zhongke Jiuwei Technology
- Beijing Grand Hitek
- Suzhou Supermag Intelligent Technology
Inside the report.
1 Market Overview
- 1.1 Product Definition
- 1.2 Global Market Growth Prospects
- 1.2.1 Global Magnetic Levitation Molecular Pump Production Value Estimates and Forecasts (2021-2032)
- 1.2.2 Global Magnetic Levitation Molecular Pump Production Capacity Estimates and Forecasts (2021-2032)
- 1.2.3 Global Magnetic Levitation Molecular Pump Production Estimates and Forecasts (2021-2032)
- 1.2.4 Global Magnetic Levitation Molecular Pump Market Average Price (2021-2032)
- 1.3 Assumptions and Limitations
- 1.4 Study Goals and Objectives
2 Global Magnetic Levitation Molecular Pump Market Dynamics
- 2.1 Magnetic Levitation Molecular Pump Industry Trends
- 2.2 Magnetic Levitation Molecular Pump Industry Drivers
- 2.3 Magnetic Levitation Molecular Pump Industry Opportunities and Challenges
- 2.4 Magnetic Levitation Molecular Pump Industry Restraints
3 Magnetic Levitation Molecular Pump Market by Manufacturers
- 3.1 Global Magnetic Levitation Molecular Pump Production Value by Manufacturers (2021-2026)
- 3.2 Global Magnetic Levitation Molecular Pump Production by Manufacturers (2021-2026)
- 3.3 Global Magnetic Levitation Molecular Pump Average Price by Manufacturers (2021-2026)
- 3.4 Global Magnetic Levitation Molecular Pump Industry Manufacturers Ranking, 2024 VS 2025 VS 2026
- 3.5 Global Magnetic Levitation Molecular Pump Key Manufacturers Manufacturing Sites & Headquarters
- 3.6 Global Magnetic Levitation Molecular Pump Manufacturers, Product Type & Application
- 3.7 Global Magnetic Levitation Molecular Pump Manufacturers Established Date
- 3.8 Market Competitive Analysis
- 3.8.1 Global Magnetic Levitation Molecular Pump Market CR5 and HHI
- 3.8.2 Global Top 5 and 10 Magnetic Levitation Molecular Pump Players Market Share by Production Value in 2025
- 3.8.3 2025 Magnetic Levitation Molecular Pump Tier 1, Tier 2, and Tier 3
4 Magnetic Levitation Molecular Pump Market by Type
- 4.1 Magnetic Levitation Molecular Pump Type Introduction
- 4.1.1 Up to 1000 L/s
- 4.1.2 Above 1000 to 3000 L/s
- 4.1.3 Above 3000 L/s
- 4.2 Global Magnetic Levitation Molecular Pump Production by Type
- 4.2.1 Global Magnetic Levitation Molecular Pump Production by Type (2021 VS 2025 VS 2032)
- 4.2.2 Global Magnetic Levitation Molecular Pump Production by Type (2021-2032)
- 4.2.3 Global Magnetic Levitation Molecular Pump Production Market Share by Type (2021-2032)
- 4.3 Global Magnetic Levitation Molecular Pump Production Value by Type
- 4.3.1 Global Magnetic Levitation Molecular Pump Production Value by Type (2021 VS 2025 VS 2032)
- 4.3.2 Global Magnetic Levitation Molecular Pump Production Value by Type (2021-2032)
- 4.3.3 Global Magnetic Levitation Molecular Pump Production Value Market Share by Type (2021-2032)
5 Magnetic Levitation Molecular Pump Market by Application
- 5.1 Magnetic Levitation Molecular Pump Application Introduction
- 5.1.1 Semiconductor Manufacturing
- 5.1.2 Display Manufacturing
- 5.1.3 Photovoltaic Manufacturing
- 5.1.4 Vacuum Coating and Surface Processing
- 5.1.5 Analytical Instrumentation
- 5.1.6 Scientific Research
- 5.1.7 Industrial Vacuum Processing
- 5.2 Global Magnetic Levitation Molecular Pump Production by Application
- 5.2.1 Global Magnetic Levitation Molecular Pump Production by Application (2021 VS 2025 VS 2032)
- 5.2.2 Global Magnetic Levitation Molecular Pump Production by Application (2021-2032)
- 5.2.3 Global Magnetic Levitation Molecular Pump Production Market Share by Application (2021-2032)
- 5.3 Global Magnetic Levitation Molecular Pump Production Value by Application
- 5.3.1 Global Magnetic Levitation Molecular Pump Production Value by Application (2021 VS 2025 VS 2032)
- 5.3.2 Global Magnetic Levitation Molecular Pump Production Value by Application (2021-2032)
- 5.3.3 Global Magnetic Levitation Molecular Pump Production Value Market Share by Application (2021-2032)
6 Company Profiles
- 6.1 Edwards
- 6.1.1 Edwards Company Information
- 6.1.2 Edwards Business Overview
- 6.1.3 Edwards Magnetic Levitation Molecular Pump Production, Value and Gross Margin (2021-2026)
- 6.1.4 Edwards Magnetic Levitation Molecular Pump Product Portfolio
- 6.1.5 Edwards Recent Developments
- 6.2 Pfeiffer Vacuum
- 6.2.1 Pfeiffer Vacuum Company Information
- 6.2.2 Pfeiffer Vacuum Business Overview
- 6.2.3 Pfeiffer Vacuum Magnetic Levitation Molecular Pump Production, Value and Gross Margin (2021-2026)
- 6.2.4 Pfeiffer Vacuum Magnetic Levitation Molecular Pump Product Portfolio
- 6.2.5 Pfeiffer Vacuum Recent Developments
- 6.3 Shimadzu Corporation
- 6.3.1 Shimadzu Corporation Company Information
- 6.3.2 Shimadzu Corporation Business Overview
- 6.3.3 Shimadzu Corporation Magnetic Levitation Molecular Pump Production, Value and Gross Margin (2021-2026)
- 6.3.4 Shimadzu Corporation Magnetic Levitation Molecular Pump Product Portfolio
- 6.3.5 Shimadzu Corporation Recent Developments
- 6.4 Leybold GmbH
- 6.4.1 Leybold GmbH Company Information
- 6.4.2 Leybold GmbH Business Overview
- 6.4.3 Leybold GmbH Magnetic Levitation Molecular Pump Production, Value and Gross Margin (2021-2026)
- 6.4.4 Leybold GmbH Magnetic Levitation Molecular Pump Product Portfolio
- 6.4.5 Leybold GmbH Recent Developments
- 6.5 ULVAC, Inc.
- 6.5.1 ULVAC, Inc. Company Information
- 6.5.2 ULVAC, Inc. Business Overview
- 6.5.3 ULVAC, Inc. Magnetic Levitation Molecular Pump Production, Value and Gross Margin (2021-2026)
- 6.5.4 ULVAC, Inc. Magnetic Levitation Molecular Pump Product Portfolio
- 6.5.5 ULVAC, Inc. Recent Developments
- 6.6 Osaka Vacuum, Ltd.
- 6.6.1 Osaka Vacuum, Ltd. Company Information
- 6.6.2 Osaka Vacuum, Ltd. Business Overview
- 6.6.3 Osaka Vacuum, Ltd. Magnetic Levitation Molecular Pump Production, Value and Gross Margin (2021-2026)
- 6.6.4 Osaka Vacuum, Ltd. Magnetic Levitation Molecular Pump Product Portfolio
- 6.6.5 Osaka Vacuum, Ltd. Recent Developments
- 6.7 EBARA CORPORATION
- 6.7.1 EBARA CORPORATION Company Information
- 6.7.2 EBARA CORPORATION Business Overview
- 6.7.3 EBARA CORPORATION Magnetic Levitation Molecular Pump Production, Value and Gross Margin (2021-2026)
- 6.7.4 EBARA CORPORATION Magnetic Levitation Molecular Pump Product Portfolio
- 6.7.5 EBARA CORPORATION Recent Developments
- 6.8 Beijing KYKY Co., Ltd.
- 6.8.1 Beijing KYKY Co., Ltd. Company Information
- 6.8.2 Beijing KYKY Co., Ltd. Business Overview
- 6.8.3 Beijing KYKY Co., Ltd. Magnetic Levitation Molecular Pump Production, Value and Gross Margin (2021-2026)
- 6.8.4 Beijing KYKY Co., Ltd. Magnetic Levitation Molecular Pump Product Portfolio
- 6.8.5 Beijing KYKY Co., Ltd. Recent Developments
- 6.9 Tianjin EMAGING Technology
- 6.9.1 Tianjin EMAGING Technology Company Information
- 6.9.2 Tianjin EMAGING Technology Business Overview
- 6.9.3 Tianjin EMAGING Technology Magnetic Levitation Molecular Pump Production, Value and Gross Margin (2021-2026)
- 6.9.4 Tianjin EMAGING Technology Magnetic Levitation Molecular Pump Product Portfolio
- 6.9.5 Tianjin EMAGING Technology Recent Developments
- 6.10 Hefei Yuchi Vacuum Technology
- 6.10.1 Hefei Yuchi Vacuum Technology Company Information
- 6.10.2 Hefei Yuchi Vacuum Technology Business Overview
- 6.10.3 Hefei Yuchi Vacuum Technology Magnetic Levitation Molecular Pump Production, Value and Gross Margin (2021-2026)
- 6.10.4 Hefei Yuchi Vacuum Technology Magnetic Levitation Molecular Pump Product Portfolio
- 6.10.5 Hefei Yuchi Vacuum Technology Recent Developments
- 6.11 Zhongke Jiuwei Technology
- 6.11.1 Zhongke Jiuwei Technology Company Information
- 6.11.2 Zhongke Jiuwei Technology Business Overview
- 6.11.3 Zhongke Jiuwei Technology Magnetic Levitation Molecular Pump Production, Value and Gross Margin (2021-2026)
- 6.11.4 Zhongke Jiuwei Technology Magnetic Levitation Molecular Pump Product Portfolio
- 6.11.5 Zhongke Jiuwei Technology Recent Developments
- 6.12 Beijing Grand Hitek
- 6.12.1 Beijing Grand Hitek Company Information
- 6.12.2 Beijing Grand Hitek Business Overview
- 6.12.3 Beijing Grand Hitek Magnetic Levitation Molecular Pump Production, Value and Gross Margin (2021-2026)
- 6.12.4 Beijing Grand Hitek Magnetic Levitation Molecular Pump Product Portfolio
- 6.12.5 Beijing Grand Hitek Recent Developments
- 6.13 Suzhou Supermag Intelligent Technology
- 6.13.1 Suzhou Supermag Intelligent Technology Company Information
- 6.13.2 Suzhou Supermag Intelligent Technology Business Overview
- 6.13.3 Suzhou Supermag Intelligent Technology Magnetic Levitation Molecular Pump Production, Value and Gross Margin (2021-2026)
- 6.13.4 Suzhou Supermag Intelligent Technology Magnetic Levitation Molecular Pump Product Portfolio
- 6.13.5 Suzhou Supermag Intelligent Technology Recent Developments
7 Global Magnetic Levitation Molecular Pump Production by Region
- 7.1 Global Magnetic Levitation Molecular Pump Production by Region: 2021 VS 2025 VS 2032
- 7.2 Global Magnetic Levitation Molecular Pump Production by Region (2021-2032)
- 7.2.1 Global Magnetic Levitation Molecular Pump Production by Region (2021-2026)
- 7.2.2 Global Magnetic Levitation Molecular Pump Production Forecast by Region (2027-2032)
- 7.3 Global Magnetic Levitation Molecular Pump Production by Region: 2021 VS 2025 VS 2032
- 7.4 Global Magnetic Levitation Molecular Pump Production Value by Region (2021-2032)
- 7.4.1 Global Magnetic Levitation Molecular Pump Production Value by Region (2021-2026)
- 7.4.2 Global Magnetic Levitation Molecular Pump Production Value by Region (2027-2032)
- 7.5 Global Magnetic Levitation Molecular Pump Market Price Analysis by Region (2021-2032)
- 7.6 Regional Production Value Trends (2021-2032)
- 7.6.1 North America Magnetic Levitation Molecular Pump Production Value (2021-2032)
- 7.6.2 Europe Magnetic Levitation Molecular Pump Production Value (2021-2032)
- 7.6.3 Asia-Pacific Magnetic Levitation Molecular Pump Production Value (2021-2032)
- 7.6.4 South America Magnetic Levitation Molecular Pump Production Value (2021-2032)
- 7.6.5 Middle East & Africa Magnetic Levitation Molecular Pump Production Value (2021-2032)
8 Global Magnetic Levitation Molecular Pump Consumption by Region
- 8.1 Global Magnetic Levitation Molecular Pump Consumption by Region: 2021 VS 2025 VS 2032
- 8.2 Global Magnetic Levitation Molecular Pump Consumption by Region (2021-2032)
- 8.2.1 Global Magnetic Levitation Molecular Pump Consumption by Region (2021-2026)
- 8.2.2 Global Magnetic Levitation Molecular Pump Consumption by Region (2027-2032)
- 8.3 North America
- 8.3.1 North America Magnetic Levitation Molecular Pump Consumption Growth Rate by Country: 2021 VS 2025 VS 2032
- 8.3.2 North America Magnetic Levitation Molecular Pump Consumption by Country (2021-2032)
- 8.3.3 U.S.
- 8.3.4 Canada
- 8.3.5 Mexico
- 8.4 Europe
- 8.4.1 Europe Magnetic Levitation Molecular Pump Consumption Growth Rate by Country: 2021 VS 2025 VS 2032
- 8.4.2 Europe Magnetic Levitation Molecular Pump Consumption by Country (2021-2032)
- 8.4.3 Germany
- 8.4.4 France
- 8.4.5 U.K.
- 8.4.6 Italy
- 8.4.7 Netherlands
- 8.5 Asia Pacific
- 8.5.1 Asia Pacific Magnetic Levitation Molecular Pump Consumption Growth Rate by Country: 2021 VS 2025 VS 2032
- 8.5.2 Asia Pacific Magnetic Levitation Molecular Pump Consumption by Country (2021-2032)
- 8.5.3 China
- 8.5.4 Japan
- 8.5.5 South Korea
- 8.5.6 Southeast Asia
- 8.5.7 India
- 8.5.8 Australia
- 8.6 South America
- 8.6.1 South America Magnetic Levitation Molecular Pump Consumption Growth Rate by Country: 2021 VS 2025 VS 2032
- 8.6.2 South America Magnetic Levitation Molecular Pump Consumption by Country (2021-2032)
- 8.6.3 Brazil
- 8.6.4 Argentina
- 8.6.5 Chile
- 8.6.6 Colombia
- 8.7 Middle East & Africa
- 8.7.1 Middle East & Africa Magnetic Levitation Molecular Pump Consumption Growth Rate by Country: 2021 VS 2025 VS 2032
- 8.7.2 Middle East & Africa Magnetic Levitation Molecular Pump Consumption by Country (2021-2032)
- 8.7.3 Egypt
- 8.7.4 South Africa
- 8.7.5 Israel
- 8.7.6 Türkiye
- 8.7.7 GCC Countries
9 Value Chain and Sales Channels Analysis
- 9.1 Magnetic Levitation Molecular Pump Value Chain Analysis
- 9.1.1 Magnetic Levitation Molecular Pump Key Raw Materials
- 9.1.2 Raw Materials Key Suppliers
- 9.1.3 Manufacturing Cost Structure
- 9.1.4 Magnetic Levitation Molecular Pump Production Mode & Process
- 9.2 Magnetic Levitation Molecular Pump Sales Channels Analysis
- 9.2.1 Direct Comparison with Distribution Share
- 9.2.2 Magnetic Levitation Molecular Pump Distributors
- 9.2.3 Magnetic Levitation Molecular Pump Customers
10 Concluding Insights
11 Appendix
- 11.1 Reasons for Doing This Study
- 11.2 Research Methodology
- 11.3 Research Process
- 11.4 Authors List of This Report
- 11.5 Data Source
- 11.5.1 Secondary Sources
- 11.5.2 Primary Sources
- 11.6 Disclaimer
GET THE RESEARCH
Choose your license.
Choose who needs access.
All options are for this report and research series.
PDF by email within 3–5 working days after payment confirmation.
Talk to an analyst