
APO RESEARCH · REPORT
Mainframe
Mainframe is a centralized, high capacity enterprise computing system comprising a central processor complex, shared memory, general purpose and specialized processors, dedicated input and output processors, high bandwidth communication channels, hardware partitioning and virtualization resources, integrated storage and network interfaces, cryptographic and compression components, and redundant power, cooling, and system control units.
Product & engineering
Understand the product.
Mainframe is a centralized, high capacity enterprise computing system comprising a central processor complex, shared memory, general purpose and specialized processors, dedicated input and output processors, high bandwidth communication channels, hardware partitioning and virtualization resources, integrated storage and network interfaces, cryptographic and compression components, and redundant power, cooling, and system control units. It executes workloads through coordinated processor scheduling, protected memory access, logical partitioning, workload isolation, channel based data transfer, continuous hardware monitoring, error correction, failed component isolation, and system recovery.
A mainframe assigns transaction execution, data transfer, storage access, network communication, encryption, compression, and system management to coordinated processing resources. Dedicated input and output processors and communication channels move large volumes of data while limiting demand on general purpose processors, enabling the system to process online transactions, database access, batch jobs, and other enterprise workloads concurrently. Logical partitioning and virtualization allocate processors, memory, and input and output resources among isolated operating environments, allowing multiple operating systems and applications to run concurrently within the same physical system. Capacity management and workload scheduling allocate computing resources according to business priorities to maintain predictable throughput, controlled latency, and continuity for critical tasks.
Mainframes incorporate multiple layers of hardware redundancy, memory and data validation, component monitoring, failure prediction, dynamic component isolation, and automated recovery. Processors, memory, input and output components, power supplies, cooling units, and control modules may include redundant resources. Certain components can be maintained or replaced without interrupting unaffected workloads. Hardware partitioning, access controls, cryptographic modules, key management, and protected execution environments govern access boundaries among data, applications, and workloads. Together, these mechanisms establish the reliability, availability, and serviceability characteristics of a mainframe system.
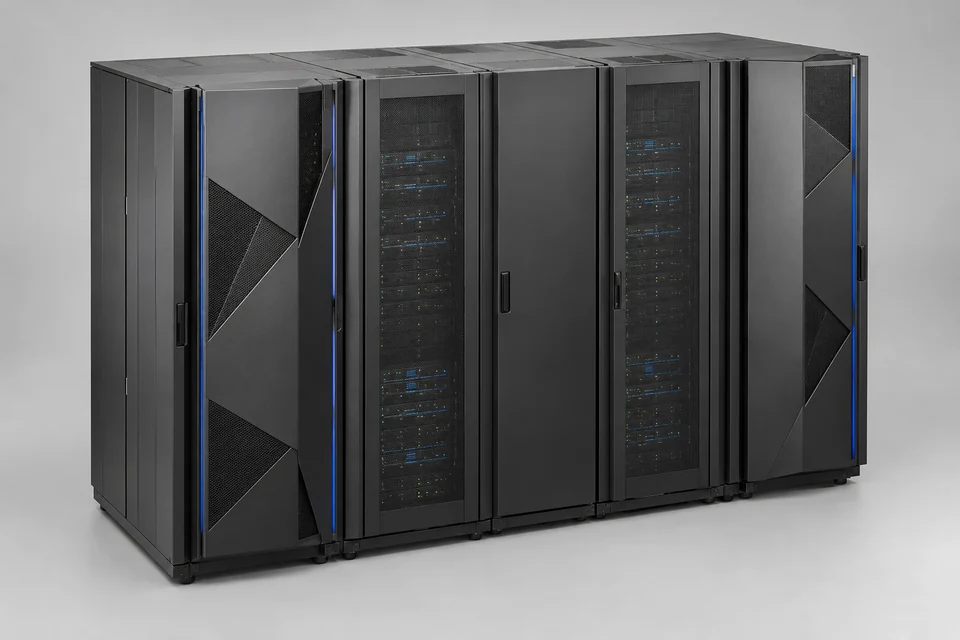
Modern mainframes typically occupy standard data center racks or manufacturer specific cabinets and may consist of one cabinet or several interconnected cabinets. Each cabinet integrates processor drawers, memory, input and output components, network interfaces, power supplies, cooling equipment, and system management modules, with connections to external storage, tape systems, network equipment, and disaster recovery facilities. Physical dimensions alone do not determine whether a computer is a mainframe. Classification depends primarily on centralized system architecture, dedicated input and output processing, logical partitioning, workload management, failure recovery, large scale concurrent transaction processing, and compatibility with established enterprise applications.
Early mainframes were centrally installed electronic computing systems used primarily for batch data processing and centralized computation. The introduction of compatible computer families allowed software developed for a common architecture to operate across multiple performance classes and successive hardware generations. Virtualization, shared resource management, dedicated input and output processing, online transaction processing, relational databases, hardware cryptography, and automated failure recovery subsequently became fundamental elements of mainframe computing. Modern systems retain established application compatibility while running proprietary operating systems, Linux, databases, transaction monitors, Java applications, containerized workloads, and analytical workloads. Network and application interfaces connect these systems with distributed servers and cloud computing environments.
Mainframes generally preserve compatibility with established operating systems, databases, transaction monitors, batch programs, and enterprise applications across successive hardware generations. This continuity allows banks, insurers, government agencies, telecommunications operators, and large enterprises to operate core systems created during different technology cycles while retaining substantial software assets and embedded business rules during hardware replacement. Mainframe procurement, upgrades, and capacity configuration are determined primarily by transaction volumes, concurrent user counts, database size, input and output intensity, availability requirements, recovery objectives, and the existing application environment.
Mainframes are primarily used for core banking, payment clearing, card authorization, securities transaction processing, insurance underwriting and claims administration, government population and tax records, telecommunications billing, airline and railway reservations, retail transactions, supply chain management, and large enterprise batch processing. These workloads typically involve high transaction volumes, dense concurrent access, large shared datasets, strict processing sequences, extensive audit requirements, and significant costs associated with service interruption. Cloud computing, big data, mobile applications, and artificial intelligence may access or operate on mainframe resources. These terms describe computing environments or technical workloads and do not provide a complete classification of mainframe end use industries.
Mainframes and supercomputers address different computing objectives. Mainframes emphasize concurrent execution of diverse business workloads, shared data access, transaction integrity, input and output throughput, continuous availability, and long term software compatibility. Supercomputers emphasize large scale parallel numerical computation, with performance commonly evaluated through floating point capability, computing node count, accelerator performance, interconnect efficiency, and parallel file system throughput. Mainframes commonly execute transaction processing, databases, batch jobs, and enterprise applications. Supercomputers are primarily used for climate modeling, physical simulation, molecular modeling, engineering analysis, and other computationally intensive scientific workloads. Both system classes may incorporate multiple processors, high speed storage, and redundant components, while their architectures, performance measures, and principal workloads remain distinct.
Equipment converts a defined input into a required mechanical or process result. Usable capacity depends on duty, auxiliaries, control, loading and maintenance, rather than an isolated maximum nameplate value.
What turns activity into demand
Production or operating duty leads to purchases when capacity, qualification and replacement requirements match the supplied machine or component. Site output alone does not determine equipment orders without the installed capacity and duty.
The commercial boundary
For Mainframe, distinguish the supplied product from its inputs and the complete application. Report types and applications may overlap; retain the selected edition's product definition, geography, period, unit and transaction basis when comparing estimates.
Which conditions determine usable mainframe performance?
Mainframe is a centralized, high capacity enterprise computing system comprising a central processor complex, shared memory, general purpose and specialized processors, dedicated input and output processors, high bandwidth communication channels, hardware partitioning and virtualization resources, integrated storage and network interfaces, cryptographic and compression components, and redundant power, cooling, and system control units. Compare the complete supplied assembly under the same operating conditions, including upstream and downstream interfaces, energy use and service requirements. Separate machine hardware, installed process line and maintenance revenue when defining the research boundary.
Selected research
Market Analysis & Forecast
Global Mainframe Market Analysis and Forecast 2026-2032
Market perspective
Mainframe is a centralized, high capacity enterprise computing system comprising a central processor complex, shared memory, general purpose and specialized processors, dedicated input and output processors, high bandwidth communication channels, hardware partitioning and virtualization resources, integrated storage and network interfaces, cryptographic and compression components, and redundant power, cooling, and system control units. It executes workloads through coordinated processor scheduling, protected memory access, logical partitioning, workload isolation, channel based data transfer, continuous hardware monitoring, error correction, failed component isolation, and system recovery.
A mainframe assigns transaction execution, data transfer, storage access, network communication, encryption, compression, and system management to coordinated processing resources. Dedicated input and output processors and communication channels move large volumes of data while limiting demand on general purpose processors, enabling the system to process online transactions, database access, batch jobs, and other enterprise workloads concurrently. Logical partitioning and virtualization allocate processors, memory, and input and output resources among isolated operating environments, allowing multiple operating systems and applications to run concurrently within the same physical system. Capacity management and workload scheduling allocate computing resources according to business priorities to maintain predictable throughput, controlled latency, and continuity for critical tasks.
Mainframes incorporate multiple layers of hardware redundancy, memory and data validation, component monitoring, failure prediction, dynamic component isolation, and automated recovery. Processors, memory, input and output components, power supplies, cooling units, and control modules may include redundant resources. Certain components can be maintained or replaced without interrupting unaffected workloads. Hardware partitioning, access controls, cryptographic modules, key management, and protected execution environments govern access boundaries among data, applications, and workloads. Together, these mechanisms establish the reliability, availability, and serviceability characteristics of a mainframe system.
Read the full market overview
Modern mainframes typically occupy standard data center racks or manufacturer specific cabinets and may consist of one cabinet or several interconnected cabinets. Each cabinet integrates processor drawers, memory, input and output components, network interfaces, power supplies, cooling equipment, and system management modules, with connections to external storage, tape systems, network equipment, and disaster recovery facilities. Physical dimensions alone do not determine whether a computer is a mainframe. Classification depends primarily on centralized system architecture, dedicated input and output processing, logical partitioning, workload management, failure recovery, large scale concurrent transaction processing, and compatibility with established enterprise applications.
Early mainframes were centrally installed electronic computing systems used primarily for batch data processing and centralized computation. The introduction of compatible computer families allowed software developed for a common architecture to operate across multiple performance classes and successive hardware generations. Virtualization, shared resource management, dedicated input and output processing, online transaction processing, relational databases, hardware cryptography, and automated failure recovery subsequently became fundamental elements of mainframe computing. Modern systems retain established application compatibility while running proprietary operating systems, Linux, databases, transaction monitors, Java applications, containerized workloads, and analytical workloads. Network and application interfaces connect these systems with distributed servers and cloud computing environments.
Mainframes generally preserve compatibility with established operating systems, databases, transaction monitors, batch programs, and enterprise applications across successive hardware generations. This continuity allows banks, insurers, government agencies, telecommunications operators, and large enterprises to operate core systems created during different technology cycles while retaining substantial software assets and embedded business rules during hardware replacement. Mainframe procurement, upgrades, and capacity configuration are determined primarily by transaction volumes, concurrent user counts, database size, input and output intensity, availability requirements, recovery objectives, and the existing application environment.
Mainframes are primarily used for core banking, payment clearing, card authorization, securities transaction processing, insurance underwriting and claims administration, government population and tax records, telecommunications billing, airline and railway reservations, retail transactions, supply chain management, and large enterprise batch processing. These workloads typically involve high transaction volumes, dense concurrent access, large shared datasets, strict processing sequences, extensive audit requirements, and significant costs associated with service interruption. Cloud computing, big data, mobile applications, and artificial intelligence may access or operate on mainframe resources. These terms describe computing environments or technical workloads and do not provide a complete classification of mainframe end use industries.
Mainframes and supercomputers address different computing objectives. Mainframes emphasize concurrent execution of diverse business workloads, shared data access, transaction integrity, input and output throughput, continuous availability, and long term software compatibility. Supercomputers emphasize large scale parallel numerical computation, with performance commonly evaluated through floating point capability, computing node count, accelerator performance, interconnect efficiency, and parallel file system throughput. Mainframes commonly execute transaction processing, databases, batch jobs, and enterprise applications. Supercomputers are primarily used for climate modeling, physical simulation, molecular modeling, engineering analysis, and other computationally intensive scientific workloads. Both system classes may incorporate multiple processors, high speed storage, and redundant components, while their architectures, performance measures, and principal workloads remain distinct.
The global Mainframe market is projected to grow from US$ million in 2026 to US$ million by 2032, at a Compound Annual Growth Rate (CAGR) of % during the forecast period.
Mainframe's global sales reached XX (units) with a value of US$ XX Million, marking an change of XX% compared to the previous year. This performance has positioned IBM as the global sales leader, a title it has maintained for several consecutive years. Notably, IBM's performance in primary markets is also remarkable. In the Chinese market, sales were XX (units), a change of XX% from the previous year. In Europe, sales were XX (units), showing a year-on-year of XX%. In the US, sales were XX (units), a year-on-year change of XX%.
The major global manufacturers in the Mainframe market include IBM, Unisys, Fujitsu, NEC Corporation, Hitachi and Eviden, etc. In 2025, the top three vendors accounted for approximately % of the revenue.
In terms of production side, this report researches the Mainframe production, growth rate, market share by manufacturers and by region (region level and country level), from 2021 to 2026, and forecast to 2032.
In terms of consumption side, this report focuses on the sales of Mainframe by region (region level and country level), by Company, by Type and by Application. from 2021 to 2026 and forecast to 2032.
This report presents an overview of global market for Mainframe, capacity, output, revenue and price. Analyses of the global market trends, with historic market revenue or sales data for 2021 - 2025, estimates for 2026, and projections of CAGR through 2032.
This report researches the key producers of Mainframe, also provides the consumption of main regions and countries. Of the upcoming market potential for Mainframe, and key regions or countries of focus to forecast this market into various segments and sub-segments. Country specific data and market value analysis for the U.S., Canada, Mexico, Brazil, China, Japan, South Korea, Southeast Asia, India, Germany, the U.K., Italy, Middle East, Africa, and Other Countries.
This report focuses on the Mainframe sales, revenue, market share and industry ranking of main manufacturers, data from 2021 to 2026. Identification of the major stakeholders in the global Mainframe market, and analysis of their competitive landscape and market positioning based on recent developments and segmental revenues. This report will help stakeholders to understand the competitive landscape and gain more insights and position their businesses and market strategies in a better way.
This report analyzes the segments data by Type and by Application, sales, revenue, and price, from 2021 to 2032. Evaluation and forecast the market size for Mainframe sales, projected growth trends, production technology, application and end-user industry.
Mainframe Segment by Company
IBM
Unisys
Fujitsu
NEC Corporation
Hitachi
Eviden
Mainframe Segment by Type
IBM Z Systems
Unisys ClearPath Systems
Fujitsu GS21 Systems
NEC ACOS Systems
Hitachi AP Systems
Bull GCOS Systems
Mainframe Segment by Application
BFSI
Government
Telecommunications
Retail
Transportation
Others
Mainframe Segment by Region
North America
United States
Canada
Mexico
Europe
Germany
France
U.K.
Italy
Russia
Spain
Netherlands
Switzerland
Sweden
Poland
Asia-Pacific
China
Japan
South Korea
India
Australia
Taiwan
Southeast Asia
South America
Brazil
Argentina
Chile
Colombia
Middle East & Africa
Egypt
South Africa
Israel
Türkiye
GCC Countries
Study Objectives
1. To analyze and research the global status and future forecast, involving, production, value, consumption, growth rate (CAGR), market share, historical and forecast.
2. To present the key manufacturers, capacity, production, revenue, market share, and Recent Developments.
3. To split the breakdown data by regions, type, manufacturers, and Application.
4. To analyze the global and key regions market potential and advantage, opportunity and challenge, restraints, and risks.
5. To identify significant trends, drivers, influence factors in global and regions.
6. To analyze competitive developments such as expansions, agreements, new product launches, and acquisitions in the market.
Reasons to Buy This Report
1. This report will help the readers to understand the competition within the industries and strategies for the competitive environment to enhance the potential profit. The report also focuses on the competitive landscape of the global Mainframe market, and introduces in detail the market share, industry ranking, competitor ecosystem, market performance, new product development, operation situation, expansion, and acquisition. etc. of the main players, which helps the readers to identify the main competitors and deeply understand the competition pattern of the market.
2. This report will help stakeholders to understand the global industry status and trends of Mainframe and provides them with information on key market drivers, restraints, challenges, and opportunities.
3. This report will help stakeholders to understand competitors better and gain more insights to strengthen their position in their businesses. The competitive landscape section includes the market share and rank (in volume and value), competitor ecosystem, new product development, expansion, and acquisition.
4. This report stays updated with novel technology integration, features, and the latest developments in the market.
5. This report helps stakeholders to gain insights into which regions to target globally.
6. This report helps stakeholders to gain insights into the end-user perception concerning the adoption of Mainframe.
7. This report helps stakeholders to identify some of the key players in the market and understand their valuable contribution.
Chapter Outline
Chapter 1: Introduces the report scope of the report, executive summary of different market segments (by type and by application, etc), including the market size of each market segment, future development potential, and so on. It offers a high-level view of the current state of the market and its likely evolution in the short to mid-term, and long term.
Chapter 2: Introduces the market dynamics, latest developments of the market, the driving factors and restrictive factors of the market, the challenges and risks faced by manufacturers in the industry, and the analysis of relevant policies in the industry.
Chapter 3: Mainframe production/output of global and key producers (regions/countries). It provides a quantitative analysis of the production, and development potential of each producer in the next six years.
Chapter 4: Sales (consumption), revenue of Mainframe in global, regional level and country level. It provides a quantitative analysis of the market size and development potential of each region and its main countries and introduces the market development, future development prospects, market space of each country in the world.
Chapter 5: Detailed analysis of Mainframe manufacturers competitive landscape, price, sales, revenue, market share and industry ranking, latest development plan, merger, and acquisition information, etc.
Chapter 6: Provides the analysis of various market segments by type, covering the sales, revenue, average price, and development potential of each market segment, to help readers find the blue ocean market in different market segments.
Chapter 7: Provides the analysis of various market segments by application, covering the sales, revenue, average price, and development potential of each market segment, to help readers find the blue ocean market in different downstream markets.
Chapter 8: Provides profiles of key manufacturers, introducing the basic situation of the main companies in the market in detail, including product descriptions and specifications, Mainframe sales, revenue, price, gross margin, and recent development, etc.
Chapter 9: North America by type, by application and by country, sales, and revenue for each segment.
Chapter 10: Europe by type, by application and by country, sales, and revenue for each segment.
Chapter 11: China by type, by application, sales, and revenue for each segment.
Chapter 12: Asia (Excluding China) by type, by application and by region, sales, and revenue for each segment.
Chapter 13: South America, Middle East and Africa by type, by application and by country, sales, and revenue for each segment.
Chapter 14: Analysis of industrial chain, sales channel, key raw materials, distributors and customers.
Chapter 15: The main concluding insights of the report.
More report detail
Tables and figures
Scope & coverage.
Types
- IBM Z Systems
- Unisys ClearPath Systems
- Fujitsu GS21 Systems
- NEC ACOS Systems
- Hitachi AP Systems
- Bull GCOS Systems
Applications
- BFSI
- Government
- Telecommunications
- Retail
- Transportation
- Others
Companies covered
- IBM
- Unisys
- Fujitsu
- NEC Corporation
- Hitachi
- Eviden
Inside the report.
1 Market Overview
- 1.1 Product Definition
- 1.2 Mainframe Market by Type
- 1.2.1 Global Mainframe Market Size by Type, 2021 VS 2025 VS 2032
- 1.2.2 IBM Z Systems
- 1.2.3 Unisys ClearPath Systems
- 1.2.4 Fujitsu GS21 Systems
- 1.2.5 NEC ACOS Systems
- 1.2.6 Hitachi AP Systems
- 1.2.7 Bull GCOS Systems
- 1.3 Mainframe Market by Application
- 1.3.1 Global Mainframe Market Size by Application, 2021 VS 2025 VS 2032
- 1.3.2 BFSI
- 1.3.3 Government
- 1.3.4 Telecommunications
- 1.3.5 Retail
- 1.3.6 Transportation
- 1.3.7 Others
- 1.4 Assumptions and Limitations
- 1.5 Study Goals and Objectives
2 Mainframe Market Dynamics
- 2.1 Mainframe Industry Trends
- 2.2 Mainframe Industry Drivers
- 2.3 Mainframe Industry Opportunities and Challenges
- 2.4 Mainframe Industry Restraints
3 Global Mainframe Production Overview
- 3.1 Global Mainframe Production Capacity (2021-2032)
- 3.2 Global Mainframe Production by Region: 2021 VS 2025 VS 2032
- 3.3 Global Mainframe Production by Region
- 3.3.1 Global Mainframe Production by Region (2021-2026)
- 3.3.2 Global Mainframe Production by Region (2027-2032)
- 3.3.3 Global Mainframe Production Market Share by Region (2021-2032)
- 3.4 North America
- 3.5 Europe
- 3.6 China
- 3.7 Japan
4 Global Market Growth Prospects
- 4.1 Global Mainframe Revenue Estimates and Forecasts (2021-2032)
- 4.2 Global Mainframe Revenue by Region
- 4.2.1 Global Mainframe Revenue by Region: 2021 VS 2025 VS 2032
- 4.2.2 Global Mainframe Revenue by Region (2021-2026)
- 4.2.3 Global Mainframe Revenue by Region (2027-2032)
- 4.2.4 Global Mainframe Revenue Market Share by Region (2021-2032)
- 4.3 Global Mainframe Sales Estimates and Forecasts 2021-2032
- 4.4 Global Mainframe Sales by Region
- 4.4.1 Global Mainframe Sales by Region: 2021 VS 2025 VS 2032
- 4.4.2 Global Mainframe Sales by Region (2021-2026)
- 4.4.3 Global Mainframe Sales by Region (2027-2032)
- 4.4.4 Global Mainframe Sales Market Share by Region (2021-2032)
- 4.5 North America
- 4.6 Europe
- 4.7 China
- 4.8 Asia (Excluding China)
- 4.9 South America, Middle East and Africa
5 Market Competitive Landscape by Manufacturers
- 5.1 Global Mainframe Revenue by Manufacturers
- 5.1.1 Global Mainframe Revenue by Manufacturers (2021-2026)
- 5.1.2 Global Mainframe Revenue Market Share by Manufacturers (2021-2026)
- 5.1.3 Global Mainframe Manufacturers Revenue Share Top 10 and Top 5 in 2025
- 5.2 Global Mainframe Sales by Manufacturers
- 5.2.1 Global Mainframe Sales by Manufacturers (2021-2026)
- 5.2.2 Global Mainframe Sales Market Share by Manufacturers (2021-2026)
- 5.2.3 Global Mainframe Manufacturers Sales Share Top 10 and Top 5 in 2025
- 5.3 Global Mainframe Sales Price by Manufacturers (2021-2026)
- 5.4 Global Mainframe Key Manufacturers Ranking, 2024 VS 2025 VS 2026
- 5.5 Global Mainframe Key Manufacturers Manufacturing Sites & Headquarters
- 5.6 Global Mainframe Manufacturers, Product Type & Application
- 5.7 Global Mainframe Manufacturers Commercialization Time
- 5.8 Market Competitive Analysis
- 5.8.1 Global Mainframe Market CR5 and HHI
- 5.8.2 2025 Mainframe Tier 1, Tier 2, and Tier 3
6 Mainframe Market by Type
- 6.1 Global Mainframe Revenue by Type
- 6.1.1 Global Mainframe Revenue by Type (2021-2032) & (US$ Million)
- 6.1.2 Global Mainframe Revenue Market Share by Type (2021-2032)
- 6.2 Global Mainframe Sales by Type
- 6.2.1 Global Mainframe Sales by Type (2021-2032) & (units)
- 6.2.2 Global Mainframe Sales Market Share by Type (2021-2032)
- 6.3 Global Mainframe Price by Type
7 Mainframe Market by Application
- 7.1 Global Mainframe Revenue by Application
- 7.1.1 Global Mainframe Revenue by Application (2021-2032) & (US$ Million)
- 7.1.2 Global Mainframe Revenue Market Share by Application (2021-2032)
- 7.2 Global Mainframe Sales by Application
- 7.2.1 Global Mainframe Sales by Application (2021-2032) & (units)
- 7.2.2 Global Mainframe Sales Market Share by Application (2021-2032)
- 7.3 Global Mainframe Price by Application
8 Company Profiles
- 8.1 IBM
- 8.1.1 IBM Company Information
- 8.1.2 IBM Business Overview
- 8.1.3 IBM Mainframe Sales, Revenue, Price and Gross Margin (2021-2026)
- 8.1.4 IBM Mainframe Product Portfolio
- 8.1.5 IBM Recent Developments
- 8.2 Unisys
- 8.2.1 Unisys Company Information
- 8.2.2 Unisys Business Overview
- 8.2.3 Unisys Mainframe Sales, Revenue, Price and Gross Margin (2021-2026)
- 8.2.4 Unisys Mainframe Product Portfolio
- 8.2.5 Unisys Recent Developments
- 8.3 Fujitsu
- 8.3.1 Fujitsu Company Information
- 8.3.2 Fujitsu Business Overview
- 8.3.3 Fujitsu Mainframe Sales, Revenue, Price and Gross Margin (2021-2026)
- 8.3.4 Fujitsu Mainframe Product Portfolio
- 8.3.5 Fujitsu Recent Developments
- 8.4 NEC Corporation
- 8.4.1 NEC Corporation Company Information
- 8.4.2 NEC Corporation Business Overview
- 8.4.3 NEC Corporation Mainframe Sales, Revenue, Price and Gross Margin (2021-2026)
- 8.4.4 NEC Corporation Mainframe Product Portfolio
- 8.4.5 NEC Corporation Recent Developments
- 8.5 Hitachi
- 8.5.1 Hitachi Company Information
- 8.5.2 Hitachi Business Overview
- 8.5.3 Hitachi Mainframe Sales, Revenue, Price and Gross Margin (2021-2026)
- 8.5.4 Hitachi Mainframe Product Portfolio
- 8.5.5 Hitachi Recent Developments
- 8.6 Eviden
- 8.6.1 Eviden Company Information
- 8.6.2 Eviden Business Overview
- 8.6.3 Eviden Mainframe Sales, Revenue, Price and Gross Margin (2021-2026)
- 8.6.4 Eviden Mainframe Product Portfolio
- 8.6.5 Eviden Recent Developments
9 North America
- 9.1 North America Mainframe Market Size by Type
- 9.1.1 North America Mainframe Revenue by Type (2021-2032)
- 9.1.2 North America Mainframe Sales by Type (2021-2032)
- 9.1.3 North America Mainframe Price by Type (2021-2032)
- 9.2 North America Mainframe Market Size by Application
- 9.2.1 North America Mainframe Revenue by Application (2021-2032)
- 9.2.2 North America Mainframe Sales by Application (2021-2032)
- 9.2.3 North America Mainframe Price by Application (2021-2032)
- 9.3 North America Mainframe Market Size by Country
- 9.3.1 North America Mainframe Revenue Grow Rate by Country (2021 VS 2025 VS 2032)
- 9.3.2 North America Mainframe Sales by Country (2021 VS 2025 VS 2032)
- 9.3.3 North America Mainframe Price by Country (2021-2032)
- 9.3.4 United States
- 9.3.5 Canada
- 9.3.6 Mexico
10 Europe
- 10.1 Europe Mainframe Market Size by Type
- 10.1.1 Europe Mainframe Revenue by Type (2021-2032)
- 10.1.2 Europe Mainframe Sales by Type (2021-2032)
- 10.1.3 Europe Mainframe Price by Type (2021-2032)
- 10.2 Europe Mainframe Market Size by Application
- 10.2.1 Europe Mainframe Revenue by Application (2021-2032)
- 10.2.2 Europe Mainframe Sales by Application (2021-2032)
- 10.2.3 Europe Mainframe Price by Application (2021-2032)
- 10.3 Europe Mainframe Market Size by Country
- 10.3.1 Europe Mainframe Revenue Grow Rate by Country (2021 VS 2025 VS 2032)
- 10.3.2 Europe Mainframe Sales by Country (2021 VS 2025 VS 2032)
- 10.3.3 Europe Mainframe Price by Country (2021-2032)
- 10.3.4 Germany
- 10.3.5 France
- 10.3.6 U.K.
- 10.3.7 Italy
- 10.3.8 Russia
- 10.3.9 Spain
- 10.3.10 Netherlands
- 10.3.11 Switzerland
- 10.3.12 Sweden
11 China
- 11.1 China Mainframe Market Size by Type
- 11.1.1 China Mainframe Revenue by Type (2021-2032)
- 11.1.2 China Mainframe Sales by Type (2021-2032)
- 11.1.3 China Mainframe Price by Type (2021-2032)
- 11.2 China Mainframe Market Size by Application
- 11.2.1 China Mainframe Revenue by Application (2021-2032)
- 11.2.2 China Mainframe Sales by Application (2021-2032)
- 11.2.3 China Mainframe Price by Application (2021-2032)
12 Asia (Excluding China)
- 12.1 Asia Mainframe Market Size by Type
- 12.1.1 Asia Mainframe Revenue by Type (2021-2032)
- 12.1.2 Asia Mainframe Sales by Type (2021-2032)
- 12.1.3 Asia Mainframe Price by Type (2021-2032)
- 12.2 Asia Mainframe Market Size by Application
- 12.2.1 Asia Mainframe Revenue by Application (2021-2032)
- 12.2.2 Asia Mainframe Sales by Application (2021-2032)
- 12.2.3 Asia Mainframe Price by Application (2021-2032)
- 12.3 Asia Mainframe Market Size by Country
- 12.3.1 Asia Mainframe Revenue Grow Rate by Country (2021 VS 2025 VS 2032)
- 12.3.2 Asia Mainframe Sales by Country (2021 VS 2025 VS 2032)
- 12.3.3 Asia Mainframe Price by Country (2021-2032)
- 12.3.4 Japan
- 12.3.5 South Korea
- 12.3.6 India
- 12.3.7 Australia
- 12.3.8 Taiwan
- 12.3.9 Southeast Asia
13 South America, Middle East and Africa
- 13.1 SAMEA Mainframe Market Size by Type
- 13.1.1 SAMEA Mainframe Revenue by Type (2021-2032)
- 13.1.2 SAMEA Mainframe Sales by Type (2021-2032)
- 13.1.3 SAMEA Mainframe Price by Type (2021-2032)
- 13.2 SAMEA Mainframe Market Size by Application
- 13.2.1 SAMEA Mainframe Revenue by Application (2021-2032)
- 13.2.2 SAMEA Mainframe Sales by Application (2021-2032)
- 13.2.3 SAMEA Mainframe Price by Application (2021-2032)
- 13.3 SAMEA Mainframe Market Size by Country
- 13.3.1 SAMEA Mainframe Revenue Grow Rate by Country (2021 VS 2025 VS 2032)
- 13.3.2 SAMEA Mainframe Sales by Country (2021 VS 2025 VS 2032)
- 13.3.3 SAMEA Mainframe Price by Country (2021-2032)
- 13.3.4 Brazil
- 13.3.5 Argentina
- 13.3.6 Chile
- 13.3.7 Colombia
- 13.3.8 Peru
- 13.3.9 Saudi Arabia
- 13.3.10 Israel
- 13.3.11 UAE
- 13.3.12 Turkey
- 13.3.13 Iran
- 13.3.14 Egypt
14 Value Chain and Sales Channels Analysis
- 14.1 Mainframe Value Chain Analysis
- 14.1.1 Mainframe Key Raw Materials
- 14.1.2 Raw Materials Key Suppliers
- 14.1.3 Manufacturing Cost Structure
- 14.1.4 Mainframe Production Mode & Process
- 14.2 Mainframe Sales Channels Analysis
- 14.2.1 Direct Comparison with Distribution Share
- 14.2.2 Mainframe Distributors
- 14.2.3 Mainframe Customers
15 Concluding Insights
16 Appendix
- 16.1 Reasons for Doing This Study
- 16.2 Research Methodology
- 16.3 Research Process
- 16.4 Authors List of This Report
- 16.5 Data Source
- 16.5.1 Secondary Sources
- 16.5.2 Primary Sources
- 16.6 Disclaimer
GET THE RESEARCH
Choose your license.
Choose who needs access.
All options are for this report and research series.
PDF by email within 3–5 working days after payment confirmation.
Talk to an analyst