
Global Low-Dosage Hydrate Inhibitors (LDHIs) Market Analysis and Forecast 2026-2032
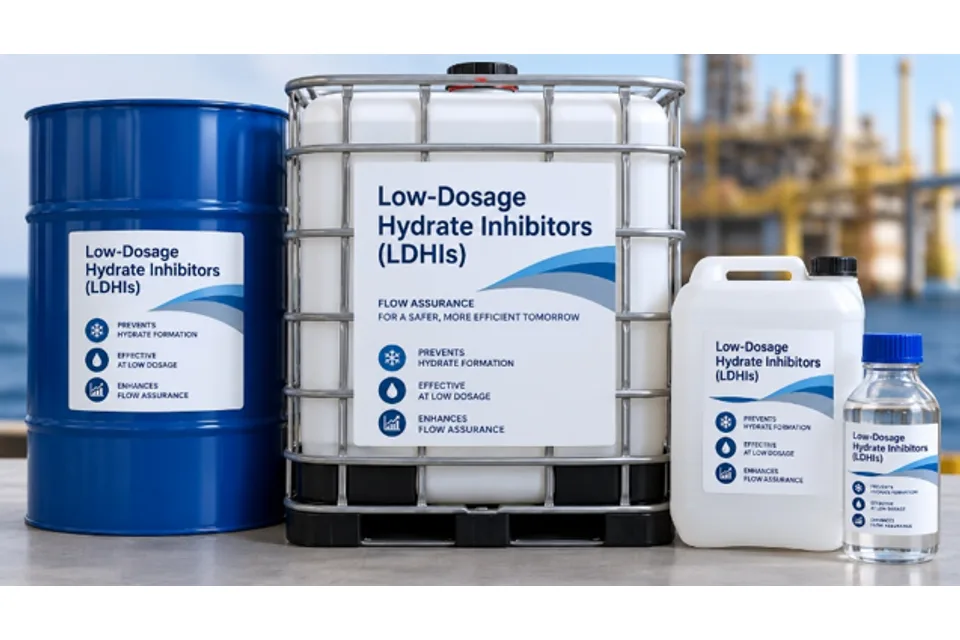
Low Dosage Hydrate Inhibitors (LDHIs) are specialized oilfield production chemicals used to control gas hydrate crystallization and particle agglomeration in natural gas production, crude oil production, and multiphase hydrocarbon transportation systems. Natural gas hydrates are crystalline clathrate compounds formed when water molecules assemble into hydrogen bonded cage structures that incorporate small gas molecules, principally methane, ethane, propane, carbon dioxide, and hydrogen sulfide. Their formation is thermodynamically favored under elevated pressure and reduced temperature when free water and hydrate forming gases coexist. Hydrate formation can occur at temperatures substantially above the freezing point of water, particularly in pressurized gas production and subsea transportation systems. The resulting crystals may adhere to pipe surfaces, accumulate at flow restrictions, or combine into larger cohesive aggregates. Progressive accumulation increases hydraulic resistance, reduces effective flow area, and can eventually produce solid plugs that interrupt production. LDHIs modify the physical and chemical processes governing hydrate nucleation, crystal growth, and particle interactions at relatively low treatment concentrations. Conventional thermodynamic inhibitors, including methanol and monoethylene glycol, reduce water activity and shift the hydrate equilibrium boundary toward lower temperatures or higher pressures. LDHIs principally influence hydrate formation kinetics and particle behavior, allowing treated fluids to operate within the thermodynamic hydrate stability region under defined conditions. Their commercial formulations are classified into Kinetic Hydrate Inhibitors (KHIs) and Antiagglomerants (AAs), with chemical dosage commonly determined relative to the volume or mass of the produced aqueous phase.
Kinetic Hydrate Inhibitors (KHIs) are primarily polymeric chemicals that delay hydrate nucleation and restrict crystal growth by modifying molecular interactions at developing hydrate structures. Commercial KHI chemistry includes polyvinylcaprolactam, polyvinylpyrrolidone, and copolymers containing vinylcaprolactam, vinylpyrrolidone, and related functional monomers. These polymers contain polar lactam groups and hydrophobic molecular segments that influence their affinity for aqueous environments and developing hydrate surfaces. Their molecular interactions can interfere with the establishment of stable crystal nuclei and the incorporation of additional water and gas molecules into growing hydrate lattices. Polymer composition, molecular weight distribution, functional group arrangement, and solution behavior affect the extent of kinetic inhibition. KHI treatment extends the induction period preceding detectable hydrate formation and can reduce subsequent crystal growth rates, providing a finite interval during which hydrocarbon fluids can pass through hydrate forming operating conditions. The available inhibition period is governed by hydrate subcooling, pressure, gas composition, inhibitor concentration, water chemistry, and fluid residence time. Hydrate subcooling represents the difference between the hydrate equilibrium temperature and the operating temperature at the prevailing pressure and gas composition. Greater subcooling generally increases the thermodynamic driving force for crystallization and shortens the effective kinetic protection interval. Prolonged residence times, extended production shutdowns, and changes in dissolved salt concentrations can further influence inhibitor effectiveness. Polymer solubility, cloud point behavior, and compatibility with produced water constituents also affect the concentration of active inhibitor available within the aqueous phase. KHI formulations are particularly relevant to wet gas and gas condensate systems in which hydrate formation can be delayed for the duration of normal production or transportation, although their operating limits become increasingly restrictive as subcooling and exposure time increase.
Antiagglomerants (AAs) are predominantly surface active chemicals that control the cohesion and accumulation of hydrate particles within multiphase hydrocarbon fluids. Commercial AA formulations commonly contain amphiphilic molecules, including quaternary ammonium compounds and other surfactant structures with polar functional groups and hydrophobic hydrocarbon chains. These molecular structures interact with water droplets, hydrate crystal surfaces, and the surrounding hydrocarbon liquid, modifying interfacial properties and reducing the adhesive forces between hydrate particles. Hydrate crystallization can continue in the presence of an effective AA treatment, while the resulting solids remain sufficiently dispersed to move with the flowing hydrocarbon stream. The treated mixture consequently contains a suspension of hydrate particles whose mobility depends on solids concentration, continuous phase characteristics, and slurry rheology. The reduction of particle cohesion limits the development of large aggregates and continuous hydrate networks capable of obstructing pipelines. AA performance is strongly influenced by water cut, liquid hydrocarbon availability, phase continuity, gas to oil ratio, crude oil or condensate composition, droplet size distribution, fluid shear, and hydrate solids loading. The presence of a suitable liquid hydrocarbon phase facilitates the dispersion and transportation of hydrate particles, while increasing aqueous phase content can raise solids loading, alter emulsion structure, and increase slurry viscosity. Certain formulations retain effectiveness under elevated water cuts, although their performance remains dependent on the specific fluid composition and flow conditions. Natural surfactants present in crude oil, including acidic and polar constituents, may interact with injected AAs and alter hydrate particle wettability or interfacial behavior. Dissolved salts and other production chemicals can also influence surfactant distribution and particle interactions. AA treatment can accommodate substantial hydrate subcooling because its principal mechanism acts on particle adhesion and dispersion after hydrate nucleation, with hydraulic transportability becoming a central constraint as hydrate solids accumulate.
The effectiveness of LDHIs is closely associated with the pressure, temperature, phase composition, and hydraulic conditions encountered throughout oil and gas production systems. Hydrate prone environments occur in production tubing, wellheads, subsea trees, manifolds, risers, subsea flowlines, onshore gathering networks, and pressurized natural gas pipelines. Deepwater production systems experience continuous heat transfer from produced fluids to surrounding seawater, while cold climate onshore facilities may undergo substantial cooling during transportation. Pressure reductions across production equipment can produce additional cooling through gas expansion, increasing local hydrate formation risk. During normal production, variations in flow velocity, pressure gradients, and liquid holdup influence the residence time and distribution of hydrate forming fluids. During shutdown, stagnant production fluids can cool toward ambient temperature and remain within the hydrate stability region for extended periods. Subsequent restart conditions may involve accumulated liquids, changing phase distributions, mobilization of settled particles, and transient pressure and temperature profiles. These operating conditions influence the available kinetic protection period of KHIs and the suspension stability and transportability of hydrate particles under AA treatment. Changes in reservoir production characteristics over the life of an oil or gas field also affect chemical requirements. Increasing water production, declining reservoir pressure, changes in condensate yield, and variations in gas composition can modify hydrate equilibrium conditions, aqueous phase volumes, and the hydrodynamic behavior of the produced fluids. Consequently, inhibitor performance is governed by the combined effects of active chemical concentration, fluid thermodynamics, phase distribution, crystallization kinetics, and multiphase flow behavior.
Commercial LDHI formulations contain active polymeric or surfactant components combined with solvents, solubilizing agents, and selected formulation additives that influence chemical stability, solubility, viscosity, and distribution within the production stream. KHI formulations commonly incorporate polymeric active ingredients in aqueous, glycol, or other compatible solvent systems, while AA formulations frequently contain surfactant mixtures and hydrocarbon compatible carriers. The concentration and molecular structure of active components determine the intrinsic inhibitory properties of a formulation, while carrier composition affects its injection characteristics, compatibility with produced fluids, and distribution between aqueous and hydrocarbon phases. Solvent selection and formulation viscosity are particularly relevant to subsea chemical injection systems, where low ambient temperatures, long chemical supply lines, and restricted hydraulic capacity can affect delivery. Effective treatment requires sufficient chemical contact with the water containing production stream before significant hydrate crystallization or particle accumulation develops. Injection location, mixing efficiency, chemical partitioning, production flow rate, and the spatial distribution of water within the multiphase stream influence the concentration of active material available at hydrate forming interfaces. Chemical compatibility with corrosion inhibitors, scale inhibitors, demulsifiers, and other production additives can further affect solution stability, emulsion behavior, and interfacial activity. The quantity of formulated product consumed depends on produced water throughput, target active concentration, formulation strength, and operating conditions. LDHIs are consequently applied across offshore and onshore oil and gas fields, including deepwater subsea developments, long distance subsea tiebacks, gas condensate production, wet gas gathering, and cold climate hydrocarbon transportation, where hydrate formation and solids accumulation represent material constraints on continuous production and fluid transportation.
Product & engineering
Understand the product.
Low Dosage Hydrate Inhibitors (LDHIs) are specialized oilfield production chemicals used to control gas hydrate crystallization and particle agglomeration in natural gas production, crude oil production, and multiphase hydrocarbon transportation systems. Natural gas hydrates are crystalline clathrate compounds formed when water molecules assemble into hydrogen bonded cage structures that incorporate small gas molecules, principally methane, ethane, propane, carbon dioxide, and hydrogen sulfide. Their formation is thermodynamically favored under elevated pressure and reduced temperature when free water and hydrate forming gases coexist. Hydrate formation can occur at temperatures substantially above the freezing point of water, particularly in pressurized gas production and subsea transportation systems. The resulting crystals may adhere to pipe surfaces, accumulate at flow restrictions, or combine into larger cohesive aggregates. Progressive accumulation increases hydraulic resistance, reduces effective flow area, and can eventually produce solid plugs that interrupt production. LDHIs modify the physical and chemical processes governing hydrate nucleation, crystal growth, and particle interactions at relatively low treatment concentrations. Conventional thermodynamic inhibitors, including methanol and monoethylene glycol, reduce water activity and shift the hydrate equilibrium boundary toward lower temperatures or higher pressures. LDHIs principally influence hydrate formation kinetics and particle behavior, allowing treated fluids to operate within the thermodynamic hydrate stability region under defined conditions. Their commercial formulations are classified into Kinetic Hydrate Inhibitors (KHIs) and Antiagglomerants (AAs), with chemical dosage commonly determined relative to the volume or mass of the produced aqueous phase.
Kinetic Hydrate Inhibitors (KHIs) are primarily polymeric chemicals that delay hydrate nucleation and restrict crystal growth by modifying molecular interactions at developing hydrate structures. Commercial KHI chemistry includes polyvinylcaprolactam, polyvinylpyrrolidone, and copolymers containing vinylcaprolactam, vinylpyrrolidone, and related functional monomers. These polymers contain polar lactam groups and hydrophobic molecular segments that influence their affinity for aqueous environments and developing hydrate surfaces. Their molecular interactions can interfere with the establishment of stable crystal nuclei and the incorporation of additional water and gas molecules into growing hydrate lattices. Polymer composition, molecular weight distribution, functional group arrangement, and solution behavior affect the extent of kinetic inhibition. KHI treatment extends the induction period preceding detectable hydrate formation and can reduce subsequent crystal growth rates, providing a finite interval during which hydrocarbon fluids can pass through hydrate forming operating conditions. The available inhibition period is governed by hydrate subcooling, pressure, gas composition, inhibitor concentration, water chemistry, and fluid residence time. Hydrate subcooling represents the difference between the hydrate equilibrium temperature and the operating temperature at the prevailing pressure and gas composition. Greater subcooling generally increases the thermodynamic driving force for crystallization and shortens the effective kinetic protection interval. Prolonged residence times, extended production shutdowns, and changes in dissolved salt concentrations can further influence inhibitor effectiveness. Polymer solubility, cloud point behavior, and compatibility with produced water constituents also affect the concentration of active inhibitor available within the aqueous phase. KHI formulations are particularly relevant to wet gas and gas condensate systems in which hydrate formation can be delayed for the duration of normal production or transportation, although their operating limits become increasingly restrictive as subcooling and exposure time increase.
Antiagglomerants (AAs) are predominantly surface active chemicals that control the cohesion and accumulation of hydrate particles within multiphase hydrocarbon fluids. Commercial AA formulations commonly contain amphiphilic molecules, including quaternary ammonium compounds and other surfactant structures with polar functional groups and hydrophobic hydrocarbon chains. These molecular structures interact with water droplets, hydrate crystal surfaces, and the surrounding hydrocarbon liquid, modifying interfacial properties and reducing the adhesive forces between hydrate particles. Hydrate crystallization can continue in the presence of an effective AA treatment, while the resulting solids remain sufficiently dispersed to move with the flowing hydrocarbon stream. The treated mixture consequently contains a suspension of hydrate particles whose mobility depends on solids concentration, continuous phase characteristics, and slurry rheology. The reduction of particle cohesion limits the development of large aggregates and continuous hydrate networks capable of obstructing pipelines. AA performance is strongly influenced by water cut, liquid hydrocarbon availability, phase continuity, gas to oil ratio, crude oil or condensate composition, droplet size distribution, fluid shear, and hydrate solids loading. The presence of a suitable liquid hydrocarbon phase facilitates the dispersion and transportation of hydrate particles, while increasing aqueous phase content can raise solids loading, alter emulsion structure, and increase slurry viscosity. Certain formulations retain effectiveness under elevated water cuts, although their performance remains dependent on the specific fluid composition and flow conditions. Natural surfactants present in crude oil, including acidic and polar constituents, may interact with injected AAs and alter hydrate particle wettability or interfacial behavior. Dissolved salts and other production chemicals can also influence surfactant distribution and particle interactions. AA treatment can accommodate substantial hydrate subcooling because its principal mechanism acts on particle adhesion and dispersion after hydrate nucleation, with hydraulic transportability becoming a central constraint as hydrate solids accumulate.
The effectiveness of LDHIs is closely associated with the pressure, temperature, phase composition, and hydraulic conditions encountered throughout oil and gas production systems. Hydrate prone environments occur in production tubing, wellheads, subsea trees, manifolds, risers, subsea flowlines, onshore gathering networks, and pressurized natural gas pipelines. Deepwater production systems experience continuous heat transfer from produced fluids to surrounding seawater, while cold climate onshore facilities may undergo substantial cooling during transportation. Pressure reductions across production equipment can produce additional cooling through gas expansion, increasing local hydrate formation risk. During normal production, variations in flow velocity, pressure gradients, and liquid holdup influence the residence time and distribution of hydrate forming fluids. During shutdown, stagnant production fluids can cool toward ambient temperature and remain within the hydrate stability region for extended periods. Subsequent restart conditions may involve accumulated liquids, changing phase distributions, mobilization of settled particles, and transient pressure and temperature profiles. These operating conditions influence the available kinetic protection period of KHIs and the suspension stability and transportability of hydrate particles under AA treatment. Changes in reservoir production characteristics over the life of an oil or gas field also affect chemical requirements. Increasing water production, declining reservoir pressure, changes in condensate yield, and variations in gas composition can modify hydrate equilibrium conditions, aqueous phase volumes, and the hydrodynamic behavior of the produced fluids. Consequently, inhibitor performance is governed by the combined effects of active chemical concentration, fluid thermodynamics, phase distribution, crystallization kinetics, and multiphase flow behavior.
Commercial LDHI formulations contain active polymeric or surfactant components combined with solvents, solubilizing agents, and selected formulation additives that influence chemical stability, solubility, viscosity, and distribution within the production stream. KHI formulations commonly incorporate polymeric active ingredients in aqueous, glycol, or other compatible solvent systems, while AA formulations frequently contain surfactant mixtures and hydrocarbon compatible carriers. The concentration and molecular structure of active components determine the intrinsic inhibitory properties of a formulation, while carrier composition affects its injection characteristics, compatibility with produced fluids, and distribution between aqueous and hydrocarbon phases. Solvent selection and formulation viscosity are particularly relevant to subsea chemical injection systems, where low ambient temperatures, long chemical supply lines, and restricted hydraulic capacity can affect delivery. Effective treatment requires sufficient chemical contact with the water containing production stream before significant hydrate crystallization or particle accumulation develops. Injection location, mixing efficiency, chemical partitioning, production flow rate, and the spatial distribution of water within the multiphase stream influence the concentration of active material available at hydrate forming interfaces. Chemical compatibility with corrosion inhibitors, scale inhibitors, demulsifiers, and other production additives can further affect solution stability, emulsion behavior, and interfacial activity. The quantity of formulated product consumed depends on produced water throughput, target active concentration, formulation strength, and operating conditions. LDHIs are consequently applied across offshore and onshore oil and gas fields, including deepwater subsea developments, long distance subsea tiebacks, gas condensate production, wet gas gathering, and cold climate hydrocarbon transportation, where hydrate formation and solids accumulation represent material constraints on continuous production and fluid transportation.
Selected research
Market Analysis & Forecast
Global Low-Dosage Hydrate Inhibitors (LDHIs) Market Analysis and Forecast 2026-2032
MARKET AT A GLANCE
Scale & outlook
- 2025
- 349.54USD million
- 2032
- 494.25USD million
Select a bar to inspect its value.
Source: APO Research, Inc.
Market perspective
According to APO Research, Inc, the global Low Dosage Hydrate Inhibitors (LDHIs) market was valued at US$349.54 million in 2025 and is estimated to reach US$357.23 million in 2026 and US$494.25 million by 2032, representing a compound annual growth rate (CAGR) of 5.56% from 2026 to 2032. Global sales volume is estimated to increase from 45,800 tonnes in 2026 to 61,000 tonnes in 2032, while the average selling price rises from US$7,799.78 to US$8,102.46 per tonne. At constant 2026 prices, the additional 15,200 tonnes account for approximately US$118.56 million, or 86.53% of the projected US$137.02 million revenue increase. Estimated formulation capacity expands from 70,000 to 86,500 tonnes annually, with capacity utilization increasing from 65.43% to 70.52%. Physical consumption growth is therefore the principal contributor to the projected market expansion, with demand determined by treated water throughput, hydrate formation conditions, and the commercial penetration of specialized inhibitor formulations.
Offshore production developments in South America and West Africa are expanding the installed base of subsea production and transportation systems exposed to hydrate formation. ExxonMobil commenced production from the Yellowtail development in Guyana in August 2025, adding an FPSO with initial annual average production capacity of 250,000 barrels per day and bringing installed capacity across its four Guyana developments above 900,000 barrels per day. In Brazil, Petrobras started production from the P79 FPSO at the Búzios field in May 2026, adding 180,000 barrels per day of oil production capacity and a development comprising 14 planned wells. Angola's Agogo FPSO commenced production in July 2025 as part of Azule Energy's Agogo Integrated West Hub project, targeting combined peak production of 175,000 barrels per day from the Agogo and Ndungu fields. These developments increase the number of subsea wells, flowlines, and production connections requiring hydrate risk management. Actual LDHI consumption depends on the treated aqueous phase, operating temperature, pressure, and the chemical treatment selected for each production system. Mature offshore fields provide an additional demand source as changing water production and shutdown conditions alter the required chemical treatment.
Commercial field applications demonstrate the relationship between inhibitor chemistry, injection volume, and operating economics. In a Canadian natural gas pipeline application, SLB reduced chemical injection from approximately 4,000 liters per day of methanol to 700 liters per day of its GT7569 kinetic hydrate inhibitor, reducing chemical consumption by more than 80% and chemical and operating costs by more than 50%. In June 2026, Clariant disclosed successful offshore applications of its HYTREAT ECO antiagglomerant technology in Norway and the United Kingdom, with field treatment concentrations ranging from below 1% to 2% by volume relative to produced water. The United Kingdom application replaced subsea methanol injection in a gas condensate field experiencing hydrate subcooling of up to 25°C at approximately 130 barg. These operating results establish different commercial requirements for the two principal product categories. Kinetic Hydrate Inhibitors (KHIs) are applicable where hydrate nucleation can be delayed for the required fluid residence period, particularly in wet gas gathering and transportation. Antiagglomerants (AAs) are applicable to suitable multiphase production systems where formed hydrate particles can remain dispersed in the flowing hydrocarbon phase.
Full market overview
Competition encompasses polymer manufacturers, specialty surfactant producers, and integrated oilfield chemical suppliers. Innospec introduced its LaZuli HIW 6910 antiagglomerant for deepwater subsea production in March 2025, while Italmatch offers ECO K530 kinetic hydrate inhibitor and ECO GAA007 B antiagglomerant formulations. SLB completed its acquisition of ChampionX in July 2025, integrating an established production chemicals business into its existing chemical treatment operations. KHI manufacturing relies principally on specialized vinylcaprolactam and vinylpyrrolidone polymer chemistry, while AA formulations use surface active molecules, including quaternary ammonium compounds, together with solvents and other formulation components. Polymer composition, active ingredient concentration, low temperature fluid compatibility, and chemical injection requirements influence manufacturing costs and achievable treatment concentrations. Commercial differentiation is closely associated with demonstrated performance under the produced fluid conditions of individual fields, particularly hydrate subcooling, water cut, liquid hydrocarbon availability, and restart duration.
This report presents an overview of global market for Low-Dosage Hydrate Inhibitors (LDHIs), capacity, output, revenue and price. Analyses of the global market trends, with historic market revenue or sales data for 2021 - 2025, estimates for 2026, and projections of CAGR through 2032.
This report researches the key producers of Low-Dosage Hydrate Inhibitors (LDHIs), also provides the consumption of main regions and countries. Of the upcoming market potential for Low-Dosage Hydrate Inhibitors (LDHIs), and key regions or countries of focus to forecast this market into various segments and sub-segments. Country specific data and market value analysis for the U.S., Canada, Mexico, Brazil, China, Japan, South Korea, Southeast Asia, India, Germany, the U.K., Italy, Middle East, Africa, and Other Countries.
This report focuses on the Low-Dosage Hydrate Inhibitors (LDHIs) sales, revenue, market share and industry ranking of main manufacturers, data from 2021 to 2026. Identification of the major stakeholders in the global Low-Dosage Hydrate Inhibitors (LDHIs) market, and analysis of their competitive landscape and market positioning based on recent developments and segmental revenues. This report will help stakeholders to understand the competitive landscape and gain more insights and position their businesses and market strategies in a better way.
This report analyzes the segments data by Type and by Application, sales, revenue, and price, from 2021 to 2032. Evaluation and forecast the market size for Low-Dosage Hydrate Inhibitors (LDHIs) sales, projected growth trends, production technology, application and end-user industry.
Low-Dosage Hydrate Inhibitors (LDHIs) Segment by Company
- SLB
- Baker Hughes
- Clariant
- Sterling Multi Chem
- BASF
- Ashland
- Innospec
- Arkema
- Italmatch
- Lamberti
- DOSAS
- Halliburton
- Huntsman
- Stepan
- CES Energy Solutions
- Master Chemicals
- Unitek
Low-Dosage Hydrate Inhibitors (LDHIs) Segment by Type
- Kinetic Hydrate Inhibitors (KHIs)
- Antiagglomerants (AAs)
Low-Dosage Hydrate Inhibitors (LDHIs) Segment by Application
- Offshore Oil and Gas Fields
- Onshore Oil and Gas Fields
Low-Dosage Hydrate Inhibitors (LDHIs) Segment by Region
- North America
- United States
- Canada
- Mexico
- Europe
- Germany
- France
- U.K.
- Italy
- Russia
- Spain
- Netherlands
- Switzerland
- Sweden
- Poland
- Asia-Pacific
- China
- Japan
- South Korea
- India
- Australia
- Taiwan
- Southeast Asia
- South America
- Brazil
- Argentina
- Chile
- Colombia
- Middle East & Africa
- Egypt
- South Africa
- Israel
- Türkiye
- GCC Countries
Study Objectives
- To analyze and research the global status and future forecast, involving, production, value, consumption, growth rate (CAGR), market share, historical and forecast.
- To present the key manufacturers, capacity, production, revenue, market share, and Recent Developments.
- To split the breakdown data by regions, type, manufacturers, and Application.
- To analyze the global and key regions market potential and advantage, opportunity and challenge, restraints, and risks.
- To identify significant trends, drivers, influence factors in global and regions.
- To analyze competitive developments such as expansions, agreements, new product launches, and acquisitions in the market.
Reasons to Buy This Report
- This report will help the readers to understand the competition within the industries and strategies for the competitive environment to enhance the potential profit. The report also focuses on the competitive landscape of the global Low-Dosage Hydrate Inhibitors (LDHIs) market, and introduces in detail the market share, industry ranking, competitor ecosystem, market performance, new product development, operation situation, expansion, and acquisition. etc. of the main players, which helps the readers to identify the main competitors and deeply understand the competition pattern of the market.
- This report will help stakeholders to understand the global industry status and trends of Low-Dosage Hydrate Inhibitors (LDHIs) and provides them with information on key market drivers, restraints, challenges, and opportunities.
- This report will help stakeholders to understand competitors better and gain more insights to strengthen their position in their businesses. The competitive landscape section includes the market share and rank (in volume and value), competitor ecosystem, new product development, expansion, and acquisition.
- This report stays updated with novel technology integration, features, and the latest developments in the market.
- This report helps stakeholders to gain insights into which regions to target globally.
- This report helps stakeholders to gain insights into the end-user perception concerning the adoption of Low-Dosage Hydrate Inhibitors (LDHIs).
- This report helps stakeholders to identify some of the key players in the market and understand their valuable contribution.
Chapter Outline
- Chapter 1: Introduces the report scope of the report, executive summary of different market segments (by type and by application, etc), including the market size of each market segment, future development potential, and so on. It offers a high-level view of the current state of the market and its likely evolution in the short to mid-term, and long term.
- Chapter 2: Introduces the market dynamics, latest developments of the market, the driving factors and restrictive factors of the market, the challenges and risks faced by manufacturers in the industry, and the analysis of relevant policies in the industry.
- Chapter 3: Low-Dosage Hydrate Inhibitors (LDHIs) production/output of global and key producers (regions/countries). It provides a quantitative analysis of the production, and development potential of each producer in the next six years.
- Chapter 4: Sales (consumption), revenue of Low-Dosage Hydrate Inhibitors (LDHIs) in global, regional level and country level. It provides a quantitative analysis of the market size and development potential of each region and its main countries and introduces the market development, future development prospects, market space of each country in the world.
- Chapter 5: Detailed analysis of Low-Dosage Hydrate Inhibitors (LDHIs) manufacturers competitive landscape, price, sales, revenue, market share and industry ranking, latest development plan, merger, and acquisition information, etc.
- Chapter 6: Provides the analysis of various market segments by type, covering the sales, revenue, average price, and development potential of each market segment, to help readers find the blue ocean market in different market segments.
- Chapter 7: Provides the analysis of various market segments by application, covering the sales, revenue, average price, and development potential of each market segment, to help readers find the blue ocean market in different downstream markets.
- Chapter 8: Provides profiles of key manufacturers, introducing the basic situation of the main companies in the market in detail, including product descriptions and specifications, Low-Dosage Hydrate Inhibitors (LDHIs) sales, revenue, price, gross margin, and recent development, etc.
- Chapter 9: North America by type, by application and by country, sales, and revenue for each segment.
- Chapter 10: Europe by type, by application and by country, sales, and revenue for each segment.
- Chapter 11: China by type, by application, sales, and revenue for each segment.
- Chapter 12: Asia (Excluding China) by type, by application and by region, sales, and revenue for each segment.
- Chapter 13: South America, Middle East and Africa by type, by application and by country, sales, and revenue for each segment.
- Chapter 14: Analysis of industrial chain, sales channel, key raw materials, distributors and customers.
- Chapter 15: The main concluding insights of the report.
More report detail
Tables and figures
List of Tables
- Table 1. Global Low-Dosage Hydrate Inhibitors (LDHIs) Market Size Growth Rate by Type (US$ Million), 2021 VS 2025 VS 2032
- Table 2. Kinetic Hydrate Inhibitors (KHIs) Major Manufacturers
- Table 3. Antiagglomerants (AAs) Major Manufacturers
- Table 4. Global Low-Dosage Hydrate Inhibitors (LDHIs) Market Size Growth Rate by Application (US$ Million), 2021 VS 2025 VS 2032
- Table 5. Offshore Oil and Gas Fields Major Manufacturers
- Table 6. Onshore Oil and Gas Fields Major Manufacturers
- Table 7. Low-Dosage Hydrate Inhibitors (LDHIs) Industry Trends
- Table 8. Low-Dosage Hydrate Inhibitors (LDHIs) Industry Drivers
- Table 9. Low-Dosage Hydrate Inhibitors (LDHIs) Industry Opportunities and Challenges
- Table 10. Low-Dosage Hydrate Inhibitors (LDHIs) Industry Restraints
- Table 11. Global Low-Dosage Hydrate Inhibitors (LDHIs) Production Growth Rate (CAGR) by Region: 2021 VS 2025 VS 2032 (t)
- Table 12. Global Low-Dosage Hydrate Inhibitors (LDHIs) Production by Region (2021-2026) & (t)
- Table 13. Global Low-Dosage Hydrate Inhibitors (LDHIs) Production by Region (2027-2032) & (t)
- Table 14. Global Low-Dosage Hydrate Inhibitors (LDHIs) Production Market Share by Region (2021-2026)
- Table 15. Global Low-Dosage Hydrate Inhibitors (LDHIs) Production Market Share by Region (2027-2032)
- Table 16. Global Low-Dosage Hydrate Inhibitors (LDHIs) Revenue Grow Rate (CAGR) by Region: 2021 VS 2025 VS 2032 (US$ Million)
- Table 17. Global Low-Dosage Hydrate Inhibitors (LDHIs) Revenue by Region (2021-2026) & (US$ Million)
- Table 18. Global Low-Dosage Hydrate Inhibitors (LDHIs) Revenue by Region (2027-2032) & (US$ Million)
- Table 19. Global Low-Dosage Hydrate Inhibitors (LDHIs) Revenue Market Share by Region (2021-2026)
- Table 20. Global Low-Dosage Hydrate Inhibitors (LDHIs) Revenue Market Share by Region (2027-2032)
- Table 21. Global Low-Dosage Hydrate Inhibitors (LDHIs) Sales Grow Rate (CAGR) by Region: 2021 VS 2025 VS 2032 (t)
- Table 22. Global Low-Dosage Hydrate Inhibitors (LDHIs) Sales by Region (2021-2026) & (t)
- Table 23. Global Low-Dosage Hydrate Inhibitors (LDHIs) Sales by Region (2027-2032) & (t)
- Table 24. Global Low-Dosage Hydrate Inhibitors (LDHIs) Sales Market Share by Region (2021-2026)
- Table 25. Global Low-Dosage Hydrate Inhibitors (LDHIs) Sales Market Share by Region (2027-2032)
- Table 26. Global Low-Dosage Hydrate Inhibitors (LDHIs) Revenue by Manufacturers (US$ Million) & (2021-2026)
- Table 27. Global Low-Dosage Hydrate Inhibitors (LDHIs) Revenue Market Share by Manufacturers (2021-2026)
- Table 28. Global Low-Dosage Hydrate Inhibitors (LDHIs) Sales by Manufacturers (US$ Million) & (2021-2026)
- Table 29. Global Low-Dosage Hydrate Inhibitors (LDHIs) Sales Market Share by Manufacturers (2021-2026)
- Table 30. Global Low-Dosage Hydrate Inhibitors (LDHIs) Sales Price (USD/t) of Manufacturers (2021-2026)
- Table 31. Global Low-Dosage Hydrate Inhibitors (LDHIs) Key Manufacturers Ranking, 2024 VS 2025 VS 2026
- Table 32. Global Low-Dosage Hydrate Inhibitors (LDHIs) Key Manufacturers Manufacturing Sites & Headquarters
- Table 33. Global Low-Dosage Hydrate Inhibitors (LDHIs) Manufacturers, Product Type & Application
- Table 34. Global Low-Dosage Hydrate Inhibitors (LDHIs) Manufacturers Commercialization Time
- Table 35. Global Manufacturers Market Concentration Ratio (CR5 and HHI)
- Table 36. Global Low-Dosage Hydrate Inhibitors (LDHIs) by Manufacturers Type (Tier 1, Tier 2, and Tier 3) & (based on the Revenue of 2025)
- Table 37. Global Low-Dosage Hydrate Inhibitors (LDHIs) Revenue by Type (2021-2026) & (US$ Million)
- Table 38. Global Low-Dosage Hydrate Inhibitors (LDHIs) Revenue by Type (2027-2032) & (US$ Million)
- Table 39. Global Low-Dosage Hydrate Inhibitors (LDHIs) Revenue Market Share by Type (2021-2026)
- Table 40. Global Low-Dosage Hydrate Inhibitors (LDHIs) Revenue Market Share by Type (2027-2032)
- Table 41. Global Low-Dosage Hydrate Inhibitors (LDHIs) Sales by Type (2021-2026) & (t)
- Table 42. Global Low-Dosage Hydrate Inhibitors (LDHIs) Sales by Type (2027-2032) & (t)
- Table 43. Global Low-Dosage Hydrate Inhibitors (LDHIs) Sales Market Share by Type (2021-2026)
- Table 44. Global Low-Dosage Hydrate Inhibitors (LDHIs) Sales Market Share by Type (2027-2032)
- Table 45. Global Low-Dosage Hydrate Inhibitors (LDHIs) Price by Type (2021-2026) & (USD/t)
- Table 46. Global Low-Dosage Hydrate Inhibitors (LDHIs) Price by Type (2027-2032) & (USD/t)
- Table 47. Global Low-Dosage Hydrate Inhibitors (LDHIs) Revenue by Application (2021-2026) & (US$ Million)
- Table 48. Global Low-Dosage Hydrate Inhibitors (LDHIs) Revenue by Application (2027-2032) & (US$ Million)
- Table 49. Global Low-Dosage Hydrate Inhibitors (LDHIs) Revenue Market Share by Application (2021-2026)
- Table 50. Global Low-Dosage Hydrate Inhibitors (LDHIs) Revenue Market Share by Application (2027-2032)
- Table 51. Global Low-Dosage Hydrate Inhibitors (LDHIs) Sales by Application (2021-2026) & (t)
- Table 52. Global Low-Dosage Hydrate Inhibitors (LDHIs) Sales by Application (2027-2032) & (t)
- Table 53. Global Low-Dosage Hydrate Inhibitors (LDHIs) Sales Market Share by Application (2021-2026)
- Table 54. Global Low-Dosage Hydrate Inhibitors (LDHIs) Sales Market Share by Application (2027-2032)
- Table 55. Global Low-Dosage Hydrate Inhibitors (LDHIs) Price by Application (2021-2026) & (USD/t)
- Table 56. Global Low-Dosage Hydrate Inhibitors (LDHIs) Price by Application (2027-2032) & (USD/t)
- Table 57. SLB Company Information
- Table 58. SLB Business Overview
- Table 59. SLB Low-Dosage Hydrate Inhibitors (LDHIs) Sales (t), Revenue (US$ Million), Price (USD/t) and Gross Margin (2021-2026)
- Table 60. SLB Low-Dosage Hydrate Inhibitors (LDHIs) Product Portfolio
- Table 61. SLB Recent Development
- Table 62. Baker Hughes Company Information
- Table 63. Baker Hughes Business Overview
- Table 64. Baker Hughes Low-Dosage Hydrate Inhibitors (LDHIs) Sales (t), Revenue (US$ Million), Price (USD/t) and Gross Margin (2021-2026)
- Table 65. Baker Hughes Low-Dosage Hydrate Inhibitors (LDHIs) Product Portfolio
- Table 66. Baker Hughes Recent Development
- Table 67. Clariant Company Information
- Table 68. Clariant Business Overview
- Table 69. Clariant Low-Dosage Hydrate Inhibitors (LDHIs) Sales (t), Revenue (US$ Million), Price (USD/t) and Gross Margin (2021-2026)
- Table 70. Clariant Low-Dosage Hydrate Inhibitors (LDHIs) Product Portfolio
- Table 71. Clariant Recent Development
- Table 72. Sterling Multi Chem Company Information
- Table 73. Sterling Multi Chem Business Overview
- Table 74. Sterling Multi Chem Low-Dosage Hydrate Inhibitors (LDHIs) Sales (t), Revenue (US$ Million), Price (USD/t) and Gross Margin (2021-2026)
- Table 75. Sterling Multi Chem Low-Dosage Hydrate Inhibitors (LDHIs) Product Portfolio
- Table 76. Sterling Multi Chem Recent Development
- Table 77. BASF Company Information
- Table 78. BASF Business Overview
- Table 79. BASF Low-Dosage Hydrate Inhibitors (LDHIs) Sales (t), Revenue (US$ Million), Price (USD/t) and Gross Margin (2021-2026)
- Table 80. BASF Low-Dosage Hydrate Inhibitors (LDHIs) Product Portfolio
- Table 81. BASF Recent Development
- Table 82. Ashland Company Information
- Table 83. Ashland Business Overview
- Table 84. Ashland Low-Dosage Hydrate Inhibitors (LDHIs) Sales (t), Revenue (US$ Million), Price (USD/t) and Gross Margin (2021-2026)
- Table 85. Ashland Low-Dosage Hydrate Inhibitors (LDHIs) Product Portfolio
- Table 86. Ashland Recent Development
- Table 87. Innospec Company Information
- Table 88. Innospec Business Overview
- Table 89. Innospec Low-Dosage Hydrate Inhibitors (LDHIs) Sales (t), Revenue (US$ Million), Price (USD/t) and Gross Margin (2021-2026)
- Table 90. Innospec Low-Dosage Hydrate Inhibitors (LDHIs) Product Portfolio
- Table 91. Innospec Recent Development
- Table 92. Arkema Company Information
- Table 93. Arkema Business Overview
- Table 94. Arkema Low-Dosage Hydrate Inhibitors (LDHIs) Sales (t), Revenue (US$ Million), Price (USD/t) and Gross Margin (2021-2026)
- Table 95. Arkema Low-Dosage Hydrate Inhibitors (LDHIs) Product Portfolio
- Table 96. Arkema Recent Development
- Table 97. Italmatch Company Information
- Table 98. Italmatch Business Overview
- Table 99. Italmatch Low-Dosage Hydrate Inhibitors (LDHIs) Sales (t), Revenue (US$ Million), Price (USD/t) and Gross Margin (2021-2026)
- Table 100. Italmatch Low-Dosage Hydrate Inhibitors (LDHIs) Product Portfolio
- Table 101. Italmatch Recent Development
- Table 102. Lamberti Company Information
- Table 103. Lamberti Business Overview
- Table 104. Lamberti Low-Dosage Hydrate Inhibitors (LDHIs) Sales (t), Revenue (US$ Million), Price (USD/t) and Gross Margin (2021-2026)
- Table 105. Lamberti Low-Dosage Hydrate Inhibitors (LDHIs) Product Portfolio
- Table 106. Lamberti Recent Development
- Table 107. DOSAS Company Information
- Table 108. DOSAS Business Overview
- Table 109. DOSAS Low-Dosage Hydrate Inhibitors (LDHIs) Sales (t), Revenue (US$ Million), Price (USD/t) and Gross Margin (2021-2026)
- Table 110. DOSAS Low-Dosage Hydrate Inhibitors (LDHIs) Product Portfolio
- Table 111. DOSAS Recent Development
- Table 112. Halliburton Company Information
- Table 113. Halliburton Business Overview
- Table 114. Halliburton Low-Dosage Hydrate Inhibitors (LDHIs) Sales (t), Revenue (US$ Million), Price (USD/t) and Gross Margin (2021-2026)
- Table 115. Halliburton Low-Dosage Hydrate Inhibitors (LDHIs) Product Portfolio
- Table 116. Halliburton Recent Development
- Table 117. Huntsman Company Information
- Table 118. Huntsman Business Overview
- Table 119. Huntsman Low-Dosage Hydrate Inhibitors (LDHIs) Sales (t), Revenue (US$ Million), Price (USD/t) and Gross Margin (2021-2026)
- Table 120. Huntsman Low-Dosage Hydrate Inhibitors (LDHIs) Product Portfolio
- Table 121. Huntsman Recent Development
- Table 122. Stepan Company Information
- Table 123. Stepan Business Overview
- Table 124. Stepan Low-Dosage Hydrate Inhibitors (LDHIs) Sales (t), Revenue (US$ Million), Price (USD/t) and Gross Margin (2021-2026)
- Table 125. Stepan Low-Dosage Hydrate Inhibitors (LDHIs) Product Portfolio
- Table 126. Stepan Recent Development
- Table 127. CES Energy Solutions Company Information
- Table 128. CES Energy Solutions Business Overview
- Table 129. CES Energy Solutions Low-Dosage Hydrate Inhibitors (LDHIs) Sales (t), Revenue (US$ Million), Price (USD/t) and Gross Margin (2021-2026)
- Table 130. CES Energy Solutions Low-Dosage Hydrate Inhibitors (LDHIs) Product Portfolio
- Table 131. CES Energy Solutions Recent Development
- Table 132. Master Chemicals Company Information
- Table 133. Master Chemicals Business Overview
- Table 134. Master Chemicals Low-Dosage Hydrate Inhibitors (LDHIs) Sales (t), Revenue (US$ Million), Price (USD/t) and Gross Margin (2021-2026)
- Table 135. Master Chemicals Low-Dosage Hydrate Inhibitors (LDHIs) Product Portfolio
- Table 136. Master Chemicals Recent Development
- Table 137. Unitek Company Information
- Table 138. Unitek Business Overview
- Table 139. Unitek Low-Dosage Hydrate Inhibitors (LDHIs) Sales (t), Revenue (US$ Million), Price (USD/t) and Gross Margin (2021-2026)
- Table 140. Unitek Low-Dosage Hydrate Inhibitors (LDHIs) Product Portfolio
- Table 141. Unitek Recent Development
- Table 142. North America Low-Dosage Hydrate Inhibitors (LDHIs) Revenue by Type (2021-2026) & (US$ Million)
- Table 143. North America Low-Dosage Hydrate Inhibitors (LDHIs) Revenue by Type (2027-2032) & (US$ Million)
- Table 144. North America Low-Dosage Hydrate Inhibitors (LDHIs) Sales by Type (2021-2026) & (t)
- Table 145. North America Low-Dosage Hydrate Inhibitors (LDHIs) Sales by Type (2027-2032) & (t)
- Table 146. North America Low-Dosage Hydrate Inhibitors (LDHIs) Sales Price by Type (2021-2026) & (USD/t)
- Table 147. North America Low-Dosage Hydrate Inhibitors (LDHIs) Sales Price by Type (2027-2032) & (USD/t)
- Table 148. North America Low-Dosage Hydrate Inhibitors (LDHIs) Revenue by Application (2021-2026) & (US$ Million)
- Table 149. North America Low-Dosage Hydrate Inhibitors (LDHIs) Revenue by Application (2027-2032) & (US$ Million)
- Table 150. North America Low-Dosage Hydrate Inhibitors (LDHIs) Sales by Application (2021-2026) & (t)
- Table 151. North America Low-Dosage Hydrate Inhibitors (LDHIs) Sales by Application (2027-2032) & (t)
- Table 152. North America Low-Dosage Hydrate Inhibitors (LDHIs) Sales Price by Application (2021-2026) & (USD/t)
- Table 153. North America Low-Dosage Hydrate Inhibitors (LDHIs) Sales Price by Application (2027-2032) & (USD/t)
- Table 154. North America Low-Dosage Hydrate Inhibitors (LDHIs) Revenue Grow Rate by Country (2021 VS 2025 VS 2032) & (US$ Million)
- Table 155. North America Low-Dosage Hydrate Inhibitors (LDHIs) Revenue Grow Rate by Country (2021-2026) & (US$ Million)
- Table 156. North America Low-Dosage Hydrate Inhibitors (LDHIs) Revenue Grow Rate by Country (2027-2032) & (US$ Million)
- Table 157. North America Low-Dosage Hydrate Inhibitors (LDHIs) Sales by Country (2021 VS 2025 VS 2032) & (t)
- Table 158. North America Low-Dosage Hydrate Inhibitors (LDHIs) Sales by Country (2021-2026) & (t)
- Table 159. North America Low-Dosage Hydrate Inhibitors (LDHIs) Sales by Country (2027-2032) & (t)
- Table 160. North America Low-Dosage Hydrate Inhibitors (LDHIs) Sales Price by Country (2021-2026) & (USD/t)
- Table 161. North America Low-Dosage Hydrate Inhibitors (LDHIs) Sales Price by Country (2027-2032) & (USD/t)
- Table 162. United States Low-Dosage Hydrate Inhibitors (LDHIs) Revenue (2021-2032) & (US$ Million)
- Table 163. Canada Low-Dosage Hydrate Inhibitors (LDHIs) Revenue (2021-2032) & (US$ Million)
- Table 164. Mexico Low-Dosage Hydrate Inhibitors (LDHIs) Revenue (2021-2032) & (US$ Million)
- Table 165. Europe Low-Dosage Hydrate Inhibitors (LDHIs) Revenue by Type (2021-2026) & (US$ Million)
- Table 166. Europe Low-Dosage Hydrate Inhibitors (LDHIs) Revenue by Type (2027-2032) & (US$ Million)
- Table 167. Europe Low-Dosage Hydrate Inhibitors (LDHIs) Sales by Type (2021-2026) & (t)
- Table 168. Europe Low-Dosage Hydrate Inhibitors (LDHIs) Sales by Type (2027-2032) & (t)
- Table 169. Europe Low-Dosage Hydrate Inhibitors (LDHIs) Sales Price by Type (2021-2026) & (USD/t)
- Table 170. Europe Low-Dosage Hydrate Inhibitors (LDHIs) Sales Price by Type (2027-2032) & (USD/t)
- Table 171. Europe Low-Dosage Hydrate Inhibitors (LDHIs) Revenue by Application (2021-2026) & (US$ Million)
- Table 172. Europe Low-Dosage Hydrate Inhibitors (LDHIs) Revenue by Application (2027-2032) & (US$ Million)
- Table 173. Europe Low-Dosage Hydrate Inhibitors (LDHIs) Sales by Application (2021-2026) & (t)
- Table 174. Europe Low-Dosage Hydrate Inhibitors (LDHIs) Sales by Application (2027-2032) & (t)
- Table 175. Europe Low-Dosage Hydrate Inhibitors (LDHIs) Sales Price by Application (2021-2026) & (USD/t)
- Table 176. Europe Low-Dosage Hydrate Inhibitors (LDHIs) Sales Price by Application (2027-2032) & (USD/t)
- Table 177. Europe Low-Dosage Hydrate Inhibitors (LDHIs) Revenue Grow Rate by Country (2021 VS 2025 VS 2032) & (US$ Million)
- Table 178. Europe Low-Dosage Hydrate Inhibitors (LDHIs) Revenue Grow Rate by Country (2021-2026) & (US$ Million)
- Table 179. Europe Low-Dosage Hydrate Inhibitors (LDHIs) Revenue Grow Rate by Country (2027-2032) & (US$ Million)
- Table 180. Europe Low-Dosage Hydrate Inhibitors (LDHIs) Sales by Country (2021 VS 2025 VS 2032) & (t)
- Table 181. Europe Low-Dosage Hydrate Inhibitors (LDHIs) Sales by Country (2021-2026) & (t)
- Table 182. Europe Low-Dosage Hydrate Inhibitors (LDHIs) Sales by Country (2027-2032) & (t)
- Table 183. Europe Low-Dosage Hydrate Inhibitors (LDHIs) Sales Price by Country (2021-2026) & (USD/t)
- Table 184. Europe Low-Dosage Hydrate Inhibitors (LDHIs) Sales Price by Country (2027-2032) & (USD/t)
- Table 185. Germany Low-Dosage Hydrate Inhibitors (LDHIs) Revenue (2021-2032) & (US$ Million)
- Table 186. France Low-Dosage Hydrate Inhibitors (LDHIs) Revenue (2021-2032) & (US$ Million)
- Table 187. U.K. Low-Dosage Hydrate Inhibitors (LDHIs) Revenue (2021-2032) & (US$ Million)
- Table 188. Italy Low-Dosage Hydrate Inhibitors (LDHIs) Revenue (2021-2032) & (US$ Million)
- Table 189. Russia Low-Dosage Hydrate Inhibitors (LDHIs) Revenue (2021-2032) & (US$ Million)
- Table 190. Spain Low-Dosage Hydrate Inhibitors (LDHIs) Revenue (2021-2032) & (US$ Million)
- Table 191. Netherlands Low-Dosage Hydrate Inhibitors (LDHIs) Revenue (2021-2032) & (US$ Million)
- Table 192. Switzerland Low-Dosage Hydrate Inhibitors (LDHIs) Revenue (2021-2032) & (US$ Million)
- Table 193. Sweden Low-Dosage Hydrate Inhibitors (LDHIs) Revenue (2021-2032) & (US$ Million)
- Table 194. Poland Low-Dosage Hydrate Inhibitors (LDHIs) Revenue (2021-2032) & (US$ Million)
- Table 195. China Low-Dosage Hydrate Inhibitors (LDHIs) Revenue by Type (2021-2026) & (US$ Million)
- Table 196. China Low-Dosage Hydrate Inhibitors (LDHIs) Revenue by Type (2027-2032) & (US$ Million)
- Table 197. China Low-Dosage Hydrate Inhibitors (LDHIs) Sales by Type (2021-2026) & (t)
- Table 198. China Low-Dosage Hydrate Inhibitors (LDHIs) Sales by Type (2027-2032) & (t)
- Table 199. China Low-Dosage Hydrate Inhibitors (LDHIs) Sales Price by Type (2021-2026) & (USD/t)
- Table 200. China Low-Dosage Hydrate Inhibitors (LDHIs) Sales Price by Type (2027-2032) & (USD/t)
- Table 201. China Low-Dosage Hydrate Inhibitors (LDHIs) Revenue by Application (2021-2026) & (US$ Million)
- Table 202. China Low-Dosage Hydrate Inhibitors (LDHIs) Revenue by Application (2027-2032) & (US$ Million)
- Table 203. China Low-Dosage Hydrate Inhibitors (LDHIs) Sales by Application (2021-2026) & (t)
- Table 204. China Low-Dosage Hydrate Inhibitors (LDHIs) Sales by Application (2027-2032) & (t)
- Table 205. China Low-Dosage Hydrate Inhibitors (LDHIs) Sales Price by Application (2021-2026) & (USD/t)
- Table 206. China Low-Dosage Hydrate Inhibitors (LDHIs) Sales Price by Application (2027-2032) & (USD/t)
- Table 207. Asia Low-Dosage Hydrate Inhibitors (LDHIs) Revenue by Type (2021-2026) & (US$ Million)
- Table 208. Asia Low-Dosage Hydrate Inhibitors (LDHIs) Revenue by Type (2027-2032) & (US$ Million)
- Table 209. Asia Low-Dosage Hydrate Inhibitors (LDHIs) Sales by Type (2021-2026) & (t)
- Table 210. Asia Low-Dosage Hydrate Inhibitors (LDHIs) Sales by Type (2027-2032) & (t)
- Table 211. Asia Low-Dosage Hydrate Inhibitors (LDHIs) Sales Price by Type (2021-2026) & (USD/t)
- Table 212. Asia Low-Dosage Hydrate Inhibitors (LDHIs) Sales Price by Type (2027-2032) & (USD/t)
- Table 213. Asia Low-Dosage Hydrate Inhibitors (LDHIs) Revenue by Application (2021-2026) & (US$ Million)
- Table 214. Asia Low-Dosage Hydrate Inhibitors (LDHIs) Revenue by Application (2027-2032) & (US$ Million)
- Table 215. Asia Low-Dosage Hydrate Inhibitors (LDHIs) Sales by Application (2021-2026) & (t)
- Table 216. Asia Low-Dosage Hydrate Inhibitors (LDHIs) Sales by Application (2027-2032) & (t)
- Table 217. Asia Low-Dosage Hydrate Inhibitors (LDHIs) Sales Price by Application (2021-2026) & (USD/t)
- Table 218. Asia Low-Dosage Hydrate Inhibitors (LDHIs) Sales Price by Application (2027-2032) & (USD/t)
- Table 219. Asia Low-Dosage Hydrate Inhibitors (LDHIs) Revenue Grow Rate by Country (2021 VS 2025 VS 2032) & (US$ Million)
- Table 220. Asia Low-Dosage Hydrate Inhibitors (LDHIs) Revenue Grow Rate by Country (2021-2026) & (US$ Million)
- Table 221. Asia Low-Dosage Hydrate Inhibitors (LDHIs) Revenue Grow Rate by Country (2027-2032) & (US$ Million)
- Table 222. Asia Low-Dosage Hydrate Inhibitors (LDHIs) Sales by Country (2021 VS 2025 VS 2032) & (t)
- Table 223. Asia Low-Dosage Hydrate Inhibitors (LDHIs) Sales by Country (2021-2026) & (t)
- Table 224. Asia Low-Dosage Hydrate Inhibitors (LDHIs) Sales by Country (2027-2032) & (t)
- Table 225. Asia Low-Dosage Hydrate Inhibitors (LDHIs) Sales Price by Country (2021-2026) & (USD/t)
- Table 226. Asia Low-Dosage Hydrate Inhibitors (LDHIs) Sales Price by Country (2027-2032) & (USD/t)
- Table 227. Japan Low-Dosage Hydrate Inhibitors (LDHIs) Revenue (2021-2032) & (US$ Million)
- Table 228. South Korea Low-Dosage Hydrate Inhibitors (LDHIs) Revenue (2021-2032) & (US$ Million)
- Table 229. India Low-Dosage Hydrate Inhibitors (LDHIs) Revenue (2021-2032) & (US$ Million)
- Table 230. Australia Low-Dosage Hydrate Inhibitors (LDHIs) Revenue (2021-2032) & (US$ Million)
- Table 231. Taiwan Low-Dosage Hydrate Inhibitors (LDHIs) Revenue (2021-2032) & (US$ Million)
- Table 232. Southeast Asia Low-Dosage Hydrate Inhibitors (LDHIs) Revenue (2021-2032) & (US$ Million)
- Table 233. SAMEA Low-Dosage Hydrate Inhibitors (LDHIs) Revenue by Type (2021-2026) & (US$ Million)
- Table 234. SAMEA Low-Dosage Hydrate Inhibitors (LDHIs) Revenue by Type (2027-2032) & (US$ Million)
- Table 235. SAMEA Low-Dosage Hydrate Inhibitors (LDHIs) Sales by Type (2021-2026) & (t)
- Table 236. SAMEA Low-Dosage Hydrate Inhibitors (LDHIs) Sales by Type (2027-2032) & (t)
- Table 237. SAMEA Low-Dosage Hydrate Inhibitors (LDHIs) Sales Price by Type (2021-2026) & (USD/t)
- Table 238. SAMEA Low-Dosage Hydrate Inhibitors (LDHIs) Sales Price by Type (2027-2032) & (USD/t)
- Table 239. SAMEA Low-Dosage Hydrate Inhibitors (LDHIs) Revenue by Application (2021-2026) & (US$ Million)
- Table 240. SAMEA Low-Dosage Hydrate Inhibitors (LDHIs) Revenue by Application (2027-2032) & (US$ Million)
- Table 241. SAMEA Low-Dosage Hydrate Inhibitors (LDHIs) Sales by Application (2021-2026) & (t)
- Table 242. SAMEA Low-Dosage Hydrate Inhibitors (LDHIs) Sales by Application (2027-2032) & (t)
- Table 243. SAMEA Low-Dosage Hydrate Inhibitors (LDHIs) Sales Price by Application (2021-2026) & (USD/t)
- Table 244. SAMEA Low-Dosage Hydrate Inhibitors (LDHIs) Sales Price by Application (2027-2032) & (USD/t)
- Table 245. SAMEA Low-Dosage Hydrate Inhibitors (LDHIs) Revenue Grow Rate by Country (2021 VS 2025 VS 2032) & (US$ Million)
- Table 246. SAMEA Low-Dosage Hydrate Inhibitors (LDHIs) Revenue Grow Rate by Country (2021-2026) & (US$ Million)
- Table 247. SAMEA Low-Dosage Hydrate Inhibitors (LDHIs) Revenue Grow Rate by Country (2027-2032) & (US$ Million)
- Table 248. SAMEA Low-Dosage Hydrate Inhibitors (LDHIs) Sales by Country (2021 VS 2025 VS 2032) & (t)
- Table 249. SAMEA Low-Dosage Hydrate Inhibitors (LDHIs) Sales by Country (2021-2026) & (t)
- Table 250. SAMEA Low-Dosage Hydrate Inhibitors (LDHIs) Sales by Country (2027-2032) & (t)
- Table 251. SAMEA Low-Dosage Hydrate Inhibitors (LDHIs) Sales Price by Country (2021-2026) & (USD/t)
- Table 252. SAMEA Low-Dosage Hydrate Inhibitors (LDHIs) Sales Price by Country (2027-2032) & (USD/t)
- Table 253. Brazil Low-Dosage Hydrate Inhibitors (LDHIs) Revenue (2021-2032) & (US$ Million)
- Table 254. Argentina Low-Dosage Hydrate Inhibitors (LDHIs) Revenue (2021-2032) & (US$ Million)
- Table 255. Chile Low-Dosage Hydrate Inhibitors (LDHIs) Revenue (2021-2032) & (US$ Million)
- Table 256. Colombia Low-Dosage Hydrate Inhibitors (LDHIs) Revenue (2021-2032) & (US$ Million)
- Table 257. Peru Low-Dosage Hydrate Inhibitors (LDHIs) Revenue (2021-2032) & (US$ Million)
- Table 258. Saudi Arabia Low-Dosage Hydrate Inhibitors (LDHIs) Revenue (2021-2032) & (US$ Million)
- Table 259. Israel Low-Dosage Hydrate Inhibitors (LDHIs) Revenue (2021-2032) & (US$ Million)
- Table 260. UAE Low-Dosage Hydrate Inhibitors (LDHIs) Revenue (2021-2032) & (US$ Million)
- Table 261. Turkey Low-Dosage Hydrate Inhibitors (LDHIs) Revenue (2021-2032) & (US$ Million)
- Table 262. Iran Low-Dosage Hydrate Inhibitors (LDHIs) Revenue (2021-2032) & (US$ Million)
- Table 263. Egypt Low-Dosage Hydrate Inhibitors (LDHIs) Revenue (2021-2032) & (US$ Million)
- Table 264. Key Raw Materials
- Table 265. Raw Materials Key Suppliers
- Table 266. Low-Dosage Hydrate Inhibitors (LDHIs) Distributors List
- Table 267. Low-Dosage Hydrate Inhibitors (LDHIs) Customers List
- Table 268. Research Programs/Design for This Report
- Table 269. Authors List of This Report
- Table 270. Secondary Sources
- Table 271. Primary Sources
List of Figures
- Figure 1. Low-Dosage Hydrate Inhibitors (LDHIs) Product Image
- Figure 2. Global Low-Dosage Hydrate Inhibitors (LDHIs) Market Size Growth Rate by Type (US$ Million), 2021 VS 2025 VS 2032
- Figure 3. Global Low-Dosage Hydrate Inhibitors (LDHIs) Market Size Share 2021 VS 2025 VS 2032
- Figure 4. Kinetic Hydrate Inhibitors (KHIs) Image
- Figure 5. Antiagglomerants (AAs) Image
- Figure 6. Global Low-Dosage Hydrate Inhibitors (LDHIs) Market Size Growth Rate by Application (US$ Million), 2021 VS 2025 VS 2032
- Figure 7. Global Low-Dosage Hydrate Inhibitors (LDHIs) Market Size Share 2021 VS 2025 VS 2032
- Figure 8. Offshore Oil and Gas Fields Image
- Figure 9. Onshore Oil and Gas Fields Image
- Figure 10. Global Low-Dosage Hydrate Inhibitors (LDHIs) Capacity, Capacity Utilization (2021-2032) & (t)
- Figure 11. Global Low-Dosage Hydrate Inhibitors (LDHIs) Production by Region: 2021 VS 2025 VS 2032 (t)
- Figure 12. Global Low-Dosage Hydrate Inhibitors (LDHIs) Production Market Share by Region: 2025 Versus 2032
- Figure 13. Global Low-Dosage Hydrate Inhibitors (LDHIs) Production Market Share by Region (2021-2032)
- Figure 14. North America Low-Dosage Hydrate Inhibitors (LDHIs) Production Growth Rate (2021-2032) & (t)
- Figure 15. Europe Low-Dosage Hydrate Inhibitors (LDHIs) Production Growth Rate (2021-2032) & (t)
- Figure 16. China Low-Dosage Hydrate Inhibitors (LDHIs) Production Growth Rate (2021-2032) & (t)
- Figure 17. Japan Low-Dosage Hydrate Inhibitors (LDHIs) Production Growth Rate (2021-2032) & (t)
- Figure 18. Global Low-Dosage Hydrate Inhibitors (LDHIs) Revenue (US$ Million), 2021 VS 2025 VS 2032
- Figure 19. Global Low-Dosage Hydrate Inhibitors (LDHIs) Revenue (2021-2032) & (US$ Million)
- Figure 20. Global Low-Dosage Hydrate Inhibitors (LDHIs) Revenue (CAGR) by Region: 2021 VS 2025 VS 2032 (US$ Million)
- Figure 21. Global Low-Dosage Hydrate Inhibitors (LDHIs) Revenue Market Share by Region: 2025 Versus 2032
- Figure 22. Global Low-Dosage Hydrate Inhibitors (LDHIs) Revenue Market Share by Region (2021-2032)
- Figure 23. Global Low-Dosage Hydrate Inhibitors (LDHIs) Sales (2021-2032) & (t)
- Figure 24. Global Low-Dosage Hydrate Inhibitors (LDHIs) Sales by Region: 2021 VS 2025 VS 2032 (t)
- Figure 25. Global Low-Dosage Hydrate Inhibitors (LDHIs) Sales Market Share by Region (2021-2032)
- Figure 26. North America Low-Dosage Hydrate Inhibitors (LDHIs) Sales YoY (2021-2032) & (t)
- Figure 27. Europe Low-Dosage Hydrate Inhibitors (LDHIs) Sales YoY (2021-2032) & (t)
- Figure 28. China Low-Dosage Hydrate Inhibitors (LDHIs) Sales YoY (2021-2032) & (t)
- Figure 29. Asia (Excluding China) Low-Dosage Hydrate Inhibitors (LDHIs) Sales YoY (2021-2032) & (t)
- Figure 30. South America, Middle East and Africa Low-Dosage Hydrate Inhibitors (LDHIs) Sales YoY (2021-2032) & (t)
- Figure 31. Global Low-Dosage Hydrate Inhibitors (LDHIs) Manufacturers Revenue Share Top 10 and Top 5 in 2025
- Figure 32. Global Low-Dosage Hydrate Inhibitors (LDHIs) Manufacturers Sales Share Top 10 and Top 5 in 2025
- Figure 33. Manufacturers Type (Tier 1, Tier 2, and Tier 3): 2021 VS 2025
- Figure 34. Global Low-Dosage Hydrate Inhibitors (LDHIs) Revenue Market Share by Type (2021-2032)
- Figure 35. Global Low-Dosage Hydrate Inhibitors (LDHIs) Sales Market Share by Type (2021-2032)
- Figure 36. Global Low-Dosage Hydrate Inhibitors (LDHIs) Revenue Market Share by Application (2021-2032)
- Figure 37. Global Low-Dosage Hydrate Inhibitors (LDHIs) Sales Market Share by Application (2021-2032)
- Figure 38. North America Low-Dosage Hydrate Inhibitors (LDHIs) Revenue Share by Type (2021-2032)
- Figure 39. North America Low-Dosage Hydrate Inhibitors (LDHIs) Sales Share by Type (2021-2032)
- Figure 40. North America Low-Dosage Hydrate Inhibitors (LDHIs) Revenue Share by Application (2021-2032)
- Figure 41. North America Low-Dosage Hydrate Inhibitors (LDHIs) Sales Share by Application (2021-2032)
- Figure 42. North America Low-Dosage Hydrate Inhibitors (LDHIs) Revenue Share by Country (2021-2032)
- Figure 43. North America Low-Dosage Hydrate Inhibitors (LDHIs) Sales Share by Country (2021-2032)
- Figure 44. Europe Low-Dosage Hydrate Inhibitors (LDHIs) Revenue Share by Type (2021-2032)
- Figure 45. Europe Low-Dosage Hydrate Inhibitors (LDHIs) Sales Share by Type (2021-2032)
- Figure 46. Europe Low-Dosage Hydrate Inhibitors (LDHIs) Revenue Share by Application (2021-2032)
- Figure 47. Europe Low-Dosage Hydrate Inhibitors (LDHIs) Sales Share by Application (2021-2032)
- Figure 48. Europe Low-Dosage Hydrate Inhibitors (LDHIs) Revenue Share by Country (2021-2032)
- Figure 49. Europe Low-Dosage Hydrate Inhibitors (LDHIs) Sales Share by Country (2021-2032)
- Figure 50. China Low-Dosage Hydrate Inhibitors (LDHIs) Revenue Share by Type (2021-2032)
- Figure 51. China Low-Dosage Hydrate Inhibitors (LDHIs) Sales Share by Type (2021-2032)
- Figure 52. China Low-Dosage Hydrate Inhibitors (LDHIs) Revenue Share by Application (2021-2032)
- Figure 53. China Low-Dosage Hydrate Inhibitors (LDHIs) Sales Share by Application (2021-2032)
- Figure 54. Asia Low-Dosage Hydrate Inhibitors (LDHIs) Revenue Share by Type (2021-2032)
- Figure 55. Asia Low-Dosage Hydrate Inhibitors (LDHIs) Sales Share by Type (2021-2032)
- Figure 56. Asia Low-Dosage Hydrate Inhibitors (LDHIs) Revenue Share by Application (2021-2032)
- Figure 57. Asia Low-Dosage Hydrate Inhibitors (LDHIs) Sales Share by Application (2021-2032)
- Figure 58. Asia Low-Dosage Hydrate Inhibitors (LDHIs) Revenue Share by Country (2021-2032)
- Figure 59. Asia Low-Dosage Hydrate Inhibitors (LDHIs) Sales Share by Country (2021-2032)
- Figure 60. SAMEA Low-Dosage Hydrate Inhibitors (LDHIs) Revenue Share by Type (2021-2032)
- Figure 61. SAMEA Low-Dosage Hydrate Inhibitors (LDHIs) Sales Share by Type (2021-2032)
- Figure 62. SAMEA Low-Dosage Hydrate Inhibitors (LDHIs) Revenue Share by Application (2021-2032)
- Figure 63. SAMEA Low-Dosage Hydrate Inhibitors (LDHIs) Sales Share by Application (2021-2032)
- Figure 64. SAMEA Low-Dosage Hydrate Inhibitors (LDHIs) Revenue Share by Country (2021-2032)
- Figure 65. SAMEA Low-Dosage Hydrate Inhibitors (LDHIs) Sales Share by Country (2021-2032)
- Figure 66. Low-Dosage Hydrate Inhibitors (LDHIs) Value Chain
- Figure 67. Manufacturing Cost Structure
- Figure 68. Low-Dosage Hydrate Inhibitors (LDHIs) Production Mode & Process
- Figure 69. Direct Comparison with Distribution Share
- Figure 70. Distributors Profiles
- Figure 71. Years Considered
- Figure 72. Research Process
- Figure 73. Key Executives Interviewed
Scope & coverage.
By Type
- Kinetic Hydrate Inhibitors (KHIs)
- Antiagglomerants (AAs)
By Application
- Offshore Oil and Gas Fields
- Onshore Oil and Gas Fields
Companies covered
- SLB
- Baker Hughes
- Clariant
- Sterling Multi Chem
- BASF
- Ashland
- Innospec
- Arkema
- Italmatch
- Lamberti
- DOSAS
- Halliburton
- Huntsman
- Stepan
- CES Energy Solutions
- Master Chemicals
- Unitek
Inside the report.
1 Market Overview
- 1.1 Product Definition
- 1.2 Low-Dosage Hydrate Inhibitors (LDHIs) Market by Type
- 1.2.1 Global Low-Dosage Hydrate Inhibitors (LDHIs) Market Size by Type, 2021 VS 2025 VS 2032
- 1.2.2 Kinetic Hydrate Inhibitors (KHIs)
- 1.2.3 Antiagglomerants (AAs)
- 1.3 Low-Dosage Hydrate Inhibitors (LDHIs) Market by Application
- 1.3.1 Global Low-Dosage Hydrate Inhibitors (LDHIs) Market Size by Application, 2021 VS 2025 VS 2032
- 1.3.2 Offshore Oil and Gas Fields
- 1.3.3 Onshore Oil and Gas Fields
- 1.4 Assumptions and Limitations
- 1.5 Study Goals and Objectives
2 Low-Dosage Hydrate Inhibitors (LDHIs) Market Dynamics
- 2.1 Low-Dosage Hydrate Inhibitors (LDHIs) Industry Trends
- 2.2 Low-Dosage Hydrate Inhibitors (LDHIs) Industry Drivers
- 2.3 Low-Dosage Hydrate Inhibitors (LDHIs) Industry Opportunities and Challenges
- 2.4 Low-Dosage Hydrate Inhibitors (LDHIs) Industry Restraints
3 Global Low-Dosage Hydrate Inhibitors (LDHIs) Production Overview
- 3.1 Global Low-Dosage Hydrate Inhibitors (LDHIs) Production Capacity (2021-2032)
- 3.2 Global Low-Dosage Hydrate Inhibitors (LDHIs) Production by Region: 2021 VS 2025 VS 2032
- 3.3 Global Low-Dosage Hydrate Inhibitors (LDHIs) Production by Region
- 3.3.1 Global Low-Dosage Hydrate Inhibitors (LDHIs) Production by Region (2021-2026)
- 3.3.2 Global Low-Dosage Hydrate Inhibitors (LDHIs) Production by Region (2027-2032)
- 3.3.3 Global Low-Dosage Hydrate Inhibitors (LDHIs) Production Market Share by Region (2021-2032)
- 3.4 North America
- 3.5 Europe
- 3.6 China
- 3.7 Japan
4 Global Market Growth Prospects
- 4.1 Global Low-Dosage Hydrate Inhibitors (LDHIs) Revenue Estimates and Forecasts (2021-2032)
- 4.2 Global Low-Dosage Hydrate Inhibitors (LDHIs) Revenue by Region
- 4.2.1 Global Low-Dosage Hydrate Inhibitors (LDHIs) Revenue by Region: 2021 VS 2025 VS 2032
- 4.2.2 Global Low-Dosage Hydrate Inhibitors (LDHIs) Revenue by Region (2021-2026)
- 4.2.3 Global Low-Dosage Hydrate Inhibitors (LDHIs) Revenue by Region (2027-2032)
- 4.2.4 Global Low-Dosage Hydrate Inhibitors (LDHIs) Revenue Market Share by Region (2021-2032)
- 4.3 Global Low-Dosage Hydrate Inhibitors (LDHIs) Sales Estimates and Forecasts 2021-2032
- 4.4 Global Low-Dosage Hydrate Inhibitors (LDHIs) Sales by Region
- 4.4.1 Global Low-Dosage Hydrate Inhibitors (LDHIs) Sales by Region: 2021 VS 2025 VS 2032
- 4.4.2 Global Low-Dosage Hydrate Inhibitors (LDHIs) Sales by Region (2021-2026)
- 4.4.3 Global Low-Dosage Hydrate Inhibitors (LDHIs) Sales by Region (2027-2032)
- 4.4.4 Global Low-Dosage Hydrate Inhibitors (LDHIs) Sales Market Share by Region (2021-2032)
- 4.5 North America
- 4.6 Europe
- 4.7 China
- 4.8 Asia (Excluding China)
- 4.9 South America, Middle East and Africa
5 Market Competitive Landscape by Manufacturers
- 5.1 Global Low-Dosage Hydrate Inhibitors (LDHIs) Revenue by Manufacturers
- 5.1.1 Global Low-Dosage Hydrate Inhibitors (LDHIs) Revenue by Manufacturers (2021-2026)
- 5.1.2 Global Low-Dosage Hydrate Inhibitors (LDHIs) Revenue Market Share by Manufacturers (2021-2026)
- 5.1.3 Global Low-Dosage Hydrate Inhibitors (LDHIs) Manufacturers Revenue Share Top 10 and Top 5 in 2025
- 5.2 Global Low-Dosage Hydrate Inhibitors (LDHIs) Sales by Manufacturers
- 5.2.1 Global Low-Dosage Hydrate Inhibitors (LDHIs) Sales by Manufacturers (2021-2026)
- 5.2.2 Global Low-Dosage Hydrate Inhibitors (LDHIs) Sales Market Share by Manufacturers (2021-2026)
- 5.2.3 Global Low-Dosage Hydrate Inhibitors (LDHIs) Manufacturers Sales Share Top 10 and Top 5 in 2025
- 5.3 Global Low-Dosage Hydrate Inhibitors (LDHIs) Sales Price by Manufacturers (2021-2026)
- 5.4 Global Low-Dosage Hydrate Inhibitors (LDHIs) Key Manufacturers Ranking, 2024 VS 2025 VS 2026
- 5.5 Global Low-Dosage Hydrate Inhibitors (LDHIs) Key Manufacturers Manufacturing Sites & Headquarters
- 5.6 Global Low-Dosage Hydrate Inhibitors (LDHIs) Manufacturers, Product Type & Application
- 5.7 Global Low-Dosage Hydrate Inhibitors (LDHIs) Manufacturers Commercialization Time
- 5.8 Market Competitive Analysis
- 5.8.1 Global Low-Dosage Hydrate Inhibitors (LDHIs) Market CR5 and HHI
- 5.8.2 2025 Low-Dosage Hydrate Inhibitors (LDHIs) Tier 1, Tier 2, and Tier 3
6 Low-Dosage Hydrate Inhibitors (LDHIs) Market by Type
- 6.1 Global Low-Dosage Hydrate Inhibitors (LDHIs) Revenue by Type
- 6.1.1 Global Low-Dosage Hydrate Inhibitors (LDHIs) Revenue by Type (2021-2032) & (US$ Million)
- 6.1.2 Global Low-Dosage Hydrate Inhibitors (LDHIs) Revenue Market Share by Type (2021-2032)
- 6.2 Global Low-Dosage Hydrate Inhibitors (LDHIs) Sales by Type
- 6.2.1 Global Low-Dosage Hydrate Inhibitors (LDHIs) Sales by Type (2021-2032) & (t)
- 6.2.2 Global Low-Dosage Hydrate Inhibitors (LDHIs) Sales Market Share by Type (2021-2032)
- 6.3 Global Low-Dosage Hydrate Inhibitors (LDHIs) Price by Type
7 Low-Dosage Hydrate Inhibitors (LDHIs) Market by Application
- 7.1 Global Low-Dosage Hydrate Inhibitors (LDHIs) Revenue by Application
- 7.1.1 Global Low-Dosage Hydrate Inhibitors (LDHIs) Revenue by Application (2021-2032) & (US$ Million)
- 7.1.2 Global Low-Dosage Hydrate Inhibitors (LDHIs) Revenue Market Share by Application (2021-2032)
- 7.2 Global Low-Dosage Hydrate Inhibitors (LDHIs) Sales by Application
- 7.2.1 Global Low-Dosage Hydrate Inhibitors (LDHIs) Sales by Application (2021-2032) & (t)
- 7.2.2 Global Low-Dosage Hydrate Inhibitors (LDHIs) Sales Market Share by Application (2021-2032)
- 7.3 Global Low-Dosage Hydrate Inhibitors (LDHIs) Price by Application
8 Company Profiles
- 8.1 SLB
- 8.1.1 SLB Company Information
- 8.1.2 SLB Business Overview
- 8.1.3 SLB Low-Dosage Hydrate Inhibitors (LDHIs) Sales, Revenue, Price and Gross Margin (2021-2026)
- 8.1.4 SLB Low-Dosage Hydrate Inhibitors (LDHIs) Product Portfolio
- 8.1.5 SLB Recent Developments
- 8.2 Baker Hughes
- 8.2.1 Baker Hughes Company Information
- 8.2.2 Baker Hughes Business Overview
- 8.2.3 Baker Hughes Low-Dosage Hydrate Inhibitors (LDHIs) Sales, Revenue, Price and Gross Margin (2021-2026)
- 8.2.4 Baker Hughes Low-Dosage Hydrate Inhibitors (LDHIs) Product Portfolio
- 8.2.5 Baker Hughes Recent Developments
- 8.3 Clariant
- 8.3.1 Clariant Company Information
- 8.3.2 Clariant Business Overview
- 8.3.3 Clariant Low-Dosage Hydrate Inhibitors (LDHIs) Sales, Revenue, Price and Gross Margin (2021-2026)
- 8.3.4 Clariant Low-Dosage Hydrate Inhibitors (LDHIs) Product Portfolio
- 8.3.5 Clariant Recent Developments
- 8.4 Sterling Multi Chem
- 8.4.1 Sterling Multi Chem Company Information
- 8.4.2 Sterling Multi Chem Business Overview
- 8.4.3 Sterling Multi Chem Low-Dosage Hydrate Inhibitors (LDHIs) Sales, Revenue, Price and Gross Margin (2021-2026)
- 8.4.4 Sterling Multi Chem Low-Dosage Hydrate Inhibitors (LDHIs) Product Portfolio
- 8.4.5 Sterling Multi Chem Recent Developments
- 8.5 BASF
- 8.5.1 BASF Company Information
- 8.5.2 BASF Business Overview
- 8.5.3 BASF Low-Dosage Hydrate Inhibitors (LDHIs) Sales, Revenue, Price and Gross Margin (2021-2026)
- 8.5.4 BASF Low-Dosage Hydrate Inhibitors (LDHIs) Product Portfolio
- 8.5.5 BASF Recent Developments
- 8.6 Ashland
- 8.6.1 Ashland Company Information
- 8.6.2 Ashland Business Overview
- 8.6.3 Ashland Low-Dosage Hydrate Inhibitors (LDHIs) Sales, Revenue, Price and Gross Margin (2021-2026)
- 8.6.4 Ashland Low-Dosage Hydrate Inhibitors (LDHIs) Product Portfolio
- 8.6.5 Ashland Recent Developments
- 8.7 Innospec
- 8.7.1 Innospec Company Information
- 8.7.2 Innospec Business Overview
- 8.7.3 Innospec Low-Dosage Hydrate Inhibitors (LDHIs) Sales, Revenue, Price and Gross Margin (2021-2026)
- 8.7.4 Innospec Low-Dosage Hydrate Inhibitors (LDHIs) Product Portfolio
- 8.7.5 Innospec Recent Developments
- 8.8 Arkema
- 8.8.1 Arkema Company Information
- 8.8.2 Arkema Business Overview
- 8.8.3 Arkema Low-Dosage Hydrate Inhibitors (LDHIs) Sales, Revenue, Price and Gross Margin (2021-2026)
- 8.8.4 Arkema Low-Dosage Hydrate Inhibitors (LDHIs) Product Portfolio
- 8.8.5 Arkema Recent Developments
- 8.9 Italmatch
- 8.9.1 Italmatch Company Information
- 8.9.2 Italmatch Business Overview
- 8.9.3 Italmatch Low-Dosage Hydrate Inhibitors (LDHIs) Sales, Revenue, Price and Gross Margin (2021-2026)
- 8.9.4 Italmatch Low-Dosage Hydrate Inhibitors (LDHIs) Product Portfolio
- 8.9.5 Italmatch Recent Developments
- 8.10 Lamberti
- 8.10.1 Lamberti Company Information
- 8.10.2 Lamberti Business Overview
- 8.10.3 Lamberti Low-Dosage Hydrate Inhibitors (LDHIs) Sales, Revenue, Price and Gross Margin (2021-2026)
- 8.10.4 Lamberti Low-Dosage Hydrate Inhibitors (LDHIs) Product Portfolio
- 8.10.5 Lamberti Recent Developments
- 8.11 DOSAS
- 8.11.1 DOSAS Company Information
- 8.11.2 DOSAS Business Overview
- 8.11.3 DOSAS Low-Dosage Hydrate Inhibitors (LDHIs) Sales, Revenue, Price and Gross Margin (2021-2026)
- 8.11.4 DOSAS Low-Dosage Hydrate Inhibitors (LDHIs) Product Portfolio
- 8.11.5 DOSAS Recent Developments
- 8.12 Halliburton
- 8.12.1 Halliburton Company Information
- 8.12.2 Halliburton Business Overview
- 8.12.3 Halliburton Low-Dosage Hydrate Inhibitors (LDHIs) Sales, Revenue, Price and Gross Margin (2021-2026)
- 8.12.4 Halliburton Low-Dosage Hydrate Inhibitors (LDHIs) Product Portfolio
- 8.12.5 Halliburton Recent Developments
- 8.13 Huntsman
- 8.13.1 Huntsman Company Information
- 8.13.2 Huntsman Business Overview
- 8.13.3 Huntsman Low-Dosage Hydrate Inhibitors (LDHIs) Sales, Revenue, Price and Gross Margin (2021-2026)
- 8.13.4 Huntsman Low-Dosage Hydrate Inhibitors (LDHIs) Product Portfolio
- 8.13.5 Huntsman Recent Developments
- 8.14 Stepan
- 8.14.1 Stepan Company Information
- 8.14.2 Stepan Business Overview
- 8.14.3 Stepan Low-Dosage Hydrate Inhibitors (LDHIs) Sales, Revenue, Price and Gross Margin (2021-2026)
- 8.14.4 Stepan Low-Dosage Hydrate Inhibitors (LDHIs) Product Portfolio
- 8.14.5 Stepan Recent Developments
- 8.15 CES Energy Solutions
- 8.15.1 CES Energy Solutions Company Information
- 8.15.2 CES Energy Solutions Business Overview
- 8.15.3 CES Energy Solutions Low-Dosage Hydrate Inhibitors (LDHIs) Sales, Revenue, Price and Gross Margin (2021-2026)
- 8.15.4 CES Energy Solutions Low-Dosage Hydrate Inhibitors (LDHIs) Product Portfolio
- 8.15.5 CES Energy Solutions Recent Developments
- 8.16 Master Chemicals
- 8.16.1 Master Chemicals Company Information
- 8.16.2 Master Chemicals Business Overview
- 8.16.3 Master Chemicals Low-Dosage Hydrate Inhibitors (LDHIs) Sales, Revenue, Price and Gross Margin (2021-2026)
- 8.16.4 Master Chemicals Low-Dosage Hydrate Inhibitors (LDHIs) Product Portfolio
- 8.16.5 Master Chemicals Recent Developments
- 8.17 Unitek
- 8.17.1 Unitek Company Information
- 8.17.2 Unitek Business Overview
- 8.17.3 Unitek Low-Dosage Hydrate Inhibitors (LDHIs) Sales, Revenue, Price and Gross Margin (2021-2026)
- 8.17.4 Unitek Low-Dosage Hydrate Inhibitors (LDHIs) Product Portfolio
- 8.17.5 Unitek Recent Developments
9 North America
- 9.1 North America Low-Dosage Hydrate Inhibitors (LDHIs) Market Size by Type
- 9.1.1 North America Low-Dosage Hydrate Inhibitors (LDHIs) Revenue by Type (2021-2032)
- 9.1.2 North America Low-Dosage Hydrate Inhibitors (LDHIs) Sales by Type (2021-2032)
- 9.1.3 North America Low-Dosage Hydrate Inhibitors (LDHIs) Price by Type (2021-2032)
- 9.2 North America Low-Dosage Hydrate Inhibitors (LDHIs) Market Size by Application
- 9.2.1 North America Low-Dosage Hydrate Inhibitors (LDHIs) Revenue by Application (2021-2032)
- 9.2.2 North America Low-Dosage Hydrate Inhibitors (LDHIs) Sales by Application (2021-2032)
- 9.2.3 North America Low-Dosage Hydrate Inhibitors (LDHIs) Price by Application (2021-2032)
- 9.3 North America Low-Dosage Hydrate Inhibitors (LDHIs) Market Size by Country
- 9.3.1 North America Low-Dosage Hydrate Inhibitors (LDHIs) Revenue Grow Rate by Country (2021 VS 2025 VS 2032)
- 9.3.2 North America Low-Dosage Hydrate Inhibitors (LDHIs) Sales by Country (2021 VS 2025 VS 2032)
- 9.3.3 North America Low-Dosage Hydrate Inhibitors (LDHIs) Price by Country (2021-2032)
- 9.3.4 United States
- 9.3.5 Canada
- 9.3.6 Mexico
10 Europe
- 10.1 Europe Low-Dosage Hydrate Inhibitors (LDHIs) Market Size by Type
- 10.1.1 Europe Low-Dosage Hydrate Inhibitors (LDHIs) Revenue by Type (2021-2032)
- 10.1.2 Europe Low-Dosage Hydrate Inhibitors (LDHIs) Sales by Type (2021-2032)
- 10.1.3 Europe Low-Dosage Hydrate Inhibitors (LDHIs) Price by Type (2021-2032)
- 10.2 Europe Low-Dosage Hydrate Inhibitors (LDHIs) Market Size by Application
- 10.2.1 Europe Low-Dosage Hydrate Inhibitors (LDHIs) Revenue by Application (2021-2032)
- 10.2.2 Europe Low-Dosage Hydrate Inhibitors (LDHIs) Sales by Application (2021-2032)
- 10.2.3 Europe Low-Dosage Hydrate Inhibitors (LDHIs) Price by Application (2021-2032)
- 10.3 Europe Low-Dosage Hydrate Inhibitors (LDHIs) Market Size by Country
- 10.3.1 Europe Low-Dosage Hydrate Inhibitors (LDHIs) Revenue Grow Rate by Country (2021 VS 2025 VS 2032)
- 10.3.2 Europe Low-Dosage Hydrate Inhibitors (LDHIs) Sales by Country (2021 VS 2025 VS 2032)
- 10.3.3 Europe Low-Dosage Hydrate Inhibitors (LDHIs) Price by Country (2021-2032)
- 10.3.4 Germany
- 10.3.5 France
- 10.3.6 U.K.
- 10.3.7 Italy
- 10.3.8 Russia
- 10.3.9 Spain
- 10.3.10 Netherlands
- 10.3.11 Switzerland
- 10.3.12 Sweden
11 China
- 11.1 China Low-Dosage Hydrate Inhibitors (LDHIs) Market Size by Type
- 11.1.1 China Low-Dosage Hydrate Inhibitors (LDHIs) Revenue by Type (2021-2032)
- 11.1.2 China Low-Dosage Hydrate Inhibitors (LDHIs) Sales by Type (2021-2032)
- 11.1.3 China Low-Dosage Hydrate Inhibitors (LDHIs) Price by Type (2021-2032)
- 11.2 China Low-Dosage Hydrate Inhibitors (LDHIs) Market Size by Application
- 11.2.1 China Low-Dosage Hydrate Inhibitors (LDHIs) Revenue by Application (2021-2032)
- 11.2.2 China Low-Dosage Hydrate Inhibitors (LDHIs) Sales by Application (2021-2032)
- 11.2.3 China Low-Dosage Hydrate Inhibitors (LDHIs) Price by Application (2021-2032)
12 Asia (Excluding China)
- 12.1 Asia Low-Dosage Hydrate Inhibitors (LDHIs) Market Size by Type
- 12.1.1 Asia Low-Dosage Hydrate Inhibitors (LDHIs) Revenue by Type (2021-2032)
- 12.1.2 Asia Low-Dosage Hydrate Inhibitors (LDHIs) Sales by Type (2021-2032)
- 12.1.3 Asia Low-Dosage Hydrate Inhibitors (LDHIs) Price by Type (2021-2032)
- 12.2 Asia Low-Dosage Hydrate Inhibitors (LDHIs) Market Size by Application
- 12.2.1 Asia Low-Dosage Hydrate Inhibitors (LDHIs) Revenue by Application (2021-2032)
- 12.2.2 Asia Low-Dosage Hydrate Inhibitors (LDHIs) Sales by Application (2021-2032)
- 12.2.3 Asia Low-Dosage Hydrate Inhibitors (LDHIs) Price by Application (2021-2032)
- 12.3 Asia Low-Dosage Hydrate Inhibitors (LDHIs) Market Size by Country
- 12.3.1 Asia Low-Dosage Hydrate Inhibitors (LDHIs) Revenue Grow Rate by Country (2021 VS 2025 VS 2032)
- 12.3.2 Asia Low-Dosage Hydrate Inhibitors (LDHIs) Sales by Country (2021 VS 2025 VS 2032)
- 12.3.3 Asia Low-Dosage Hydrate Inhibitors (LDHIs) Price by Country (2021-2032)
- 12.3.4 Japan
- 12.3.5 South Korea
- 12.3.6 India
- 12.3.7 Australia
- 12.3.8 Taiwan
- 12.3.9 Southeast Asia
13 South America, Middle East and Africa
- 13.1 SAMEA Low-Dosage Hydrate Inhibitors (LDHIs) Market Size by Type
- 13.1.1 SAMEA Low-Dosage Hydrate Inhibitors (LDHIs) Revenue by Type (2021-2032)
- 13.1.2 SAMEA Low-Dosage Hydrate Inhibitors (LDHIs) Sales by Type (2021-2032)
- 13.1.3 SAMEA Low-Dosage Hydrate Inhibitors (LDHIs) Price by Type (2021-2032)
- 13.2 SAMEA Low-Dosage Hydrate Inhibitors (LDHIs) Market Size by Application
- 13.2.1 SAMEA Low-Dosage Hydrate Inhibitors (LDHIs) Revenue by Application (2021-2032)
- 13.2.2 SAMEA Low-Dosage Hydrate Inhibitors (LDHIs) Sales by Application (2021-2032)
- 13.2.3 SAMEA Low-Dosage Hydrate Inhibitors (LDHIs) Price by Application (2021-2032)
- 13.3 SAMEA Low-Dosage Hydrate Inhibitors (LDHIs) Market Size by Country
- 13.3.1 SAMEA Low-Dosage Hydrate Inhibitors (LDHIs) Revenue Grow Rate by Country (2021 VS 2025 VS 2032)
- 13.3.2 SAMEA Low-Dosage Hydrate Inhibitors (LDHIs) Sales by Country (2021 VS 2025 VS 2032)
- 13.3.3 SAMEA Low-Dosage Hydrate Inhibitors (LDHIs) Price by Country (2021-2032)
- 13.3.4 Brazil
- 13.3.5 Argentina
- 13.3.6 Chile
- 13.3.7 Colombia
- 13.3.8 Peru
- 13.3.9 Saudi Arabia
- 13.3.10 Israel
- 13.3.11 UAE
- 13.3.12 Turkey
- 13.3.13 Iran
- 13.3.14 Egypt
14 Value Chain and Sales Channels Analysis
- 14.1 Low-Dosage Hydrate Inhibitors (LDHIs) Value Chain Analysis
- 14.1.1 Low-Dosage Hydrate Inhibitors (LDHIs) Key Raw Materials
- 14.1.2 Raw Materials Key Suppliers
- 14.1.3 Manufacturing Cost Structure
- 14.1.4 Low-Dosage Hydrate Inhibitors (LDHIs) Production Mode & Process
- 14.2 Low-Dosage Hydrate Inhibitors (LDHIs) Sales Channels Analysis
- 14.2.1 Direct Comparison with Distribution Share
- 14.2.2 Low-Dosage Hydrate Inhibitors (LDHIs) Distributors
- 14.2.3 Low-Dosage Hydrate Inhibitors (LDHIs) Customers
15 Concluding Insights
16 Appendix
- 16.1 Reasons for Doing This Study
- 16.2 Research Methodology
- 16.3 Research Process
- 16.4 Authors List of This Report
- 16.5 Data Source
- 16.5.1 Secondary Sources
- 16.5.2 Primary Sources
- 16.6 Disclaimer
GET THE RESEARCH
Choose your license.
PDF by email within 3–5 working days after payment confirmation.
Talk to an analyst