APO RESEARCH · REPORT
Intelligent Vending Machines
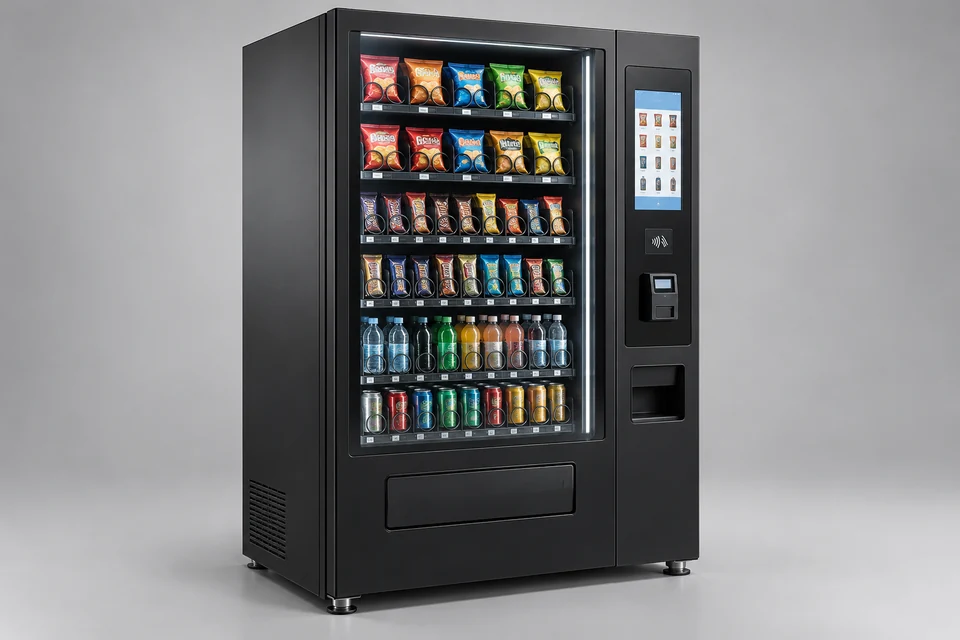
Intelligent vending machines represent the convergence of traditional automated retail systems with advanced technologies such as embedded computing, IoT connectivity, real-time telemetry, and integrated payment systems.
Product & engineering
Understand the product.
Intelligent vending machines represent the convergence of traditional automated retail systems with advanced technologies such as embedded computing, IoT connectivity, real-time telemetry, and integrated payment systems. Defined by their ability to autonomously manage inventory, provide dynamic user interfaces, conduct data analytics, and accept a wide variety of cashless payments, these systems have evolved beyond simple merchandise dispensers to become fully integrated retail endpoints. According to standards referenced by associations such as the European Vending Association (EVA) and the National Automatic Merchandising Association (NAMA), an intelligent vending machine typically features remote management capabilities, cloud-based diagnostics, dynamic planogram updating, and the ability to engage with consumers through touchscreens, facial recognition, or personalized promotions.
Structurally, intelligent vending machines are built on a modular hardware platform that includes a reinforced metal or composite chassis, insulated internal compartments, precision dispensing mechanisms, and multiple layers of electronics and sensors. The housing is typically fabricated from powder-coated galvanized steel or aluminum alloys to ensure durability, thermal insulation, and vandal resistance. Interior compartments may utilize food-grade plastics such as polycarbonate (PC) or polyethylene terephthalate (PET) for transparent storage bins or rotating drums, especially in machines handling fresh food or beverages. Refrigeration units, where applicable, rely on closed-loop compressor systems using low-GWP (global warming potential) refrigerants such as R290 (propane) or R600a (isobutane), in compliance with current environmental regulations.
The core of an intelligent vending machine is its control architecture, which comprises an industrial-grade single-board computer (SBC), microcontrollers, real-time operating systems (RTOS), and edge AI modules. These components coordinate input from infrared sensors, weight scales, internal cameras, and temperature/humidity monitors. Connectivity is enabled through 4G/5G modems, Wi-Fi, Ethernet, and Bluetooth interfaces. Telemetry modules follow standards such as EVA-DTS or NAMA DEX/UCS protocols, enabling secure transmission of operational data, sales transactions, inventory levels, and fault diagnostics to cloud-based vending management systems (VMS). These systems are further integrated with ERP and CRM platforms for end-to-end operational visibility.
Payment systems are typically PCI-DSS compliant and support a full suite of cashless options including EMV chip cards, NFC contactless payment (e.g., Apple Pay, Google Pay), QR code wallets (e.g., Alipay, WeChat Pay), and occasionally biometric verification. Secure elements and encrypted communication protocols (e.g., TLS 1.3) are used to ensure payment security and data integrity. In certain configurations, intelligent vending machines are also capable of dynamic pricing based on demand, time of day, or loyalty programs, implemented through cloud-synced pricing algorithms.
The manufacturing process for intelligent vending machines is a hybrid of traditional mechanical assembly and high-tech electronics integration. Sheet metal fabrication (cutting, bending, welding), powder coating, and mechanical subsystem installation occur in parallel with electronics assembly including PCB placement, harnessing, and touchscreen integration. Final assembly involves system calibration, software flashing, functional validation (FVT), and often remote provisioning of firmware and telemetry profiles. Production typically occurs in ISO 9001-certified facilities with traceable quality control protocols.
The evolution of intelligent vending machines is rooted in the convergence of three key technological trajectories: the automation of physical retail, the digitization of transaction systems, and the emergence of connected devices under the Internet of Things (IoT) paradigm. The earliest forms of vending automation date back to the 1880s with coin-operated machines dispensing postcards and gum, but it was not until the 1970s that electromechanical vending machines became mainstream in industrialized economies. These legacy systems were based on analog timers, rotary selectors, and simple coin validation modules, lacking any capability for remote monitoring or adaptive inventory control.
The first wave of modernization occurred in the late 1990s and early 2000s, driven by the integration of microprocessors, LCD displays, and MDB (Multi-Drop Bus) protocols that enabled basic peripheral communication. However, it was the proliferation of wireless telemetry and embedded computing in the 2010s that marked the true birth of intelligent vending. Manufacturers began equipping machines with GSM/3G modules, barcode scanners, and central processing units (CPUs) capable of running custom firmware and vending management software (VMS). At this stage, telemetry standards such as DEX (Data Exchange) and EVA-DTS (Data Transfer Standard) became industry norms, enabling remote diagnostics, stock alerts, and transactional logging.
Concurrently, advances in mobile payments and cloud infrastructure paved the way for seamless machine-to-server connectivity, empowering operators to implement dynamic pricing, predictive maintenance, and user behavior analytics. The adoption of Android- or Linux-based operating environments further catalyzed the transition, allowing touchscreen interfaces, multimedia advertising, and app-based consumer engagement. These developments laid the foundation for the current generation of intelligent vending machines, which now operate as autonomous retail endpoints within broader smart infrastructure networks.
Today, the trajectory continues toward more adaptive, AI-enabled systems capable of real-time decision-making, voice interaction, facial recognition, and autonomous restocking coordination. Research efforts are now focused on low-power edge inference engines, 6G-enabled telemetry, modular IoT sensor clusters, and the use of digital twins for predictive simulation. These innovations are not only redefining machine capabilities but also transforming vending into a data-rich retail modality with implications across logistics, marketing, and urban planning.
From an industry structure perspective, intelligent vending machine manufacturers are typically segmented into Tier 1 and Tier 2 players (based on technology integration and global influence, not revenue).
Tier 1 manufacturers include Crane Payment Innovations (CPI), Fuji Electric, Sanden Retail Systems Corporation, Sielaff GmbH, and Evoca Group. These companies are characterized by high vertical integration, proprietary control systems, full-stack hardware–software coordination, and the ability to support global deployments at scale. Their vending platforms frequently integrate advanced telemetry, remote diagnostics, embedded AI, and multi-country payment interoperability. Many Tier 1 players operate their own VMS software ecosystems and cloud infrastructure, allowing them to control end-to-end operational performance and long-term machine lifecycle management.
Tier 2 manufacturers, such as TCN Vending Machine, Jofemar Corporation, Rhea Vendors Group S.p.A., Unicum Vending, and Seaga Manufacturing, typically serve regional markets or specific verticals with more modular and cost-effective solutions. While capable of producing high-quality vending hardware, these manufacturers often rely on third-party telemetry platforms, outsourced payment integration modules, or standardized control boards. Tier 2 companies are especially active in OEM/ODM contracts, offering customized product formats for regional operators, and serve as critical enablers of vending expansion in price-sensitive or emerging markets.
This stratification reflects the industry’s underlying supply and capability structure: Tier 1 firms often drive innovation, ecosystem standardization, and complex integration; Tier 2 firms provide speed, flexibility, and local customization. Both tiers play essential roles in the broader supply chain, including interactions with subsystem suppliers, logistics providers, vending management software vendors, and payment network operators.
The downstream value chain includes operators, facility managers, fast-moving consumer goods (FMCG) brands, and channel integrators who deploy, configure, and maintain machines across use cases ranging from public transit hubs and schools to industrial zones, hospitals, airports, and retail complexes. Intelligent vending machines are increasingly integrated into smart city infrastructure and omnichannel retail networks, serving as autonomous last-mile retail points with real-time analytics and automated replenishment scheduling.
With ongoing advancements in AI-based vision systems, machine learning-driven inventory prediction, and cloud-native management interfaces, intelligent vending machines are evolving into fully autonomous service endpoints. Regulatory compliance across multiple domains—including food contact safety (e.g., FDA, CE, NSF), electrical and wireless certification (e.g., UL, FCC, CE, MIC), and data privacy (e.g., GDPR, CCPA)—has become a central consideration in machine design and lifecycle management. These dynamics, coupled with demand for unattended retail formats, are accelerating the global proliferation of intelligent vending solutions across both developed and developing regions.
The global Intelligent Vending Machines (IVM) market is undergoing a transformative shift, driven by rapid advancements in embedded computing, IoT connectivity, and automation within retail environments. According to statistics from APO Research, the global IVM market reached a valuation of USD 3,079.43 million in 2024 and is projected to grow to USD 4,931.86 million by 2031, reflecting a strong compound annual growth rate (CAGR) of 7.86% during the period 2025–2031. This growth is supported by the widespread adoption of unattended retail infrastructure, rising demand for cashless transactions, and the integration of smart vending technologies across high-density public and commercial spaces.
In terms of annual shipments, 749,525 intelligent vending machines were sold worldwide in 2024, with unit sales projected to reach 1,012,593 by 2031, reflecting a volume-based CAGR of 4.86%. According to comprehensive data from the European Vending Association (EVA), National Automatic Merchandising Association (NAMA), and Japan Vending Machine Manufacturers Association (JVMA), the global installed base of vending machines exceeds 281,000 smart units as of 2024. Total vending machine stock—including conventional models—stands at approximately 5 million in the United States, 4.5 million in Europe, 2.6 million in Japan, and 1.15 million in China. Japan continues to lead in per capita density, with one machine per 47 residents, while the United States maintains the highest absolute number of deployed units, many of which are undergoing smart upgrades.
Regionally, the Asia-Pacific market led global shipments in 2024 with 377,558 units, followed by Europe with 141,435 units, and North America with 113,306 units. In terms of revenue, Asia-Pacific again ranked first, generating USD 1,547.42 million, driven by the deployment of high-specification machines with integrated refrigeration, multi-payment systems, and dynamic pricing modules. Major manufacturing and deployment hubs include Italy, Japan, United States, China, Germany, and UK, etc.while rapid growth is also emerging in Southeast Asia and the Middle East, supported by smart infrastructure initiatives.
From a product segmentation perspective, Cold Beverage machines represented the largest category with 287,966 units sold in 2024, followed by Snack & Food machines at 163,097 units, and Hot Drinks & Coffee machines at 122,098 units. Daily Goods vending machines, which dispense hygiene and general-use items, saw global sales of 68,207 units in 2024. Meanwhile, the Health & Pharma category—comprising machines capable of dispensing medications, personal protective equipment (PPE), and clinical test kits—accounted for 21,811 units, representing 34.6% of all vending machines deployed in healthcare environments.
In terms of end-use applications, Workplace deployment dominated, with 272,527 units installed globally in 2024, highlighting increased demand for self-service convenience and micro-kitchen models in corporate and industrial settings. The Education sector followed with 103,734 units, driven by on-campus convenience and nutritional programs. Station environments—subway and train hubs—accounted for 90,393 units, while Hotel deployments totaled 71,130 units. Airports registered 65,209 units, Healthcare Facilities registered 63,110 units and Other environments—including residential, retail, and leisure spaces—contributed 83,422 units to global deployment.
At the corporate level, leading Tier 1 manufacturers include Crane Payment Innovations, Fuji Electric, Sanden Retail Systems, and Sielaff GmbH, all of which develop vertically integrated systems incorporating proprietary control boards, telemetry ecosystems, and internationalized payment modules. Tier 2 players such as Evoca, Azkoyen, and FAS International serve more modular and regional markets, often leveraging OEM/ODM contracts for rapid deployment. Global unit prices vary significantly depending on machine configuration, ranging from USD 3,600–4,200 for standard snack/beverage models to over USD 7,300 for multi-zone, refrigerated, and pharmaceutical-grade machines.
On the supply side, intelligent vending machines rely on a multi-tiered value chain. Key structural materials include galvanized steel, aluminum alloys, polycarbonate (PC), and PET for transparent bins and internal components. Refrigeration systems utilize low-GWP refrigerants such as R290 (propane) or R600a (isobutane), in compliance with EU F-Gas Regulation and US EPA SNAP guidelines. Payment modules are designed to be PCI-DSS compliant, supporting EMV cards, NFC-based services (e.g., Apple Pay, WeChat Pay), and QR code wallets.
Manufacturing is carried out in ISO 9001-certified facilities combining traditional sheet metal fabrication—laser cutting, press bending, welding, powder coating—with modern electronics integration, including PCB assembly, sensor calibration, touchscreen installation, and firmware flashing. The typical cost structure of an intelligent vending machine includes mechanical structure (30–35%), electronics (25–30%), refrigeration/heating units (10–15%), payment systems (10%), and system integration and testing (10–15%).
Environmental and regulatory considerations are increasingly shaping lifecycle economics. In the EU, end-of-life disposal costs for machines containing lithium-ion batteries or refrigerant circuits are estimated at €40–€80 per unit, while in Japan, similar costs range between ¥11,000–12,000 (USD 75–80). These figures underscore the growing importance of design-for-recyclability and total lifecycle impact planning, particularly for machines targeting food, healthcare, or pharma-grade applications.
In conclusion, the intelligent vending machine industry has evolved from isolated dispensing units into fully autonomous, networked retail endpoints. With ongoing advancements in AI-enabled inventory prediction, predictive maintenance, and dynamic pricing, IVMs are poised to play a central role in the digital transformation of retail and public service environments. Supported by resilient manufacturing ecosystems, cross-border deployments, and regulatory-compliant designs, intelligent vending systems will continue to expand globally as essential infrastructure in the next generation of urban and commercial landscapes.
Equipment converts a defined input into a required mechanical or process result. Usable capacity depends on duty, auxiliaries, control, loading and maintenance, rather than an isolated maximum nameplate value.
What turns activity into demand
Production or operating duty leads to purchases when capacity, qualification and replacement requirements match the supplied machine or component. Site output alone does not determine equipment orders without the installed capacity and duty.
The commercial boundary
For Intelligent Vending Machines, distinguish the supplied product from its inputs and the complete application. Report types and applications may overlap; retain the selected edition's product definition, geography, period, unit and transaction basis when comparing estimates.
Which conditions determine usable intelligent vending machines performance?
Intelligent vending machines represent the convergence of traditional automated retail systems with advanced technologies such as embedded computing, IoT connectivity, real-time telemetry, and integrated payment systems. Compare the complete supplied assembly under the same operating conditions, including upstream and downstream interfaces, energy use and service requirements. Separate machine hardware, installed process line and maintenance revenue when defining the research boundary.
Selected research
Market Structure
Global Intelligent Vending Machines Market by Size, by Type, by Application, by Region, History and Forecast 2021-2032
Market perspective
Intelligent vending machines represent the convergence of traditional automated retail systems with advanced technologies such as embedded computing, IoT connectivity, real-time telemetry, and integrated payment systems. Defined by their ability to autonomously manage inventory, provide dynamic user interfaces, conduct data analytics, and accept a wide variety of cashless payments, these systems have evolved beyond simple merchandise dispensers to become fully integrated retail endpoints. According to standards referenced by associations such as the European Vending Association (EVA) and the National Automatic Merchandising Association (NAMA), an intelligent vending machine typically features remote management capabilities, cloud-based diagnostics, dynamic planogram updating, and the ability to engage with consumers through touchscreens, facial recognition, or personalized promotions.
Structurally, intelligent vending machines are built on a modular hardware platform that includes a reinforced metal or composite chassis, insulated internal compartments, precision dispensing mechanisms, and multiple layers of electronics and sensors. The housing is typically fabricated from powder-coated galvanized steel or aluminum alloys to ensure durability, thermal insulation, and vandal resistance. Interior compartments may utilize food-grade plastics such as polycarbonate (PC) or polyethylene terephthalate (PET) for transparent storage bins or rotating drums, especially in machines handling fresh food or beverages. Refrigeration units, where applicable, rely on closed-loop compressor systems using low-GWP (global warming potential) refrigerants such as R290 (propane) or R600a (isobutane), in compliance with current environmental regulations.
The core of an intelligent vending machine is its control architecture, which comprises an industrial-grade single-board computer (SBC), microcontrollers, real-time operating systems (RTOS), and edge AI modules. These components coordinate input from infrared sensors, weight scales, internal cameras, and temperature/humidity monitors. Connectivity is enabled through 4G/5G modems, Wi-Fi, Ethernet, and Bluetooth interfaces. Telemetry modules follow standards such as EVA-DTS or NAMA DEX/UCS protocols, enabling secure transmission of operational data, sales transactions, inventory levels, and fault diagnostics to cloud-based vending management systems (VMS). These systems are further integrated with ERP and CRM platforms for end-to-end operational visibility.
Read the full market overview
Payment systems are typically PCI-DSS compliant and support a full suite of cashless options including EMV chip cards, NFC contactless payment (e.g., Apple Pay, Google Pay), QR code wallets (e.g., Alipay, WeChat Pay), and occasionally biometric verification. Secure elements and encrypted communication protocols (e.g., TLS 1.3) are used to ensure payment security and data integrity. In certain configurations, intelligent vending machines are also capable of dynamic pricing based on demand, time of day, or loyalty programs, implemented through cloud-synced pricing algorithms.
The manufacturing process for intelligent vending machines is a hybrid of traditional mechanical assembly and high-tech electronics integration. Sheet metal fabrication (cutting, bending, welding), powder coating, and mechanical subsystem installation occur in parallel with electronics assembly including PCB placement, harnessing, and touchscreen integration. Final assembly involves system calibration, software flashing, functional validation (FVT), and often remote provisioning of firmware and telemetry profiles. Production typically occurs in ISO 9001-certified facilities with traceable quality control protocols.
The evolution of intelligent vending machines is rooted in the convergence of three key technological trajectories: the automation of physical retail, the digitization of transaction systems, and the emergence of connected devices under the Internet of Things (IoT) paradigm. The earliest forms of vending automation date back to the 1880s with coin-operated machines dispensing postcards and gum, but it was not until the 1970s that electromechanical vending machines became mainstream in industrialized economies. These legacy systems were based on analog timers, rotary selectors, and simple coin validation modules, lacking any capability for remote monitoring or adaptive inventory control.
The first wave of modernization occurred in the late 1990s and early 2000s, driven by the integration of microprocessors, LCD displays, and MDB (Multi-Drop Bus) protocols that enabled basic peripheral communication. However, it was the proliferation of wireless telemetry and embedded computing in the 2010s that marked the true birth of intelligent vending. Manufacturers began equipping machines with GSM/3G modules, barcode scanners, and central processing units (CPUs) capable of running custom firmware and vending management software (VMS). At this stage, telemetry standards such as DEX (Data Exchange) and EVA-DTS (Data Transfer Standard) became industry norms, enabling remote diagnostics, stock alerts, and transactional logging.
Concurrently, advances in mobile payments and cloud infrastructure paved the way for seamless machine-to-server connectivity, empowering operators to implement dynamic pricing, predictive maintenance, and user behavior analytics. The adoption of Android- or Linux-based operating environments further catalyzed the transition, allowing touchscreen interfaces, multimedia advertising, and app-based consumer engagement. These developments laid the foundation for the current generation of intelligent vending machines, which now operate as autonomous retail endpoints within broader smart infrastructure networks.
Today, the trajectory continues toward more adaptive, AI-enabled systems capable of real-time decision-making, voice interaction, facial recognition, and autonomous restocking coordination. Research efforts are now focused on low-power edge inference engines, 6G-enabled telemetry, modular IoT sensor clusters, and the use of digital twins for predictive simulation. These innovations are not only redefining machine capabilities but also transforming vending into a data-rich retail modality with implications across logistics, marketing, and urban planning.
From an industry structure perspective, intelligent vending machine manufacturers are typically segmented into Tier 1 and Tier 2 players (based on technology integration and global influence, not revenue).
Tier 1 manufacturers include Crane Payment Innovations (CPI), Fuji Electric, Sanden Retail Systems Corporation, Sielaff GmbH, and Evoca Group. These companies are characterized by high vertical integration, proprietary control systems, full-stack hardware–software coordination, and the ability to support global deployments at scale. Their vending platforms frequently integrate advanced telemetry, remote diagnostics, embedded AI, and multi-country payment interoperability. Many Tier 1 players operate their own VMS software ecosystems and cloud infrastructure, allowing them to control end-to-end operational performance and long-term machine lifecycle management.
Tier 2 manufacturers, such as TCN Vending Machine, Jofemar Corporation, Rhea Vendors Group S.p.A., Unicum Vending, and Seaga Manufacturing, typically serve regional markets or specific verticals with more modular and cost-effective solutions. While capable of producing high-quality vending hardware, these manufacturers often rely on third-party telemetry platforms, outsourced payment integration modules, or standardized control boards. Tier 2 companies are especially active in OEM/ODM contracts, offering customized product formats for regional operators, and serve as critical enablers of vending expansion in price-sensitive or emerging markets.
This stratification reflects the industry’s underlying supply and capability structure: Tier 1 firms often drive innovation, ecosystem standardization, and complex integration; Tier 2 firms provide speed, flexibility, and local customization. Both tiers play essential roles in the broader supply chain, including interactions with subsystem suppliers, logistics providers, vending management software vendors, and payment network operators.
The downstream value chain includes operators, facility managers, fast-moving consumer goods (FMCG) brands, and channel integrators who deploy, configure, and maintain machines across use cases ranging from public transit hubs and schools to industrial zones, hospitals, airports, and retail complexes. Intelligent vending machines are increasingly integrated into smart city infrastructure and omnichannel retail networks, serving as autonomous last-mile retail points with real-time analytics and automated replenishment scheduling.
With ongoing advancements in AI-based vision systems, machine learning-driven inventory prediction, and cloud-native management interfaces, intelligent vending machines are evolving into fully autonomous service endpoints. Regulatory compliance across multiple domains—including food contact safety (e.g., FDA, CE, NSF), electrical and wireless certification (e.g., UL, FCC, CE, MIC), and data privacy (e.g., GDPR, CCPA)—has become a central consideration in machine design and lifecycle management. These dynamics, coupled with demand for unattended retail formats, are accelerating the global proliferation of intelligent vending solutions across both developed and developing regions.
The global Intelligent Vending Machines (IVM) market is undergoing a transformative shift, driven by rapid advancements in embedded computing, IoT connectivity, and automation within retail environments. According to statistics from APO Research, the global IVM market reached a valuation of USD 3,079.43 million in 2024 and is projected to grow to USD 4,931.86 million by 2031, reflecting a strong compound annual growth rate (CAGR) of 7.86% during the period 2025–2031. This growth is supported by the widespread adoption of unattended retail infrastructure, rising demand for cashless transactions, and the integration of smart vending technologies across high-density public and commercial spaces.
In terms of annual shipments, 749,525 intelligent vending machines were sold worldwide in 2024, with unit sales projected to reach 1,012,593 by 2031, reflecting a volume-based CAGR of 4.86%. According to comprehensive data from the European Vending Association (EVA), National Automatic Merchandising Association (NAMA), and Japan Vending Machine Manufacturers Association (JVMA), the global installed base of vending machines exceeds 281,000 smart units as of 2024. Total vending machine stock—including conventional models—stands at approximately 5 million in the United States, 4.5 million in Europe, 2.6 million in Japan, and 1.15 million in China. Japan continues to lead in per capita density, with one machine per 47 residents, while the United States maintains the highest absolute number of deployed units, many of which are undergoing smart upgrades.
Regionally, the Asia-Pacific market led global shipments in 2024 with 377,558 units, followed by Europe with 141,435 units, and North America with 113,306 units. In terms of revenue, Asia-Pacific again ranked first, generating USD 1,547.42 million, driven by the deployment of high-specification machines with integrated refrigeration, multi-payment systems, and dynamic pricing modules. Major manufacturing and deployment hubs include Italy, Japan, United States, China, Germany, and UK, etc.while rapid growth is also emerging in Southeast Asia and the Middle East, supported by smart infrastructure initiatives.
From a product segmentation perspective, Cold Beverage machines represented the largest category with 287,966 units sold in 2024, followed by Snack & Food machines at 163,097 units, and Hot Drinks & Coffee machines at 122,098 units. Daily Goods vending machines, which dispense hygiene and general-use items, saw global sales of 68,207 units in 2024. Meanwhile, the Health & Pharma category—comprising machines capable of dispensing medications, personal protective equipment (PPE), and clinical test kits—accounted for 21,811 units, representing 34.6% of all vending machines deployed in healthcare environments.
In terms of end-use applications, Workplace deployment dominated, with 272,527 units installed globally in 2024, highlighting increased demand for self-service convenience and micro-kitchen models in corporate and industrial settings. The Education sector followed with 103,734 units, driven by on-campus convenience and nutritional programs. Station environments—subway and train hubs—accounted for 90,393 units, while Hotel deployments totaled 71,130 units. Airports registered 65,209 units, Healthcare Facilities registered 63,110 units and Other environments—including residential, retail, and leisure spaces—contributed 83,422 units to global deployment.
At the corporate level, leading Tier 1 manufacturers include Crane Payment Innovations, Fuji Electric, Sanden Retail Systems, and Sielaff GmbH, all of which develop vertically integrated systems incorporating proprietary control boards, telemetry ecosystems, and internationalized payment modules. Tier 2 players such as Evoca, Azkoyen, and FAS International serve more modular and regional markets, often leveraging OEM/ODM contracts for rapid deployment. Global unit prices vary significantly depending on machine configuration, ranging from USD 3,600–4,200 for standard snack/beverage models to over USD 7,300 for multi-zone, refrigerated, and pharmaceutical-grade machines.
On the supply side, intelligent vending machines rely on a multi-tiered value chain. Key structural materials include galvanized steel, aluminum alloys, polycarbonate (PC), and PET for transparent bins and internal components. Refrigeration systems utilize low-GWP refrigerants such as R290 (propane) or R600a (isobutane), in compliance with EU F-Gas Regulation and US EPA SNAP guidelines. Payment modules are designed to be PCI-DSS compliant, supporting EMV cards, NFC-based services (e.g., Apple Pay, WeChat Pay), and QR code wallets.
Manufacturing is carried out in ISO 9001-certified facilities combining traditional sheet metal fabrication—laser cutting, press bending, welding, powder coating—with modern electronics integration, including PCB assembly, sensor calibration, touchscreen installation, and firmware flashing. The typical cost structure of an intelligent vending machine includes mechanical structure (30–35%), electronics (25–30%), refrigeration/heating units (10–15%), payment systems (10%), and system integration and testing (10–15%).
Environmental and regulatory considerations are increasingly shaping lifecycle economics. In the EU, end-of-life disposal costs for machines containing lithium-ion batteries or refrigerant circuits are estimated at €40–€80 per unit, while in Japan, similar costs range between ¥11,000–12,000 (USD 75–80). These figures underscore the growing importance of design-for-recyclability and total lifecycle impact planning, particularly for machines targeting food, healthcare, or pharma-grade applications.
In conclusion, the intelligent vending machine industry has evolved from isolated dispensing units into fully autonomous, networked retail endpoints. With ongoing advancements in AI-enabled inventory prediction, predictive maintenance, and dynamic pricing, IVMs are poised to play a central role in the digital transformation of retail and public service environments. Supported by resilient manufacturing ecosystems, cross-border deployments, and regulatory-compliant designs, intelligent vending systems will continue to expand globally as essential infrastructure in the next generation of urban and commercial landscapes.
The global Intelligent Vending Machines market is projected to grow from US$ million in 2026 to US$ million by 2032, implying a CAGR of % over 2026-2032.
The US & Canada market for Intelligent Vending Machines is projected to increase from US$ million in 2026 to US$ million by 2032, at a CAGR of % over 2026-2032.
The Europe market for Intelligent Vending Machines is projected to increase from US$ million in 2026 to US$ million by 2032, at a CAGR of % over 2026-2032.
The Asia Pacific market for Intelligent Vending Machines is projected to increase from US$ million in 2026 to US$ million by 2032, at a CAGR of % over 2026-2032.
The China market for Intelligent Vending Machines is projected to increase from US$ million in 2026 to US$ million by 2032, at a CAGR of % over 2026-2032.
Leading global manufacturers of Intelligent Vending Machines include Crane Payment Innovations, Fuji Electric, Sanden Retail Systems, Sielaff GmbH, Evoca, Azkoyen, FAS International, TCN Vending Machine and Jofemar Corporation, among others. In 2025, the top three vendors together accounted for approximately % of global revenue.
On the production side, the report examines Intelligent Vending Machines output, growth rates, and market shares by manufacturer and by region (at regional and country level) for 2021-2026, with forecasts through 2032.
On the consumption side, the report analyzes sales of Intelligent Vending Machines by region (regional and country level), company, type, and application for 2021-2026 and provides forecasts through 2032.
The report provides an overview of the global Intelligent Vending Machines market in terms of capacity, output, revenue, and price, analyzing global market trends using historical revenue and sales data for 2021-2025, estimates for 2026, and projected CAGRs through 2032.
The study covers key producers of Intelligent Vending Machines and consumption patterns in major regions and countries, assesses future market potential, and highlights priority regions and countries for segmenting the market into sub-sectors, with country-specific market value data for the U.S., Canada, Mexico, Brazil, China, Japan, South Korea, Southeast Asia, India, Germany, the U.K., Italy, the Middle East, Africa, and other countries.
The report also presents Intelligent Vending Machines sales, revenue, market share, and industry ranking for the main manufacturers for 2021-2026, identifies the major stakeholders in the global market, and analyzes their competitive landscape and market positioning based on recent developments and segmental revenues.
In addition, the report analyzes segment data by type and application—covering sales, revenue, and price—for 2021-2032, and evaluates and forecasts the Intelligent Vending Machines market size, projected growth trends, production technologies, key applications, and end-use industries.
Intelligent Vending Machines Segment by Company
Crane Payment Innovations
Fuji Electric
Sanden Retail Systems
Sielaff GmbH
Evoca
Azkoyen
FAS International
TCN Vending Machine
Jofemar Corporation
Rhea Vendors Group
Unicum Vending
Seaga Manufacturing
Bianchi Vending
XY Vending
Hunan Kimma
Intelligent Vending Machines Segment by Type
Cold Beverage
Frozen Food
Hot Drinks & Coffee
Snack & Food
Daily Goods
Health & Pharma
Other
Intelligent Vending Machines Segment by Application
Airport
Stations
Education
Workplace
Hotel
Healthcare Facilities
Others
Intelligent Vending Machines Segment by Region
North America
United States
Canada
Mexico
Europe
Germany
France
U.K.
Italy
Russia
Spain
Netherlands
Switzerland
Sweden
Poland
Asia-Pacific
China
Japan
South Korea
India
Australia
Taiwan
Southeast Asia
South America
Brazil
Argentina
Chile
Middle East & Africa
Egypt
South Africa
Israel
Türkiye
GCC Countries
Study Objectives
1. To analyze and research the global status and future forecast, involving, production, value, consumption, growth rate (CAGR), market share, historical and forecast.
2. To present the key manufacturers, capacity, production, revenue, market share, and Recent Developments.
3. To split the breakdown data by regions, type, manufacturers, and Application.
4. To analyze the global and key regions market potential and advantage, opportunity and challenge, restraints, and risks.
5. To identify significant trends, drivers, influence factors in global and regions.
6. To analyze competitive developments such as expansions, agreements, new product launches, and acquisitions in the market.
Reasons to Buy This Report
1. This report will help the readers to understand the competition within the industries and strategies for the competitive environment to enhance the potential profit. The report also focuses on the competitive landscape of the global Intelligent Vending Machines market, and introduces in detail the market share, industry ranking, competitor ecosystem, market performance, new product development, operation situation, expansion, and acquisition. etc. of the main players, which helps the readers to identify the main competitors and deeply understand the competition pattern of the market.
2. This report will help stakeholders to understand the global industry status and trends of Intelligent Vending Machines and provides them with information on key market drivers, restraints, challenges, and opportunities.
3. This report will help stakeholders to understand competitors better and gain more insights to strengthen their position in their businesses. The competitive landscape section includes the market share and rank (in volume and value), competitor ecosystem, new product development, expansion, and acquisition.
4. This report stays updated with novel technology integration, features, and the latest developments in the market.
5. This report helps stakeholders to gain insights into which regions to target globally.
6. This report helps stakeholders to gain insights into the end-user perception concerning the adoption of Intelligent Vending Machines.
7. This report helps stakeholders to identify some of the key players in the market and understand their valuable contribution.
Chapter Outline
Chapter 1: Provides an overview of the Intelligent Vending Machines market, including product definition, global market growth prospects, production value, capacity, and average price forecasts (2021-2032).
Chapter 2: Analysis key trends, drivers, challenges, and opportunities within the global Intelligent Vending Machines industry.
Chapter 3: Detailed analysis of Intelligent Vending Machines market competition landscape. Including Intelligent Vending Machines manufacturers' output value, output and average price from 2021 to 2026, as well as competition analysis indicators such as origin, product type, application, merger and acquisition information, etc.
Chapter 4: Provides the analysis of various market segments by type, covering the market size and development potential of each market segment, to help readers find the blue ocean market in different market segments.
Chapter 5: Provides the analysis of various market segments by application, covering the market size and development potential of each market segment, to help readers find the blue ocean market in different downstream markets.
Chapter 6: Provides profiles of key players, introducing the basic situation of the main companies in the market in detail, including product production/output, value, price, gross margin, product introduction, recent development, etc.
Chapter 7: Production/Production Value of Intelligent Vending Machines by region. It provides a quantitative analysis of the market size and development potential of each region in the next six years.
Chapter 8: Consumption of Intelligent Vending Machines in regional level and country level. It provides a quantitative analysis of the market size and development potential of each region and its main countries and introduces the market development, future development prospects, market space, and production of each country in the world.
Chapter 9: Analysis of industrial chain, including the upstream and downstream of the industry.
Chapter 10: Concluding Insights of the report.
More report detail
Tables and figures
Scope & coverage.
Types
- Cold Beverage
- Frozen Food
- Hot Drinks & Coffee
- Snack & Food
- Daily Goods
- Health & Pharma
- Other
Applications
- Airport
- Stations
- Education
- Workplace
- Hotel
- Healthcare Facilities
- Others
Companies covered
- Crane Payment Innovations
- Fuji Electric
- Sanden Retail Systems
- Sielaff GmbH
- Evoca
- Azkoyen
- FAS International
- TCN Vending Machine
- Jofemar Corporation
- Rhea Vendors Group
- Unicum Vending
- Seaga Manufacturing
- Bianchi Vending
- XY Vending
- Hunan Kimma
Inside the report.
1 Market Overview
- 1.1 Product Definition
- 1.2 Global Market Growth Prospects
- 1.2.1 Global Intelligent Vending Machines Production Value Estimates and Forecasts (2021-2032)
- 1.2.2 Global Intelligent Vending Machines Production Capacity Estimates and Forecasts (2021-2032)
- 1.2.3 Global Intelligent Vending Machines Production Estimates and Forecasts (2021-2032)
- 1.2.4 Global Intelligent Vending Machines Market Average Price (2021-2032)
- 1.3 Assumptions and Limitations
- 1.4 Study Goals and Objectives
2 Global Intelligent Vending Machines Market Dynamics
- 2.1 Intelligent Vending Machines Industry Trends
- 2.2 Intelligent Vending Machines Industry Drivers
- 2.3 Intelligent Vending Machines Industry Opportunities and Challenges
- 2.4 Intelligent Vending Machines Industry Restraints
3 Intelligent Vending Machines Market by Manufacturers
- 3.1 Global Intelligent Vending Machines Production Value by Manufacturers (2021-2026)
- 3.2 Global Intelligent Vending Machines Production by Manufacturers (2021-2026)
- 3.3 Global Intelligent Vending Machines Average Price by Manufacturers (2021-2026)
- 3.4 Global Intelligent Vending Machines Industry Manufacturers Ranking, 2024 VS 2025 VS 2026
- 3.5 Global Intelligent Vending Machines Key Manufacturers Manufacturing Sites & Headquarters
- 3.6 Global Intelligent Vending Machines Manufacturers, Product Type & Application
- 3.7 Global Intelligent Vending Machines Manufacturers Established Date
- 3.8 Market Competitive Analysis
- 3.8.1 Global Intelligent Vending Machines Market CR5 and HHI
- 3.8.2 Global Top 5 and 10 Intelligent Vending Machines Players Market Share by Production Value in 2025
- 3.8.3 2025 Intelligent Vending Machines Tier 1, Tier 2, and Tier 3
4 Intelligent Vending Machines Market by Type
- 4.1 Intelligent Vending Machines Type Introduction
- 4.1.1 Cold Beverage
- 4.1.2 Frozen Food
- 4.1.3 Hot Drinks & Coffee
- 4.1.4 Snack & Food
- 4.1.5 Daily Goods
- 4.1.6 Health & Pharma
- 4.1.7 Other
- 4.2 Global Intelligent Vending Machines Production by Type
- 4.2.1 Global Intelligent Vending Machines Production by Type (2021 VS 2025 VS 2032)
- 4.2.2 Global Intelligent Vending Machines Production by Type (2021-2032)
- 4.2.3 Global Intelligent Vending Machines Production Market Share by Type (2021-2032)
- 4.3 Global Intelligent Vending Machines Production Value by Type
- 4.3.1 Global Intelligent Vending Machines Production Value by Type (2021 VS 2025 VS 2032)
- 4.3.2 Global Intelligent Vending Machines Production Value by Type (2021-2032)
- 4.3.3 Global Intelligent Vending Machines Production Value Market Share by Type (2021-2032)
5 Intelligent Vending Machines Market by Application
- 5.1 Intelligent Vending Machines Application Introduction
- 5.1.1 Airport
- 5.1.2 Stations
- 5.1.3 Education
- 5.1.4 Workplace
- 5.1.5 Hotel
- 5.1.6 Healthcare Facilities
- 5.1.7 Others
- 5.2 Global Intelligent Vending Machines Production by Application
- 5.2.1 Global Intelligent Vending Machines Production by Application (2021 VS 2025 VS 2032)
- 5.2.2 Global Intelligent Vending Machines Production by Application (2021-2032)
- 5.2.3 Global Intelligent Vending Machines Production Market Share by Application (2021-2032)
- 5.3 Global Intelligent Vending Machines Production Value by Application
- 5.3.1 Global Intelligent Vending Machines Production Value by Application (2021 VS 2025 VS 2032)
- 5.3.2 Global Intelligent Vending Machines Production Value by Application (2021-2032)
- 5.3.3 Global Intelligent Vending Machines Production Value Market Share by Application (2021-2032)
6 Company Profiles
- 6.1 Crane Payment Innovations
- 6.1.1 Crane Payment Innovations Company Information
- 6.1.2 Crane Payment Innovations Business Overview
- 6.1.3 Crane Payment Innovations Intelligent Vending Machines Production, Value and Gross Margin (2021-2026)
- 6.1.4 Crane Payment Innovations Intelligent Vending Machines Product Portfolio
- 6.1.5 Crane Payment Innovations Recent Developments
- 6.2 Fuji Electric
- 6.2.1 Fuji Electric Company Information
- 6.2.2 Fuji Electric Business Overview
- 6.2.3 Fuji Electric Intelligent Vending Machines Production, Value and Gross Margin (2021-2026)
- 6.2.4 Fuji Electric Intelligent Vending Machines Product Portfolio
- 6.2.5 Fuji Electric Recent Developments
- 6.3 Sanden Retail Systems
- 6.3.1 Sanden Retail Systems Company Information
- 6.3.2 Sanden Retail Systems Business Overview
- 6.3.3 Sanden Retail Systems Intelligent Vending Machines Production, Value and Gross Margin (2021-2026)
- 6.3.4 Sanden Retail Systems Intelligent Vending Machines Product Portfolio
- 6.3.5 Sanden Retail Systems Recent Developments
- 6.4 Sielaff GmbH
- 6.4.1 Sielaff GmbH Company Information
- 6.4.2 Sielaff GmbH Business Overview
- 6.4.3 Sielaff GmbH Intelligent Vending Machines Production, Value and Gross Margin (2021-2026)
- 6.4.4 Sielaff GmbH Intelligent Vending Machines Product Portfolio
- 6.4.5 Sielaff GmbH Recent Developments
- 6.5 Evoca
- 6.5.1 Evoca Company Information
- 6.5.2 Evoca Business Overview
- 6.5.3 Evoca Intelligent Vending Machines Production, Value and Gross Margin (2021-2026)
- 6.5.4 Evoca Intelligent Vending Machines Product Portfolio
- 6.5.5 Evoca Recent Developments
- 6.6 Azkoyen
- 6.6.1 Azkoyen Company Information
- 6.6.2 Azkoyen Business Overview
- 6.6.3 Azkoyen Intelligent Vending Machines Production, Value and Gross Margin (2021-2026)
- 6.6.4 Azkoyen Intelligent Vending Machines Product Portfolio
- 6.6.5 Azkoyen Recent Developments
- 6.7 FAS International
- 6.7.1 FAS International Company Information
- 6.7.2 FAS International Business Overview
- 6.7.3 FAS International Intelligent Vending Machines Production, Value and Gross Margin (2021-2026)
- 6.7.4 FAS International Intelligent Vending Machines Product Portfolio
- 6.7.5 FAS International Recent Developments
- 6.8 TCN Vending Machine
- 6.8.1 TCN Vending Machine Company Information
- 6.8.2 TCN Vending Machine Business Overview
- 6.8.3 TCN Vending Machine Intelligent Vending Machines Production, Value and Gross Margin (2021-2026)
- 6.8.4 TCN Vending Machine Intelligent Vending Machines Product Portfolio
- 6.8.5 TCN Vending Machine Recent Developments
- 6.9 Jofemar Corporation
- 6.9.1 Jofemar Corporation Company Information
- 6.9.2 Jofemar Corporation Business Overview
- 6.9.3 Jofemar Corporation Intelligent Vending Machines Production, Value and Gross Margin (2021-2026)
- 6.9.4 Jofemar Corporation Intelligent Vending Machines Product Portfolio
- 6.9.5 Jofemar Corporation Recent Developments
- 6.10 Rhea Vendors Group
- 6.10.1 Rhea Vendors Group Company Information
- 6.10.2 Rhea Vendors Group Business Overview
- 6.10.3 Rhea Vendors Group Intelligent Vending Machines Production, Value and Gross Margin (2021-2026)
- 6.10.4 Rhea Vendors Group Intelligent Vending Machines Product Portfolio
- 6.10.5 Rhea Vendors Group Recent Developments
- 6.11 Unicum Vending
- 6.11.1 Unicum Vending Company Information
- 6.11.2 Unicum Vending Business Overview
- 6.11.3 Unicum Vending Intelligent Vending Machines Production, Value and Gross Margin (2021-2026)
- 6.11.4 Unicum Vending Intelligent Vending Machines Product Portfolio
- 6.11.5 Unicum Vending Recent Developments
- 6.12 Seaga Manufacturing
- 6.12.1 Seaga Manufacturing Company Information
- 6.12.2 Seaga Manufacturing Business Overview
- 6.12.3 Seaga Manufacturing Intelligent Vending Machines Production, Value and Gross Margin (2021-2026)
- 6.12.4 Seaga Manufacturing Intelligent Vending Machines Product Portfolio
- 6.12.5 Seaga Manufacturing Recent Developments
- 6.13 Bianchi Vending
- 6.13.1 Bianchi Vending Company Information
- 6.13.2 Bianchi Vending Business Overview
- 6.13.3 Bianchi Vending Intelligent Vending Machines Production, Value and Gross Margin (2021-2026)
- 6.13.4 Bianchi Vending Intelligent Vending Machines Product Portfolio
- 6.13.5 Bianchi Vending Recent Developments
- 6.14 XY Vending
- 6.14.1 XY Vending Company Information
- 6.14.2 XY Vending Business Overview
- 6.14.3 XY Vending Intelligent Vending Machines Production, Value and Gross Margin (2021-2026)
- 6.14.4 XY Vending Intelligent Vending Machines Product Portfolio
- 6.14.5 XY Vending Recent Developments
- 6.15 Hunan Kimma
- 6.15.1 Hunan Kimma Company Information
- 6.15.2 Hunan Kimma Business Overview
- 6.15.3 Hunan Kimma Intelligent Vending Machines Production, Value and Gross Margin (2021-2026)
- 6.15.4 Hunan Kimma Intelligent Vending Machines Product Portfolio
- 6.15.5 Hunan Kimma Recent Developments
7 Global Intelligent Vending Machines Production by Region
- 7.1 Global Intelligent Vending Machines Production by Region: 2021 VS 2025 VS 2032
- 7.2 Global Intelligent Vending Machines Production by Region (2021-2032)
- 7.2.1 Global Intelligent Vending Machines Production by Region (2021-2026)
- 7.2.2 Global Intelligent Vending Machines Production Forecast by Region (2027-2032)
- 7.3 Global Intelligent Vending Machines Production by Region: 2021 VS 2025 VS 2032
- 7.4 Global Intelligent Vending Machines Production Value by Region (2021-2032)
- 7.4.1 Global Intelligent Vending Machines Production Value by Region (2021-2026)
- 7.4.2 Global Intelligent Vending Machines Production Value by Region (2027-2032)
- 7.5 Global Intelligent Vending Machines Market Price Analysis by Region (2021-2032)
- 7.6 Regional Production Value Trends (2021-2032)
- 7.6.1 North America Intelligent Vending Machines Production Value (2021-2032)
- 7.6.2 Europe Intelligent Vending Machines Production Value (2021-2032)
- 7.6.3 Asia-Pacific Intelligent Vending Machines Production Value (2021-2032)
- 7.6.4 South America Intelligent Vending Machines Production Value (2021-2032)
- 7.6.5 Middle East & Africa Intelligent Vending Machines Production Value (2021-2032)
8 Global Intelligent Vending Machines Consumption by Region
- 8.1 Global Intelligent Vending Machines Consumption by Region: 2021 VS 2025 VS 2032
- 8.2 Global Intelligent Vending Machines Consumption by Region (2021-2032)
- 8.2.1 Global Intelligent Vending Machines Consumption by Region (2021-2026)
- 8.2.2 Global Intelligent Vending Machines Consumption by Region (2027-2032)
- 8.3 North America
- 8.3.1 North America Intelligent Vending Machines Consumption Growth Rate by Country: 2021 VS 2025 VS 2032
- 8.3.2 North America Intelligent Vending Machines Consumption by Country (2021-2032)
- 8.3.3 U.S.
- 8.3.4 Canada
- 8.3.5 Mexico
- 8.4 Europe
- 8.4.1 Europe Intelligent Vending Machines Consumption Growth Rate by Country: 2021 VS 2025 VS 2032
- 8.4.2 Europe Intelligent Vending Machines Consumption by Country (2021-2032)
- 8.4.3 Germany
- 8.4.4 France
- 8.4.5 U.K.
- 8.4.6 Italy
- 8.4.7 Netherlands
- 8.5 Asia Pacific
- 8.5.1 Asia Pacific Intelligent Vending Machines Consumption Growth Rate by Country: 2021 VS 2025 VS 2032
- 8.5.2 Asia Pacific Intelligent Vending Machines Consumption by Country (2021-2032)
- 8.5.3 China
- 8.5.4 Japan
- 8.5.5 South Korea
- 8.5.6 Southeast Asia
- 8.5.7 India
- 8.5.8 Australia
- 8.6 South America
- 8.6.1 South America Intelligent Vending Machines Consumption Growth Rate by Country: 2021 VS 2025 VS 2032
- 8.6.2 South America Intelligent Vending Machines Consumption by Country (2021-2032)
- 8.6.3 Brazil
- 8.6.4 Argentina
- 8.6.5 Chile
- 8.6.6 Colombia
- 8.7 Middle East & Africa
- 8.7.1 Middle East & Africa Intelligent Vending Machines Consumption Growth Rate by Country: 2021 VS 2025 VS 2032
- 8.7.2 Middle East & Africa Intelligent Vending Machines Consumption by Country (2021-2032)
- 8.7.3 Egypt
- 8.7.4 South Africa
- 8.7.5 Israel
- 8.7.6 Türkiye
- 8.7.7 GCC Countries
9 Value Chain and Sales Channels Analysis
- 9.1 Intelligent Vending Machines Value Chain Analysis
- 9.1.1 Intelligent Vending Machines Key Raw Materials
- 9.1.2 Raw Materials Key Suppliers
- 9.1.3 Manufacturing Cost Structure
- 9.1.4 Intelligent Vending Machines Production Mode & Process
- 9.2 Intelligent Vending Machines Sales Channels Analysis
- 9.2.1 Direct Comparison with Distribution Share
- 9.2.2 Intelligent Vending Machines Distributors
- 9.2.3 Intelligent Vending Machines Customers
10 Concluding Insights
11 Appendix
- 11.1 Reasons for Doing This Study
- 11.2 Research Methodology
- 11.3 Research Process
- 11.4 Authors List of This Report
- 11.5 Data Source
- 11.5.1 Secondary Sources
- 11.5.2 Primary Sources
- 11.6 Disclaimer
GET THE RESEARCH
Choose your license.
Choose who needs access.
All options are for this report and research series.
PDF by email within 3–5 working days after payment confirmation.
Talk to an analyst