
Global Food Cold Chain Preservation and Transportation Market Outlook and Growth Opportunities 2026
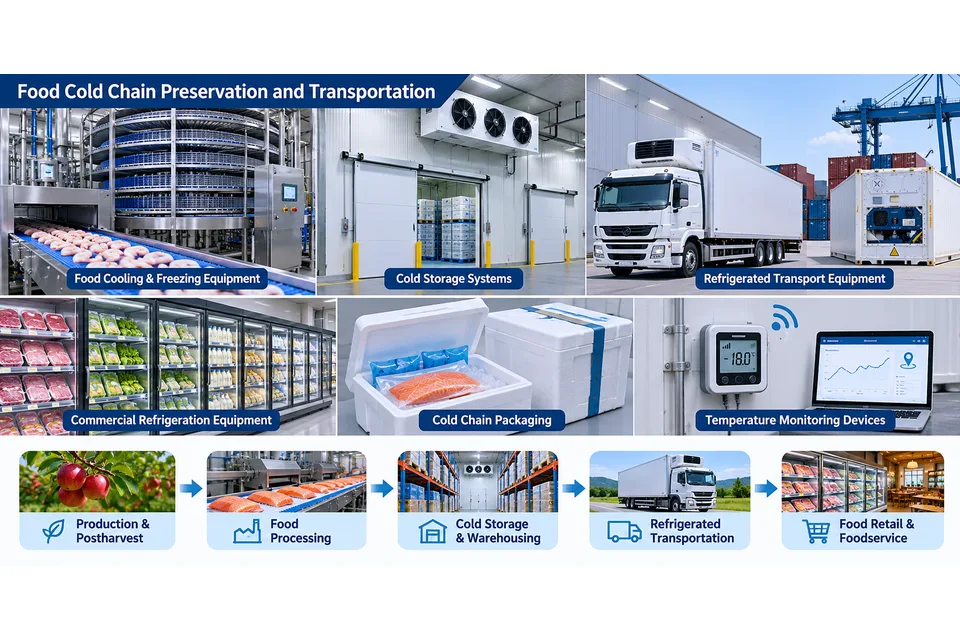
Food Cold Chain Preservation and Transportation encompasses commercially manufactured refrigeration equipment, thermal insulation systems, temperature controlled transport equipment, and associated physical monitoring devices used to cool, freeze, store, transport, and display perishable food under defined thermal conditions. These products regulate heat transfer between food, its immediate environment, and external surroundings to limit microbial proliferation, enzymatic degradation, metabolic activity, moisture loss, and other temperature dependent deterioration processes. Refrigeration technologies principally employ vapor compression cycles involving compressors, condensers, expansion devices, and evaporators, using refrigerants such as ammonia, carbon dioxide, and suitable synthetic compounds. Industrial installations may incorporate secondary coolant circuits, cascade refrigeration, and direct or indirect cryogenic cooling using liquid nitrogen or carbon dioxide. Rapid freezing equipment accelerates heat extraction through forced air circulation, fluidized beds, contact plates, or cryogenic media, controlling the rate of ice formation within food tissues. Insulated enclosures reduce conductive, convective, and radiative heat ingress, while thermal storage materials absorb or release latent heat to moderate temperature fluctuations during transportation and temporary storage.
Commercial products comprise postharvest precooling systems, industrial chillers and freezers, refrigerated storage systems, insulated cold rooms, transport refrigeration units, refrigerated containers, refrigerated truck and trailer bodies, commercial refrigeration cabinets, insulated food transport packaging, and dedicated cold chain temperature monitoring hardware. Major structural materials include stainless steel, aluminum, coated steel, polyurethane and polyisocyanurate insulation, expanded polystyrene, engineered polymers, and multilayer insulation assemblies. Refrigeration equipment integrates heat exchangers, refrigerant piping, air circulation components, electrical drives, and temperature controllers, with capacity and operating temperature determined by the thermal characteristics of the food and its handling requirements. Specialized installations incorporate humidity regulation, ventilation, and controlled atmosphere technologies to manage respiration and physiological deterioration in fresh produce. Physical temperature sensors, data loggers, and shipment tracking instruments provide records of thermal exposure during storage and distribution. Applications extend across agricultural harvesting and postharvest handling, meat and seafood processing, dairy production, frozen food manufacturing, refrigerated warehousing, domestic and international refrigerated transportation, wholesale distribution, food retail, and foodservice. The manufactured product scope covers dedicated refrigeration and preservation equipment, insulated transport products, and physical monitoring instruments. Independent logistics operations, cold storage services, generic vehicle chassis, conventional food packaging, separately sold cooling consumables, and standalone software fall outside this equipment market.
Product & engineering
Understand the product.
Food Cold Chain Preservation and Transportation encompasses commercially manufactured refrigeration equipment, thermal insulation systems, temperature controlled transport equipment, and associated physical monitoring devices used to cool, freeze, store, transport, and display perishable food under defined thermal conditions. These products regulate heat transfer between food, its immediate environment, and external surroundings to limit microbial proliferation, enzymatic degradation, metabolic activity, moisture loss, and other temperature dependent deterioration processes. Refrigeration technologies principally employ vapor compression cycles involving compressors, condensers, expansion devices, and evaporators, using refrigerants such as ammonia, carbon dioxide, and suitable synthetic compounds. Industrial installations may incorporate secondary coolant circuits, cascade refrigeration, and direct or indirect cryogenic cooling using liquid nitrogen or carbon dioxide. Rapid freezing equipment accelerates heat extraction through forced air circulation, fluidized beds, contact plates, or cryogenic media, controlling the rate of ice formation within food tissues. Insulated enclosures reduce conductive, convective, and radiative heat ingress, while thermal storage materials absorb or release latent heat to moderate temperature fluctuations during transportation and temporary storage.
Commercial products comprise postharvest precooling systems, industrial chillers and freezers, refrigerated storage systems, insulated cold rooms, transport refrigeration units, refrigerated containers, refrigerated truck and trailer bodies, commercial refrigeration cabinets, insulated food transport packaging, and dedicated cold chain temperature monitoring hardware. Major structural materials include stainless steel, aluminum, coated steel, polyurethane and polyisocyanurate insulation, expanded polystyrene, engineered polymers, and multilayer insulation assemblies. Refrigeration equipment integrates heat exchangers, refrigerant piping, air circulation components, electrical drives, and temperature controllers, with capacity and operating temperature determined by the thermal characteristics of the food and its handling requirements. Specialized installations incorporate humidity regulation, ventilation, and controlled atmosphere technologies to manage respiration and physiological deterioration in fresh produce. Physical temperature sensors, data loggers, and shipment tracking instruments provide records of thermal exposure during storage and distribution. Applications extend across agricultural harvesting and postharvest handling, meat and seafood processing, dairy production, frozen food manufacturing, refrigerated warehousing, domestic and international refrigerated transportation, wholesale distribution, food retail, and foodservice. The manufactured product scope covers dedicated refrigeration and preservation equipment, insulated transport products, and physical monitoring instruments. Independent logistics operations, cold storage services, generic vehicle chassis, conventional food packaging, separately sold cooling consumables, and standalone software fall outside this equipment market.
Selected research
Market Outlook & Growth Opportunities
Global Food Cold Chain Preservation and Transportation Market Outlook and Growth Opportunities 2026
MARKET AT A GLANCE
Scale & outlook
- 2026
- 70,190USD million
- 2032
- 100,700USD million
Select a bar to inspect its value.
Source: APO Research, Inc.
Market perspective
According to APO Research, Inc, the global Food Cold Chain Preservation and Transportation market was valued at USD 66.95 billion in 2025 and is expected to reach USD 70.19 billion in 2026 and USD 100.7 billion by 2032, representing a compound annual growth rate of 6.20% from 2026 to 2032. Market revenue is driven by investment in food processing refrigeration, refrigerated warehouse installations, transport refrigeration equipment, commercial refrigerated cabinets, and associated temperature control products. Industrial cooling and freezing equipment demand follows investment in meat, seafood, dairy, and frozen food processing capacity, while refrigerated storage and transport equipment sales depend on new infrastructure, fleet renewal, and utilization of existing assets. Revenue growth reflects higher equipment shipments in developing cold chain networks, replacement of aging refrigeration systems in established markets, and changes in equipment value associated with energy efficiency, refrigerant technology, and electrical integration.
China remains a major manufacturing and demand center for refrigerated containers, transport equipment, and commercial refrigeration products. The China Federation of Logistics and Purchasing reported that refrigerated warehouse capacity reached 267 million cubic meters in 2025, an increase of 5.53%, while refrigerated vehicle sales increased 30.2% to 81,969 units. CIMC sold 208,200 TEU of refrigerated containers in 2025, up 50.2% from 138,600 TEU in 2024, reflecting stronger demand for marine refrigerated transport assets. Qingdao Hiron Commercial Cold Chain sold approximately 1.23 million units in 2025, an increase of 12.57%, and opened its first Indonesian manufacturing facility in November 2025. Its disclosures indicated stronger business activity in Southeast Asia alongside weaker North American demand affected by tariff changes. These developments reflect differences in regional equipment procurement, manufacturing location, and customer capital expenditure. In India, government support for integrated cold chain infrastructure is extending investment in precooling, food freezing, refrigerated storage, and transport equipment, particularly for agricultural products, dairy, meat, and seafood.
North American and European demand is increasingly influenced by replacement investment, refrigerated warehouse expansion, and refrigeration system modernization. The U.S. Department of Agriculture reported 3.99 billion cubic feet of gross refrigerated warehouse capacity in October 2025. The Global Cold Chain Alliance reported that its 25 largest member operators had 7.76 billion cubic feet of temperature controlled warehousing capacity in 2026, an increase of 6.3% from 2025. Additional capacity requires refrigeration machinery, insulated building envelopes, air circulation equipment, and associated control systems, while existing facilities generate demand for equipment replacement and energy efficiency upgrades. European Regulation (EU) 2024/573 is accelerating the adoption of refrigeration systems using carbon dioxide, ammonia, and hydrocarbons in applicable commercial and industrial installations. Carrier reported USD 2.894 billion in 2025 Climate Solutions Transportation segment revenue, with organic sales increasing 4% despite a decline in reported revenue associated primarily with divestitures. Its commercially introduced 38.5 kWh battery refrigeration system in 2026 also illustrates the growing role of electrification and retrofit investment in refrigerated transport. Through 2032, equipment sales are expected to benefit from additional cold storage capacity in Asia and other developing markets, continued refrigerated transport investment, and replacement of conventional refrigeration systems in established markets. Compressor efficiency, insulation performance, refrigerant selection, electrical components, and system integration requirements will influence manufacturing costs and equipment selling prices, while financing conditions, electricity prices, and utilization of existing facilities will continue to affect customer purchasing schedules.
Full market overview
This report provides an overview of the global Food Cold Chain Preservation and Transportation market in terms of revenue and gross margin, analyzing global market trends using historical revenue data for 2021-2025, estimates for 2026, and projected CAGRs through 2032.
The study covers key producers of Food Cold Chain Preservation and Transportation and market revenue by major regions and countries, assesses future market potential, and highlights priority regions and countries for segmenting the market into sub-sectors, with country-specific market value data for the U.S., Canada, Mexico, Brazil, China, Japan, South Korea, Southeast Asia, India, Germany, the U.K., Italy, the Middle East, Africa, and other countries.
The report also presents Food Cold Chain Preservation and Transportation revenue, market share, and industry ranking for the main companies for 2021-2026, identifies the major stakeholders in the global market, and analyzes their competitive landscape and market positioning based on recent developments and segmental revenues.
Across the 2021-2026 period, the analysis compares revenue growth and profitability profiles by company, distinguishing participants with sustained expansion from those with more cyclical performance, and relates these patterns to differences in regional exposure, product portfolios, and application focus in the global Food Cold Chain Preservation and Transportation market.
Food Cold Chain Preservation and Transportation Segment by Company
- Trane Technologies
- Carrier Global
- Daikin Industries
- CIMC
- COSCO SHIPPING Development
- DENSO
- Panasonic
- Johnson Controls
- Dover
- GEA Group
- Danfoss
- Mitsubishi Heavy Industries
- Liebherr
- Lennox
- JBT Marel
- Hoshizaki
- Mayekawa
- Epta
- Arneg
- Copeland
- BITZER
- Güntner Group
- Schmitz Cargobull
- Maersk Container Industry
- Electrolux Professional
- Midera Food Processing
- EVAPCO
- LUVE Group
- Rivacold
- Aucma
- Bingshan
- Moon Environment Technology
- Square Technology Group
- Hiron Commercial Cold Chain
- Snowman Group
- Kingspan
- Ali Group
- True Manufacturing
- BEWI
- Heat and Control
- FPS Food Process Solutions
- DSI Dantech
- Air Products
- Linde
- Krone
- Great Dane
- Utility Trailer
- Hyundai Translead
- Wabash
- The Reefer Group
- Lamberet
- Kögel
- Kingtec Group
- Hwasung Thermo
- Jingxue Energy Saving Technology
- OctoCore
- Knauf Industries
- Ranpak
- Cryopak
- CSafe
Food Cold Chain Preservation and Transportation Segment by Type
- Food Cooling & Freezing Equipment
- Cold Storage Systems
- Refrigerated Transport Equipment
- Commercial Refrigeration Equipment
- Cold Chain Packaging
- Temperature Monitoring Devices
Food Cold Chain Preservation and Transportation Segment by Application
- Primary Production & Postharvest Handling
- Food Processing
- Cold Storage & Warehousing
- Refrigerated Transportation
- Food Retail & Foodservice
Food Cold Chain Preservation and Transportation Segment by Region
- North America
- United States
- Canada
- Mexico
- Europe
- Germany
- France
- U.K.
- Italy
- Russia
- Spain
- Netherlands
- Switzerland
- Sweden
- Poland
- Asia-Pacific
- China
- Japan
- South Korea
- India
- Australia
- Taiwan
- Southeast Asia
- South America
- Brazil
- Argentina
- Chile
- Colombia
- Middle East & Africa
- Egypt
- South Africa
- Israel
- Türkiye
- GCC Countries
Study Objectives
- To analyze and research the global Food Cold Chain Preservation and Transportation status and future forecast, involving, revenue, growth rate (CAGR), market share, historical and forecast.
- To present the Food Cold Chain Preservation and Transportation key companies, revenue, market share, and recent developments.
- To split the Food Cold Chain Preservation and Transportation breakdown data by regions, type, companies, and application.
- To analyze the global and key regions Food Cold Chain Preservation and Transportation market potential and advantage, opportunity and challenge, restraints, and risks.
- To identify Food Cold Chain Preservation and Transportation significant trends, drivers, influence factors in global and regions.
- To analyze Food Cold Chain Preservation and Transportation competitive developments such as expansions, agreements, new product launches, and acquisitions in the market.
Reasons to Buy This Report
- This report will help the readers to understand the competition within the industries and strategies for the competitive environment to enhance the potential profit. The report also focuses on the competitive landscape of the global Food Cold Chain Preservation and Transportation market, and introduces in detail the market share, industry ranking, competitor ecosystem, market performance, new product development, operation situation, expansion, and acquisition. etc. of the main players, which helps the readers to identify the main competitors and deeply understand the competition pattern of the market.
- This report will help stakeholders to understand the global industry status and trends of Food Cold Chain Preservation and Transportation and provides them with information on key market drivers, restraints, challenges, and opportunities.
- This report will help stakeholders to understand competitors better and gain more insights to strengthen their position in their businesses. The competitive landscape section includes the market share and rank (in sales and value), competitor ecosystem, new product development, expansion, and acquisition.
- This report stays updated with novel technology integration, features, and the latest developments in the market.
- This report helps stakeholders to gain insights into which regions to target globally.
- This report helps stakeholders to gain insights into the end-user perception concerning the adoption of Food Cold Chain Preservation and Transportation.
- This report helps stakeholders to identify some of the key players in the market and understand their valuable contribution.
Chapter Outline
- Chapter 1: Introduces the report scope of the report, global total market size.
- Chapter 2: Analysis key trends, drivers, challenges, and opportunities within the global Food Cold Chain Preservation and Transportation industry.
- Chapter 3: Detailed analysis of Food Cold Chain Preservation and Transportation company competitive landscape, revenue market share, latest development plan, merger, and acquisition information, etc.
- Chapter 4: Provides the analysis of various market segments by Type, covering the market size and development potential of each market segment, to help readers find the blue ocean market in different market segments.
- Chapter 5: Provides the analysis of various market segments by Application, covering the market size and development potential of each market segment, to help readers find the blue ocean market in different downstream markets.
- Chapter 6: Sales value of Food Cold Chain Preservation and Transportation in regional level. It provides a quantitative analysis of the market size and development potential of each region and introduces the market development, future development prospects, market space, and market size of key country in the world.
- Chapter 7: Sales value of Food Cold Chain Preservation and Transportation in country level. It provides sigmate data by Type, and by Application for each country/region.
- Chapter 8: Provides profiles of key players, introducing the basic situation of the main companies in the market in detail, including revenue, gross margin, product introduction, recent development, etc.
- Chapter 9: Concluding Insights.
More report detail
Tables and figures
List of Tables
- Table 1. Food Cold Chain Preservation and Transportation Industry Trends
- Table 2. Food Cold Chain Preservation and Transportation Industry Drivers
- Table 3. Food Cold Chain Preservation and Transportation Industry Opportunities and Challenges
- Table 4. Food Cold Chain Preservation and Transportation Industry Restraints
- Table 5. Global Food Cold Chain Preservation and Transportation Revenue by Company (US$ Million) & (2021-2026)
- Table 6. Global Food Cold Chain Preservation and Transportation Revenue Share by Company (2021-2026)
- Table 7. Global Food Cold Chain Preservation and Transportation Company Ranking, (2024-2026) & (US$ Million)
- Table 8. Global Food Cold Chain Preservation and Transportation Key Company Manufacturing Base & Headquarters
- Table 9. Global Food Cold Chain Preservation and Transportation Company, Product Type & Application
- Table 10. Global Food Cold Chain Preservation and Transportation Company Establishment Date
- Table 11. Global Company Market Concentration Ratio (CR5 and HHI)
- Table 12. Global Food Cold Chain Preservation and Transportation by Company Type (Tier 1, Tier 2, and Tier 3) & (Based on Revenue of 2025)
- Table 13. Mergers & Acquisitions, Expansion
- Table 14. Significant Companies of Food Cooling & Freezing Equipment
- Table 15. Significant Companies of Cold Storage Systems
- Table 16. Significant Companies of Refrigerated Transport Equipment
- Table 17. Significant Companies of Commercial Refrigeration Equipment
- Table 18. Significant Companies of Cold Chain Packaging
- Table 19. Significant Companies of Temperature Monitoring Devices
- Table 20. Global Food Cold Chain Preservation and Transportation Sales Value by Type 2021 VS 2025 VS 2032 (US$ Million)
- Table 21. Global Food Cold Chain Preservation and Transportation Sales Value by Type (2021-2026) & (US$ Million)
- Table 22. Global Food Cold Chain Preservation and Transportation Sales Value by Type (2027-2032) & (US$ Million)
- Table 23. Global Food Cold Chain Preservation and Transportation Sales Value Share by Type (2021-2026)
- Table 24. Global Food Cold Chain Preservation and Transportation Sales Value Share by Type (2027-2032)
- Table 25. Significant Companies of Primary Production & Postharvest Handling
- Table 26. Significant Companies of Food Processing
- Table 27. Significant Companies of Cold Storage & Warehousing
- Table 28. Significant Companies of Refrigerated Transportation
- Table 29. Significant Companies of Food Retail & Foodservice
- Table 30. Global Food Cold Chain Preservation and Transportation Sales Value by Application 2021 VS 2025 VS 2032 (US$ Million)
- Table 31. Global Food Cold Chain Preservation and Transportation Sales Value by Application (2021-2026) & (US$ Million)
- Table 32. Global Food Cold Chain Preservation and Transportation Sales Value by Application (2027-2032) & (US$ Million)
- Table 33. Global Food Cold Chain Preservation and Transportation Sales Value Share by Application (2021-2026)
- Table 34. Global Food Cold Chain Preservation and Transportation Sales Value Share by Application (2027-2032)
- Table 35. Global Food Cold Chain Preservation and Transportation Sales Value Comparison by Region: 2021 VS 2025 VS 2032 (US$ Million)
- Table 36. Global Food Cold Chain Preservation and Transportation Sales Value by Region (2021-2026) & (US$ Million)
- Table 37. Global Food Cold Chain Preservation and Transportation Sales Value Share by Region (2021-2026)
- Table 38. Global Food Cold Chain Preservation and Transportation Sales Value by Region (2027-2032) & (US$ Million)
- Table 39. Global Food Cold Chain Preservation and Transportation Sales Value Share by Region (2027-2032)
- Table 40. Global Food Cold Chain Preservation and Transportation Sales Value by Country: 2021 VS 2025 VS 2032 (US$ Million)
- Table 41. Global Food Cold Chain Preservation and Transportation Sales Value by Country (2021-2026) & (US$ Million)
- Table 42. Global Food Cold Chain Preservation and Transportation Sales Value Market Share by Country (2021-2026)
- Table 43. Global Food Cold Chain Preservation and Transportation Sales Value by Country (2027-2032) & (US$ Million)
- Table 44. Global Food Cold Chain Preservation and Transportation Sales Value Market Share by Country (2027-2032)
- Table 45. Trane Technologies Company Information
- Table 46. Trane Technologies Business Overview
- Table 47. Trane Technologies Food Cold Chain Preservation and Transportation Revenue (US$ Million) and Gross Margin (2021-2026)
- Table 48. Trane Technologies Food Cold Chain Preservation and Transportation Product Portfolio
- Table 49. Trane Technologies Recent Development
- Table 50. Carrier Global Company Information
- Table 51. Carrier Global Business Overview
- Table 52. Carrier Global Food Cold Chain Preservation and Transportation Revenue (US$ Million) and Gross Margin (2021-2026)
- Table 53. Carrier Global Food Cold Chain Preservation and Transportation Product Portfolio
- Table 54. Carrier Global Recent Development
- Table 55. Daikin Industries Company Information
- Table 56. Daikin Industries Business Overview
- Table 57. Daikin Industries Food Cold Chain Preservation and Transportation Revenue (US$ Million) and Gross Margin (2021-2026)
- Table 58. Daikin Industries Food Cold Chain Preservation and Transportation Product Portfolio
- Table 59. Daikin Industries Recent Development
- Table 60. CIMC Company Information
- Table 61. CIMC Business Overview
- Table 62. CIMC Food Cold Chain Preservation and Transportation Revenue (US$ Million) and Gross Margin (2021-2026)
- Table 63. CIMC Food Cold Chain Preservation and Transportation Product Portfolio
- Table 64. CIMC Recent Development
- Table 65. COSCO SHIPPING Development Company Information
- Table 66. COSCO SHIPPING Development Business Overview
- Table 67. COSCO SHIPPING Development Food Cold Chain Preservation and Transportation Revenue (US$ Million) and Gross Margin (2021-2026)
- Table 68. COSCO SHIPPING Development Food Cold Chain Preservation and Transportation Product Portfolio
- Table 69. COSCO SHIPPING Development Recent Development
- Table 70. DENSO Company Information
- Table 71. DENSO Business Overview
- Table 72. DENSO Food Cold Chain Preservation and Transportation Revenue (US$ Million) and Gross Margin (2021-2026)
- Table 73. DENSO Food Cold Chain Preservation and Transportation Product Portfolio
- Table 74. DENSO Recent Development
- Table 75. Panasonic Company Information
- Table 76. Panasonic Business Overview
- Table 77. Panasonic Food Cold Chain Preservation and Transportation Revenue (US$ Million) and Gross Margin (2021-2026)
- Table 78. Panasonic Food Cold Chain Preservation and Transportation Product Portfolio
- Table 79. Panasonic Recent Development
- Table 80. Johnson Controls Company Information
- Table 81. Johnson Controls Business Overview
- Table 82. Johnson Controls Food Cold Chain Preservation and Transportation Revenue (US$ Million) and Gross Margin (2021-2026)
- Table 83. Johnson Controls Food Cold Chain Preservation and Transportation Product Portfolio
- Table 84. Johnson Controls Recent Development
- Table 85. Dover Company Information
- Table 86. Dover Business Overview
- Table 87. Dover Food Cold Chain Preservation and Transportation Revenue (US$ Million) and Gross Margin (2021-2026)
- Table 88. Dover Food Cold Chain Preservation and Transportation Product Portfolio
- Table 89. Dover Recent Development
- Table 90. GEA Group Company Information
- Table 91. GEA Group Business Overview
- Table 92. GEA Group Food Cold Chain Preservation and Transportation Revenue (US$ Million) and Gross Margin (2021-2026)
- Table 93. GEA Group Food Cold Chain Preservation and Transportation Product Portfolio
- Table 94. GEA Group Recent Development
- Table 95. Danfoss Company Information
- Table 96. Danfoss Business Overview
- Table 97. Danfoss Food Cold Chain Preservation and Transportation Sales (k units), Value (US$ Million), Price (USD/unit) and Gross Margin (2021-2026)
- Table 98. Danfoss Food Cold Chain Preservation and Transportation Product Portfolio
- Table 99. Danfoss Recent Development
- Table 100. Mitsubishi Heavy Industries Company Information
- Table 101. Mitsubishi Heavy Industries Business Overview
- Table 102. Mitsubishi Heavy Industries Food Cold Chain Preservation and Transportation Sales (k units), Value (US$ Million), Price (USD/unit) and Gross Margin (2021-2026)
- Table 103. Mitsubishi Heavy Industries Food Cold Chain Preservation and Transportation Product Portfolio
- Table 104. Mitsubishi Heavy Industries Recent Development
- Table 105. Liebherr Company Information
- Table 106. Liebherr Business Overview
- Table 107. Liebherr Food Cold Chain Preservation and Transportation Sales (k units), Value (US$ Million), Price (USD/unit) and Gross Margin (2021-2026)
- Table 108. Liebherr Food Cold Chain Preservation and Transportation Product Portfolio
- Table 109. Liebherr Recent Development
- Table 110. Lennox Company Information
- Table 111. Lennox Business Overview
- Table 112. Lennox Food Cold Chain Preservation and Transportation Sales (k units), Value (US$ Million), Price (USD/unit) and Gross Margin (2021-2026)
- Table 113. Lennox Food Cold Chain Preservation and Transportation Product Portfolio
- Table 114. Lennox Recent Development
- Table 115. JBT Marel Company Information
- Table 116. JBT Marel Business Overview
- Table 117. JBT Marel Food Cold Chain Preservation and Transportation Sales (k units), Value (US$ Million), Price (USD/unit) and Gross Margin (2021-2026)
- Table 118. JBT Marel Food Cold Chain Preservation and Transportation Product Portfolio
- Table 119. JBT Marel Recent Development
- Table 120. Hoshizaki Company Information
- Table 121. Hoshizaki Business Overview
- Table 122. Hoshizaki Food Cold Chain Preservation and Transportation Sales (k units), Value (US$ Million), Price (USD/unit) and Gross Margin (2021-2026)
- Table 123. Hoshizaki Food Cold Chain Preservation and Transportation Product Portfolio
- Table 124. Hoshizaki Recent Development
- Table 125. Mayekawa Company Information
- Table 126. Mayekawa Business Overview
- Table 127. Mayekawa Food Cold Chain Preservation and Transportation Sales (k units), Value (US$ Million), Price (USD/unit) and Gross Margin (2021-2026)
- Table 128. Mayekawa Food Cold Chain Preservation and Transportation Product Portfolio
- Table 129. Mayekawa Recent Development
- Table 130. Epta Company Information
- Table 131. Epta Business Overview
- Table 132. Epta Food Cold Chain Preservation and Transportation Sales (k units), Value (US$ Million), Price (USD/unit) and Gross Margin (2021-2026)
- Table 133. Epta Food Cold Chain Preservation and Transportation Product Portfolio
- Table 134. Epta Recent Development
- Table 135. Arneg Company Information
- Table 136. Arneg Business Overview
- Table 137. Arneg Food Cold Chain Preservation and Transportation Sales (k units), Value (US$ Million), Price (USD/unit) and Gross Margin (2021-2026)
- Table 138. Arneg Food Cold Chain Preservation and Transportation Product Portfolio
- Table 139. Arneg Recent Development
- Table 140. Copeland Company Information
- Table 141. Copeland Business Overview
- Table 142. Copeland Food Cold Chain Preservation and Transportation Sales (k units), Value (US$ Million), Price (USD/unit) and Gross Margin (2021-2026)
- Table 143. Copeland Food Cold Chain Preservation and Transportation Product Portfolio
- Table 144. Copeland Recent Development
- Table 145. BITZER Company Information
- Table 146. BITZER Business Overview
- Table 147. BITZER Food Cold Chain Preservation and Transportation Sales (k units), Value (US$ Million), Price (USD/unit) and Gross Margin (2021-2026)
- Table 148. BITZER Food Cold Chain Preservation and Transportation Product Portfolio
- Table 149. BITZER Recent Development
- Table 150. Güntner Group Company Information
- Table 151. Güntner Group Business Overview
- Table 152. Güntner Group Food Cold Chain Preservation and Transportation Sales (k units), Value (US$ Million), Price (USD/unit) and Gross Margin (2021-2026)
- Table 153. Güntner Group Food Cold Chain Preservation and Transportation Product Portfolio
- Table 154. Güntner Group Recent Development
- Table 155. Schmitz Cargobull Company Information
- Table 156. Schmitz Cargobull Business Overview
- Table 157. Schmitz Cargobull Food Cold Chain Preservation and Transportation Sales (k units), Value (US$ Million), Price (USD/unit) and Gross Margin (2021-2026)
- Table 158. Schmitz Cargobull Food Cold Chain Preservation and Transportation Product Portfolio
- Table 159. Schmitz Cargobull Recent Development
- Table 160. Maersk Container Industry Company Information
- Table 161. Maersk Container Industry Business Overview
- Table 162. Maersk Container Industry Food Cold Chain Preservation and Transportation Sales (k units), Value (US$ Million), Price (USD/unit) and Gross Margin (2021-2026)
- Table 163. Maersk Container Industry Food Cold Chain Preservation and Transportation Product Portfolio
- Table 164. Maersk Container Industry Recent Development
- Table 165. Electrolux Professional Company Information
- Table 166. Electrolux Professional Business Overview
- Table 167. Electrolux Professional Food Cold Chain Preservation and Transportation Sales (k units), Value (US$ Million), Price (USD/unit) and Gross Margin (2021-2026)
- Table 168. Electrolux Professional Food Cold Chain Preservation and Transportation Product Portfolio
- Table 169. Electrolux Professional Recent Development
- Table 170. Midera Food Processing Company Information
- Table 171. Midera Food Processing Business Overview
- Table 172. Midera Food Processing Food Cold Chain Preservation and Transportation Sales (k units), Value (US$ Million), Price (USD/unit) and Gross Margin (2021-2026)
- Table 173. Midera Food Processing Food Cold Chain Preservation and Transportation Product Portfolio
- Table 174. Midera Food Processing Recent Development
- Table 175. EVAPCO Company Information
- Table 176. EVAPCO Business Overview
- Table 177. EVAPCO Food Cold Chain Preservation and Transportation Sales (k units), Value (US$ Million), Price (USD/unit) and Gross Margin (2021-2026)
- Table 178. EVAPCO Food Cold Chain Preservation and Transportation Product Portfolio
- Table 179. EVAPCO Recent Development
- Table 180. LUVE Group Company Information
- Table 181. LUVE Group Business Overview
- Table 182. LUVE Group Food Cold Chain Preservation and Transportation Sales (k units), Value (US$ Million), Price (USD/unit) and Gross Margin (2021-2026)
- Table 183. LUVE Group Food Cold Chain Preservation and Transportation Product Portfolio
- Table 184. LUVE Group Recent Development
- Table 185. Rivacold Company Information
- Table 186. Rivacold Business Overview
- Table 187. Rivacold Food Cold Chain Preservation and Transportation Sales (k units), Value (US$ Million), Price (USD/unit) and Gross Margin (2021-2026)
- Table 188. Rivacold Food Cold Chain Preservation and Transportation Product Portfolio
- Table 189. Rivacold Recent Development
- Table 190. Aucma Company Information
- Table 191. Aucma Business Overview
- Table 192. Aucma Food Cold Chain Preservation and Transportation Sales (k units), Value (US$ Million), Price (USD/unit) and Gross Margin (2021-2026)
- Table 193. Aucma Food Cold Chain Preservation and Transportation Product Portfolio
- Table 194. Aucma Recent Development
- Table 195. Bingshan Company Information
- Table 196. Bingshan Business Overview
- Table 197. Bingshan Food Cold Chain Preservation and Transportation Sales (k units), Value (US$ Million), Price (USD/unit) and Gross Margin (2021-2026)
- Table 198. Bingshan Food Cold Chain Preservation and Transportation Product Portfolio
- Table 199. Bingshan Recent Development
- Table 200. Moon Environment Technology Company Information
- Table 201. Moon Environment Technology Business Overview
- Table 202. Moon Environment Technology Food Cold Chain Preservation and Transportation Sales (k units), Value (US$ Million), Price (USD/unit) and Gross Margin (2021-2026)
- Table 203. Moon Environment Technology Food Cold Chain Preservation and Transportation Product Portfolio
- Table 204. Moon Environment Technology Recent Development
- Table 205. Square Technology Group Company Information
- Table 206. Square Technology Group Business Overview
- Table 207. Square Technology Group Food Cold Chain Preservation and Transportation Sales (k units), Value (US$ Million), Price (USD/unit) and Gross Margin (2021-2026)
- Table 208. Square Technology Group Food Cold Chain Preservation and Transportation Product Portfolio
- Table 209. Square Technology Group Recent Development
- Table 210. Hiron Commercial Cold Chain Company Information
- Table 211. Hiron Commercial Cold Chain Business Overview
- Table 212. Hiron Commercial Cold Chain Food Cold Chain Preservation and Transportation Sales (k units), Value (US$ Million), Price (USD/unit) and Gross Margin (2021-2026)
- Table 213. Hiron Commercial Cold Chain Food Cold Chain Preservation and Transportation Product Portfolio
- Table 214. Hiron Commercial Cold Chain Recent Development
- Table 215. Snowman Group Company Information
- Table 216. Snowman Group Business Overview
- Table 217. Snowman Group Food Cold Chain Preservation and Transportation Sales (k units), Value (US$ Million), Price (USD/unit) and Gross Margin (2021-2026)
- Table 218. Snowman Group Food Cold Chain Preservation and Transportation Product Portfolio
- Table 219. Snowman Group Recent Development
- Table 220. Kingspan Company Information
- Table 221. Kingspan Business Overview
- Table 222. Kingspan Food Cold Chain Preservation and Transportation Sales (k units), Value (US$ Million), Price (USD/unit) and Gross Margin (2021-2026)
- Table 223. Kingspan Food Cold Chain Preservation and Transportation Product Portfolio
- Table 224. Kingspan Recent Development
- Table 225. Ali Group Company Information
- Table 226. Ali Group Business Overview
- Table 227. Ali Group Food Cold Chain Preservation and Transportation Sales (k units), Value (US$ Million), Price (USD/unit) and Gross Margin (2021-2026)
- Table 228. Ali Group Food Cold Chain Preservation and Transportation Product Portfolio
- Table 229. Ali Group Recent Development
- Table 230. True Manufacturing Company Information
- Table 231. True Manufacturing Business Overview
- Table 232. True Manufacturing Food Cold Chain Preservation and Transportation Sales (k units), Value (US$ Million), Price (USD/unit) and Gross Margin (2021-2026)
- Table 233. True Manufacturing Food Cold Chain Preservation and Transportation Product Portfolio
- Table 234. True Manufacturing Recent Development
- Table 235. BEWI Company Information
- Table 236. BEWI Business Overview
- Table 237. BEWI Food Cold Chain Preservation and Transportation Sales (k units), Value (US$ Million), Price (USD/unit) and Gross Margin (2021-2026)
- Table 238. BEWI Food Cold Chain Preservation and Transportation Product Portfolio
- Table 239. BEWI Recent Development
- Table 240. Heat and Control Company Information
- Table 241. Heat and Control Business Overview
- Table 242. Heat and Control Food Cold Chain Preservation and Transportation Sales (k units), Value (US$ Million), Price (USD/unit) and Gross Margin (2021-2026)
- Table 243. Heat and Control Food Cold Chain Preservation and Transportation Product Portfolio
- Table 244. Heat and Control Recent Development
- Table 245. FPS Food Process Solutions Company Information
- Table 246. FPS Food Process Solutions Business Overview
- Table 247. FPS Food Process Solutions Food Cold Chain Preservation and Transportation Sales (k units), Value (US$ Million), Price (USD/unit) and Gross Margin (2021-2026)
- Table 248. FPS Food Process Solutions Food Cold Chain Preservation and Transportation Product Portfolio
- Table 249. FPS Food Process Solutions Recent Development
- Table 250. DSI Dantech Company Information
- Table 251. DSI Dantech Business Overview
- Table 252. DSI Dantech Food Cold Chain Preservation and Transportation Sales (k units), Value (US$ Million), Price (USD/unit) and Gross Margin (2021-2026)
- Table 253. DSI Dantech Food Cold Chain Preservation and Transportation Product Portfolio
- Table 254. DSI Dantech Recent Development
- Table 255. Air Products Company Information
- Table 256. Air Products Business Overview
- Table 257. Air Products Food Cold Chain Preservation and Transportation Sales (k units), Value (US$ Million), Price (USD/unit) and Gross Margin (2021-2026)
- Table 258. Air Products Food Cold Chain Preservation and Transportation Product Portfolio
- Table 259. Air Products Recent Development
- Table 260. Linde Company Information
- Table 261. Linde Business Overview
- Table 262. Linde Food Cold Chain Preservation and Transportation Sales (k units), Value (US$ Million), Price (USD/unit) and Gross Margin (2021-2026)
- Table 263. Linde Food Cold Chain Preservation and Transportation Product Portfolio
- Table 264. Linde Recent Development
- Table 265. Krone Company Information
- Table 266. Krone Business Overview
- Table 267. Krone Food Cold Chain Preservation and Transportation Sales (k units), Value (US$ Million), Price (USD/unit) and Gross Margin (2021-2026)
- Table 268. Krone Food Cold Chain Preservation and Transportation Product Portfolio
- Table 269. Krone Recent Development
- Table 270. Great Dane Company Information
- Table 271. Great Dane Business Overview
- Table 272. Great Dane Food Cold Chain Preservation and Transportation Sales (k units), Value (US$ Million), Price (USD/unit) and Gross Margin (2021-2026)
- Table 273. Great Dane Food Cold Chain Preservation and Transportation Product Portfolio
- Table 274. Great Dane Recent Development
- Table 275. Utility Trailer Company Information
- Table 276. Utility Trailer Business Overview
- Table 277. Utility Trailer Food Cold Chain Preservation and Transportation Sales (k units), Value (US$ Million), Price (USD/unit) and Gross Margin (2021-2026)
- Table 278. Utility Trailer Food Cold Chain Preservation and Transportation Product Portfolio
- Table 279. Utility Trailer Recent Development
- Table 280. Hyundai Translead Company Information
- Table 281. Hyundai Translead Business Overview
- Table 282. Hyundai Translead Food Cold Chain Preservation and Transportation Sales (k units), Value (US$ Million), Price (USD/unit) and Gross Margin (2021-2026)
- Table 283. Hyundai Translead Food Cold Chain Preservation and Transportation Product Portfolio
- Table 284. Hyundai Translead Recent Development
- Table 285. Wabash Company Information
- Table 286. Wabash Business Overview
- Table 287. Wabash Food Cold Chain Preservation and Transportation Sales (k units), Value (US$ Million), Price (USD/unit) and Gross Margin (2021-2026)
- Table 288. Wabash Food Cold Chain Preservation and Transportation Product Portfolio
- Table 289. Wabash Recent Development
- Table 290. The Reefer Group Company Information
- Table 291. The Reefer Group Business Overview
- Table 292. The Reefer Group Food Cold Chain Preservation and Transportation Sales (k units), Value (US$ Million), Price (USD/unit) and Gross Margin (2021-2026)
- Table 293. The Reefer Group Food Cold Chain Preservation and Transportation Product Portfolio
- Table 294. The Reefer Group Recent Development
- Table 295. Lamberet Company Information
- Table 296. Lamberet Business Overview
- Table 297. Lamberet Food Cold Chain Preservation and Transportation Sales (k units), Value (US$ Million), Price (USD/unit) and Gross Margin (2021-2026)
- Table 298. Lamberet Food Cold Chain Preservation and Transportation Product Portfolio
- Table 299. Lamberet Recent Development
- Table 300. Kögel Company Information
- Table 301. Kögel Business Overview
- Table 302. Kögel Food Cold Chain Preservation and Transportation Sales (k units), Value (US$ Million), Price (USD/unit) and Gross Margin (2021-2026)
- Table 303. Kögel Food Cold Chain Preservation and Transportation Product Portfolio
- Table 304. Kögel Recent Development
- Table 305. Kingtec Group Company Information
- Table 306. Kingtec Group Business Overview
- Table 307. Kingtec Group Food Cold Chain Preservation and Transportation Sales (k units), Value (US$ Million), Price (USD/unit) and Gross Margin (2021-2026)
- Table 308. Kingtec Group Food Cold Chain Preservation and Transportation Product Portfolio
- Table 309. Kingtec Group Recent Development
- Table 310. Hwasung Thermo Company Information
- Table 311. Hwasung Thermo Business Overview
- Table 312. Hwasung Thermo Food Cold Chain Preservation and Transportation Sales (k units), Value (US$ Million), Price (USD/unit) and Gross Margin (2021-2026)
- Table 313. Hwasung Thermo Food Cold Chain Preservation and Transportation Product Portfolio
- Table 314. Hwasung Thermo Recent Development
- Table 315. Jingxue Energy Saving Technology Company Information
- Table 316. Jingxue Energy Saving Technology Business Overview
- Table 317. Jingxue Energy Saving Technology Food Cold Chain Preservation and Transportation Sales (k units), Value (US$ Million), Price (USD/unit) and Gross Margin (2021-2026)
- Table 318. Jingxue Energy Saving Technology Food Cold Chain Preservation and Transportation Product Portfolio
- Table 319. Jingxue Energy Saving Technology Recent Development
- Table 320. OctoCore Company Information
- Table 321. OctoCore Business Overview
- Table 322. OctoCore Food Cold Chain Preservation and Transportation Sales (k units), Value (US$ Million), Price (USD/unit) and Gross Margin (2021-2026)
- Table 323. OctoCore Food Cold Chain Preservation and Transportation Product Portfolio
- Table 324. OctoCore Recent Development
- Table 325. Knauf Industries Company Information
- Table 326. Knauf Industries Business Overview
- Table 327. Knauf Industries Food Cold Chain Preservation and Transportation Sales (k units), Value (US$ Million), Price (USD/unit) and Gross Margin (2021-2026)
- Table 328. Knauf Industries Food Cold Chain Preservation and Transportation Product Portfolio
- Table 329. Knauf Industries Recent Development
- Table 330. Ranpak Company Information
- Table 331. Ranpak Business Overview
- Table 332. Ranpak Food Cold Chain Preservation and Transportation Sales (k units), Value (US$ Million), Price (USD/unit) and Gross Margin (2021-2026)
- Table 333. Ranpak Food Cold Chain Preservation and Transportation Product Portfolio
- Table 334. Ranpak Recent Development
- Table 335. Cryopak Company Information
- Table 336. Cryopak Business Overview
- Table 337. Cryopak Food Cold Chain Preservation and Transportation Sales (k units), Value (US$ Million), Price (USD/unit) and Gross Margin (2021-2026)
- Table 338. Cryopak Food Cold Chain Preservation and Transportation Product Portfolio
- Table 339. Cryopak Recent Development
- Table 340. CSafe Company Information
- Table 341. CSafe Business Overview
- Table 342. CSafe Food Cold Chain Preservation and Transportation Sales (k units), Value (US$ Million), Price (USD/unit) and Gross Margin (2021-2026)
- Table 343. CSafe Food Cold Chain Preservation and Transportation Product Portfolio
- Table 344. CSafe Recent Development
- Table 345. Research Programs/Design for This Report
- Table 346. Authors List of This Report
- Table 347. Secondary Sources
- Table 348. Primary Sources
List of Figures
- Figure 1. Food Cold Chain Preservation and Transportation Product Image
- Figure 2. Global Food Cold Chain Preservation and Transportation Market Size (US$ Million), 2021 VS 2025 VS 2032
- Figure 3. Global Food Cold Chain Preservation and Transportation Market Size (2021-2032) & (US$ Million)
- Figure 4. Global Food Cold Chain Preservation and Transportation Company Revenue Ranking in 2025 (US$ Million)
- Figure 5. Global Top 5 and 10 Company Market Share by Revenue in 2025 (US$ Million)
- Figure 6. Company Type (Tier 1, Tier 2, and Tier 3): 2021 VS 2025
- Figure 7. Food Cooling & Freezing Equipment Image
- Figure 8. Cold Storage Systems Image
- Figure 9. Refrigerated Transport Equipment Image
- Figure 10. Commercial Refrigeration Equipment Image
- Figure 11. Cold Chain Packaging Image
- Figure 12. Temperature Monitoring Devices Image
- Figure 13. Global Food Cold Chain Preservation and Transportation Sales Value by Type (2021 VS 2025 VS 2032) & (US$ Million)
- Figure 14. Global Food Cold Chain Preservation and Transportation Sales Value Share 2021 VS 2025 VS 2032
- Figure 15. Global Food Cold Chain Preservation and Transportation Sales Value Share by Type (2021-2032)
- Figure 16. Primary Production & Postharvest Handling Image
- Figure 17. Food Processing Image
- Figure 18. Cold Storage & Warehousing Image
- Figure 19. Refrigerated Transportation Image
- Figure 20. Food Retail & Foodservice Image
- Figure 21. Global Food Cold Chain Preservation and Transportation Sales Value by Application (2021 VS 2025 VS 2032) & (US$ Million)
- Figure 22. Global Food Cold Chain Preservation and Transportation Sales Value Share 2021 VS 2025 VS 2032
- Figure 23. Global Food Cold Chain Preservation and Transportation Sales Value Share by Application (2021-2032)
- Figure 24. Global Food Cold Chain Preservation and Transportation Sales Value Comparison by Region: 2021 VS 2025 VS 2032 (US$ Million)
- Figure 25. Global Food Cold Chain Preservation and Transportation Sales Value Share by Region: 2021 VS 2025 VS 2032
- Figure 26. North America Food Cold Chain Preservation and Transportation Sales Value (2021-2032) & (US$ Million)
- Figure 27. North America Food Cold Chain Preservation and Transportation Sales Value Share by Country (%), 2025 VS 2032
- Figure 28. Europe Food Cold Chain Preservation and Transportation Sales Value (2021-2032) & (US$ Million)
- Figure 29. Europe Food Cold Chain Preservation and Transportation Sales Value Share by Country (%), 2025 VS 2032
- Figure 30. Asia-Pacific Food Cold Chain Preservation and Transportation Sales Value (2021-2032) & (US$ Million)
- Figure 31. Asia-Pacific Food Cold Chain Preservation and Transportation Sales Value Share by Country (%), 2025 VS 2032
- Figure 32. South America Food Cold Chain Preservation and Transportation Sales Value (2021-2032) & (US$ Million)
- Figure 33. South America Food Cold Chain Preservation and Transportation Sales Value Share by Country (%), 2025 VS 2032
- Figure 34. Middle East & Africa Food Cold Chain Preservation and Transportation Sales Value (2021-2032) & (US$ Million)
- Figure 35. Middle East & Africa Food Cold Chain Preservation and Transportation Sales Value Share by Country (%), 2025 VS 2032
- Figure 36. USA Food Cold Chain Preservation and Transportation Sales Value Growth Rate (2021-2032) & (US$ Million)
- Figure 37. USA Food Cold Chain Preservation and Transportation Sales Value Share by Type, 2025 VS 2032 & (%)
- Figure 38. USA Food Cold Chain Preservation and Transportation Sales Value Share by Application, 2025 VS 2032 & (%)
- Figure 39. Canada Food Cold Chain Preservation and Transportation Sales Value Growth Rate (2021-2032) & (US$ Million)
- Figure 40. Canada Food Cold Chain Preservation and Transportation Sales Value Share by Type, 2025 VS 2032 & (%)
- Figure 41. Canada Food Cold Chain Preservation and Transportation Sales Value Share by Application, 2025 VS 2032 & (%)
- Figure 42. Mexico Food Cold Chain Preservation and Transportation Sales Value Growth Rate (2021-2032) & (US$ Million)
- Figure 43. Mexico Food Cold Chain Preservation and Transportation Sales Value Share by Type, 2025 VS 2032 & (%)
- Figure 44. Mexico Food Cold Chain Preservation and Transportation Sales Value Share by Application, 2025 VS 2032 & (%)
- Figure 45. Germany Food Cold Chain Preservation and Transportation Sales Value Growth Rate (2021-2032) & (US$ Million)
- Figure 46. Germany Food Cold Chain Preservation and Transportation Sales Value Share by Type, 2025 VS 2032 & (%)
- Figure 47. Germany Food Cold Chain Preservation and Transportation Sales Value Share by Application, 2025 VS 2032 & (%)
- Figure 48. France Food Cold Chain Preservation and Transportation Sales Value Growth Rate (2021-2032) & (US$ Million)
- Figure 49. France Food Cold Chain Preservation and Transportation Sales Value Share by Type, 2025 VS 2032 & (%)
- Figure 50. France Food Cold Chain Preservation and Transportation Sales Value Share by Application, 2025 VS 2032 & (%)
- Figure 51. U.K. Food Cold Chain Preservation and Transportation Sales Value Growth Rate (2021-2032) & (US$ Million)
- Figure 52. U.K. Food Cold Chain Preservation and Transportation Sales Value Share by Type, 2025 VS 2032 & (%)
- Figure 53. U.K. Food Cold Chain Preservation and Transportation Sales Value Share by Application, 2025 VS 2032 & (%)
- Figure 54. Italy Food Cold Chain Preservation and Transportation Sales Value Growth Rate (2021-2032) & (US$ Million)
- Figure 55. Italy Food Cold Chain Preservation and Transportation Sales Value Share by Type, 2025 VS 2032 & (%)
- Figure 56. Italy Food Cold Chain Preservation and Transportation Sales Value Share by Application, 2025 VS 2032 & (%)
- Figure 57. Spain Food Cold Chain Preservation and Transportation Sales Value Growth Rate (2021-2032) & (US$ Million)
- Figure 58. Spain Food Cold Chain Preservation and Transportation Sales Value Share by Type, 2025 VS 2032 & (%)
- Figure 59. Spain Food Cold Chain Preservation and Transportation Sales Value Share by Application, 2025 VS 2032 & (%)
- Figure 60. Russia Food Cold Chain Preservation and Transportation Sales Value Growth Rate (2021-2032) & (US$ Million)
- Figure 61. Russia Food Cold Chain Preservation and Transportation Sales Value Share by Type, 2025 VS 2032 & (%)
- Figure 62. Russia Food Cold Chain Preservation and Transportation Sales Value Share by Application, 2025 VS 2032 & (%)
- Figure 63. Netherlands Food Cold Chain Preservation and Transportation Sales Value Growth Rate (2021-2032) & (US$ Million)
- Figure 64. Netherlands Food Cold Chain Preservation and Transportation Sales Value Share by Type, 2025 VS 2032 & (%)
- Figure 65. Netherlands Food Cold Chain Preservation and Transportation Sales Value Share by Application, 2025 VS 2032 & (%)
- Figure 66. Nordic Countries Food Cold Chain Preservation and Transportation Sales Value Growth Rate (2021-2032) & (US$ Million)
- Figure 67. Nordic Countries Food Cold Chain Preservation and Transportation Sales Value Share by Type, 2025 VS 2032 & (%)
- Figure 68. Nordic Countries Food Cold Chain Preservation and Transportation Sales Value Share by Application, 2025 VS 2032 & (%)
- Figure 69. China Food Cold Chain Preservation and Transportation Sales Value Growth Rate (2021-2032) & (US$ Million)
- Figure 70. China Food Cold Chain Preservation and Transportation Sales Value Share by Type, 2025 VS 2032 & (%)
- Figure 71. China Food Cold Chain Preservation and Transportation Sales Value Share by Application, 2025 VS 2032 & (%)
- Figure 72. Japan Food Cold Chain Preservation and Transportation Sales Value Growth Rate (2021-2032) & (US$ Million)
- Figure 73. Japan Food Cold Chain Preservation and Transportation Sales Value Share by Type, 2025 VS 2032 & (%)
- Figure 74. Japan Food Cold Chain Preservation and Transportation Sales Value Share by Application, 2025 VS 2032 & (%)
- Figure 75. South Korea Food Cold Chain Preservation and Transportation Sales Value Growth Rate (2021-2032) & (US$ Million)
- Figure 76. South Korea Food Cold Chain Preservation and Transportation Sales Value Share by Type, 2025 VS 2032 & (%)
- Figure 77. South Korea Food Cold Chain Preservation and Transportation Sales Value Share by Application, 2025 VS 2032 & (%)
- Figure 78. India Food Cold Chain Preservation and Transportation Sales Value Growth Rate (2021-2032) & (US$ Million)
- Figure 79. India Food Cold Chain Preservation and Transportation Sales Value Share by Type, 2025 VS 2032 & (%)
- Figure 80. India Food Cold Chain Preservation and Transportation Sales Value Share by Application, 2025 VS 2032 & (%)
- Figure 81. Australia Food Cold Chain Preservation and Transportation Sales Value Growth Rate (2021-2032) & (US$ Million)
- Figure 82. Australia Food Cold Chain Preservation and Transportation Sales Value Share by Type, 2025 VS 2032 & (%)
- Figure 83. Australia Food Cold Chain Preservation and Transportation Sales Value Share by Application, 2025 VS 2032 & (%)
- Figure 84. Southeast Asia Food Cold Chain Preservation and Transportation Sales Value Growth Rate (2021-2032) & (US$ Million)
- Figure 85. Southeast Asia Food Cold Chain Preservation and Transportation Sales Value Share by Type, 2025 VS 2032 & (%)
- Figure 86. Southeast Asia Food Cold Chain Preservation and Transportation Sales Value Share by Application, 2025 VS 2032 & (%)
- Figure 87. Brazil Food Cold Chain Preservation and Transportation Sales Value Growth Rate (2021-2032) & (US$ Million)
- Figure 88. Brazil Food Cold Chain Preservation and Transportation Sales Value Share by Type, 2025 VS 2032 & (%)
- Figure 89. Brazil Food Cold Chain Preservation and Transportation Sales Value Share by Application, 2025 VS 2032 & (%)
- Figure 90. Argentina Food Cold Chain Preservation and Transportation Sales Value Growth Rate (2021-2032) & (US$ Million)
- Figure 91. Argentina Food Cold Chain Preservation and Transportation Sales Value Share by Type, 2025 VS 2032 & (%)
- Figure 92. Argentina Food Cold Chain Preservation and Transportation Sales Value Share by Application, 2025 VS 2032 & (%)
- Figure 93. Chile Food Cold Chain Preservation and Transportation Sales Value Growth Rate (2021-2032) & (US$ Million)
- Figure 94. Chile Food Cold Chain Preservation and Transportation Sales Value Share by Type, 2025 VS 2032 & (%)
- Figure 95. Chile Food Cold Chain Preservation and Transportation Sales Value Share by Application, 2025 VS 2032 & (%)
- Figure 96. Colombia Food Cold Chain Preservation and Transportation Sales Value Growth Rate (2021-2032) & (US$ Million)
- Figure 97. Colombia Food Cold Chain Preservation and Transportation Sales Value Share by Type, 2025 VS 2032 & (%)
- Figure 98. Colombia Food Cold Chain Preservation and Transportation Sales Value Share by Application, 2025 VS 2032 & (%)
- Figure 99. Peru Food Cold Chain Preservation and Transportation Sales Value Growth Rate (2021-2032) & (US$ Million)
- Figure 100. Peru Food Cold Chain Preservation and Transportation Sales Value Share by Type, 2025 VS 2032 & (%)
- Figure 101. Peru Food Cold Chain Preservation and Transportation Sales Value Share by Application, 2025 VS 2032 & (%)
- Figure 102. Saudi Arabia Food Cold Chain Preservation and Transportation Sales Value Growth Rate (2021-2032) & (US$ Million)
- Figure 103. Saudi Arabia Food Cold Chain Preservation and Transportation Sales Value Share by Type, 2025 VS 2032 & (%)
- Figure 104. Saudi Arabia Food Cold Chain Preservation and Transportation Sales Value Share by Application, 2025 VS 2032 & (%)
- Figure 105. Israel Food Cold Chain Preservation and Transportation Sales Value Growth Rate (2021-2032) & (US$ Million)
- Figure 106. Israel Food Cold Chain Preservation and Transportation Sales Value Share by Type, 2025 VS 2032 & (%)
- Figure 107. Israel Food Cold Chain Preservation and Transportation Sales Value Share by Application, 2025 VS 2032 & (%)
- Figure 108. UAE Food Cold Chain Preservation and Transportation Sales Value Growth Rate (2021-2032) & (US$ Million)
- Figure 109. UAE Food Cold Chain Preservation and Transportation Sales Value Share by Type, 2025 VS 2032 & (%)
- Figure 110. UAE Food Cold Chain Preservation and Transportation Sales Value Share by Application, 2025 VS 2032 & (%)
- Figure 111. Turkey Food Cold Chain Preservation and Transportation Sales Value Growth Rate (2021-2032) & (US$ Million)
- Figure 112. Turkey Food Cold Chain Preservation and Transportation Sales Value Share by Type, 2025 VS 2032 & (%)
- Figure 113. Turkey Food Cold Chain Preservation and Transportation Sales Value Share by Application, 2025 VS 2032 & (%)
- Figure 114. Iran Food Cold Chain Preservation and Transportation Sales Value Growth Rate (2021-2032) & (US$ Million)
- Figure 115. Iran Food Cold Chain Preservation and Transportation Sales Value Share by Type, 2025 VS 2032 & (%)
- Figure 116. Iran Food Cold Chain Preservation and Transportation Sales Value Share by Application, 2025 VS 2032 & (%)
- Figure 117. Egypt Food Cold Chain Preservation and Transportation Sales Value Growth Rate (2021-2032) & (US$ Million)
- Figure 118. Egypt Food Cold Chain Preservation and Transportation Sales Value Share by Type, 2025 VS 2032 & (%)
- Figure 119. Egypt Food Cold Chain Preservation and Transportation Sales Value Share by Application, 2025 VS 2032 & (%)
- Figure 120. Years Considered
- Figure 121. Research Process
- Figure 122. Key Executives Interviewed
Scope & coverage.
By Type
- Food Cooling & Freezing Equipment
- Cold Storage Systems
- Refrigerated Transport Equipment
- Commercial Refrigeration Equipment
- Cold Chain Packaging
- Temperature Monitoring Devices
By Application
- Primary Production & Postharvest Handling
- Food Processing
- Cold Storage & Warehousing
- Refrigerated Transportation
- Food Retail & Foodservice
Companies covered
- Trane Technologies
- Carrier Global
- Daikin Industries
- CIMC
- COSCO SHIPPING Development
- DENSO
- Panasonic
- Johnson Controls
- Dover
- GEA Group
- Danfoss
- Mitsubishi Heavy Industries
- Liebherr
- Lennox
- JBT Marel
- Hoshizaki
- Mayekawa
- Epta
- Arneg
- Copeland
- BITZER
- Güntner Group
- Schmitz Cargobull
- Maersk Container Industry
- Electrolux Professional
- Midera Food Processing
- EVAPCO
- LUVE Group
- Rivacold
- Aucma
- Bingshan
- Moon Environment Technology
- Square Technology Group
- Hiron Commercial Cold Chain
- Snowman Group
- Kingspan
- Ali Group
- True Manufacturing
- BEWI
- Heat and Control
- FPS Food Process Solutions
- DSI Dantech
- Air Products
- Linde
- Krone
- Great Dane
- Utility Trailer
- Hyundai Translead
- Wabash
- The Reefer Group
- Lamberet
- Kögel
- Kingtec Group
- Hwasung Thermo
- Jingxue Energy Saving Technology
- OctoCore
- Knauf Industries
- Ranpak
- Cryopak
- CSafe
Inside the report.
1 Market Overview
- 1.1 Product Definition
- 1.2 Global Food Cold Chain Preservation and Transportation Market Size, 2021 VS 2025 VS 2032
- 1.3 Global Food Cold Chain Preservation and Transportation Market Size (2021-2032)
- 1.4 Assumptions and Limitations
- 1.5 Study Goals and Objectives
2 Food Cold Chain Preservation and Transportation Market Dynamics
- 2.1 Food Cold Chain Preservation and Transportation Industry Trends
- 2.2 Food Cold Chain Preservation and Transportation Industry Drivers
- 2.3 Food Cold Chain Preservation and Transportation Industry Opportunities and Challenges
- 2.4 Food Cold Chain Preservation and Transportation Industry Restraints
3 Food Cold Chain Preservation and Transportation Market by Company
- 3.1 Global Food Cold Chain Preservation and Transportation Company Revenue Ranking in 2025
- 3.2 Global Food Cold Chain Preservation and Transportation Revenue by Company (2021-2026)
- 3.3 Global Food Cold Chain Preservation and Transportation Company Ranking (2024-2026)
- 3.4 Global Food Cold Chain Preservation and Transportation Company Manufacturing Base and Headquarters
- 3.5 Global Food Cold Chain Preservation and Transportation Company Product Type and Application
- 3.6 Global Food Cold Chain Preservation and Transportation Company Establishment Date
- 3.7 Market Competitive Analysis
- 3.7.1 Global Food Cold Chain Preservation and Transportation Market Concentration Ratio (CR5 and HHI)
- 3.7.2 Global Top 5 and 10 Company Market Share by Revenue in 2025
- 3.7.3 2025 Food Cold Chain Preservation and Transportation Tier 1, Tier 2, and Tier 3 Companies
- 3.8 Mergers and Acquisitions Expansion
4 Food Cold Chain Preservation and Transportation Market by Type
- 4.1 Food Cold Chain Preservation and Transportation Type Introduction
- 4.1.1 Food Cooling & Freezing Equipment
- 4.1.2 Cold Storage Systems
- 4.1.3 Refrigerated Transport Equipment
- 4.1.4 Commercial Refrigeration Equipment
- 4.1.5 Cold Chain Packaging
- 4.1.6 Temperature Monitoring Devices
- 4.2 Global Food Cold Chain Preservation and Transportation Sales Value by Type
- 4.2.1 Global Food Cold Chain Preservation and Transportation Sales Value by Type (2021 VS 2025 VS 2032)
- 4.2.2 Global Food Cold Chain Preservation and Transportation Sales Value by Type (2021-2032)
- 4.2.3 Global Food Cold Chain Preservation and Transportation Sales Value Share by Type (2021-2032)
5 Food Cold Chain Preservation and Transportation Market by Application
- 5.1 Food Cold Chain Preservation and Transportation Application Introduction
- 5.1.1 Primary Production & Postharvest Handling
- 5.1.2 Food Processing
- 5.1.3 Cold Storage & Warehousing
- 5.1.4 Refrigerated Transportation
- 5.1.5 Food Retail & Foodservice
- 5.2 Global Food Cold Chain Preservation and Transportation Sales Value by Application
- 5.2.1 Global Food Cold Chain Preservation and Transportation Sales Value by Application (2021 VS 2025 VS 2032)
- 5.2.2 Global Food Cold Chain Preservation and Transportation Sales Value by Application (2021-2032)
- 5.2.3 Global Food Cold Chain Preservation and Transportation Sales Value Share by Application (2021-2032)
6 Food Cold Chain Preservation and Transportation Regional Value Analysis
- 6.1 Global Food Cold Chain Preservation and Transportation Sales Value by Region: 2021 VS 2025 VS 2032
- 6.2 Global Food Cold Chain Preservation and Transportation Sales Value by Region (2021-2032)
- 6.2.1 Global Food Cold Chain Preservation and Transportation Sales Value by Region: 2021-2026
- 6.2.2 Global Food Cold Chain Preservation and Transportation Sales Value by Region (2027-2032)
- 6.3 North America
- 6.3.1 North America Food Cold Chain Preservation and Transportation Sales Value (2021-2032)
- 6.3.2 North America Food Cold Chain Preservation and Transportation Sales Value Share by Country, 2025 VS 2032
- 6.4 Europe
- 6.4.1 Europe Food Cold Chain Preservation and Transportation Sales Value (2021-2032)
- 6.4.2 Europe Food Cold Chain Preservation and Transportation Sales Value Share by Country, 2025 VS 2032
- 6.5 Asia-Pacific
- 6.5.1 Asia-Pacific Food Cold Chain Preservation and Transportation Sales Value (2021-2032)
- 6.5.2 Asia-Pacific Food Cold Chain Preservation and Transportation Sales Value Share by Country, 2025 VS 2032
- 6.6 South America
- 6.6.1 South America Food Cold Chain Preservation and Transportation Sales Value (2021-2032)
- 6.6.2 South America Food Cold Chain Preservation and Transportation Sales Value Share by Country, 2025 VS 2032
- 6.7 Middle East & Africa
- 6.7.1 Middle East & Africa Food Cold Chain Preservation and Transportation Sales Value (2021-2032)
- 6.7.2 Middle East & Africa Food Cold Chain Preservation and Transportation Sales Value Share by Country, 2025 VS 2032
7 Food Cold Chain Preservation and Transportation Country-level Value Analysis
- 7.1 Global Food Cold Chain Preservation and Transportation Sales Value by Country: 2021 VS 2025 VS 2032
- 7.2 Global Food Cold Chain Preservation and Transportation Sales Value by Country (2021-2032)
- 7.2.1 Global Food Cold Chain Preservation and Transportation Sales Value by Country (2021-2026)
- 7.2.2 Global Food Cold Chain Preservation and Transportation Sales Value by Country (2027-2032)
- 7.3 USA
- 7.3.1 USA Food Cold Chain Preservation and Transportation Sales Value Growth Rate (2021-2032)
- 7.3.2 USA Food Cold Chain Preservation and Transportation Sales Value Share by Type, 2025 VS 2032
- 7.3.3 USA Food Cold Chain Preservation and Transportation Sales Value Share by Application, 2025 VS 2032
- 7.4 Canada
- 7.4.1 Canada Food Cold Chain Preservation and Transportation Sales Value Growth Rate (2021-2032)
- 7.4.2 Canada Food Cold Chain Preservation and Transportation Sales Value Share by Type, 2025 VS 2032
- 7.4.3 Canada Food Cold Chain Preservation and Transportation Sales Value Share by Application, 2025 VS 2032
- 7.5 Mexico
- 7.5.1 Mexico Food Cold Chain Preservation and Transportation Sales Value Growth Rate (2021-2032)
- 7.5.2 Mexico Food Cold Chain Preservation and Transportation Sales Value Share by Type, 2025 VS 2032
- 7.5.3 Mexico Food Cold Chain Preservation and Transportation Sales Value Share by Application, 2025 VS 2032
- 7.6 Germany
- 7.6.1 Germany Food Cold Chain Preservation and Transportation Sales Value Growth Rate (2021-2032)
- 7.6.2 Germany Food Cold Chain Preservation and Transportation Sales Value Share by Type, 2025 VS 2032
- 7.6.3 Germany Food Cold Chain Preservation and Transportation Sales Value Share by Application, 2025 VS 2032
- 7.7 France
- 7.7.1 France Food Cold Chain Preservation and Transportation Sales Value Growth Rate (2021-2032)
- 7.7.2 France Food Cold Chain Preservation and Transportation Sales Value Share by Type, 2025 VS 2032
- 7.7.3 France Food Cold Chain Preservation and Transportation Sales Value Share by Application, 2025 VS 2032
- 7.8 U.K.
- 7.8.1 U.K. Food Cold Chain Preservation and Transportation Sales Value Growth Rate (2021-2032)
- 7.8.2 U.K. Food Cold Chain Preservation and Transportation Sales Value Share by Type, 2025 VS 2032
- 7.8.3 U.K. Food Cold Chain Preservation and Transportation Sales Value Share by Application, 2025 VS 2032
- 7.9 Italy
- 7.9.1 Italy Food Cold Chain Preservation and Transportation Sales Value Growth Rate (2021-2032)
- 7.9.2 Italy Food Cold Chain Preservation and Transportation Sales Value Share by Type, 2025 VS 2032
- 7.9.3 Italy Food Cold Chain Preservation and Transportation Sales Value Share by Application, 2025 VS 2032
- 7.10 Spain
- 7.10.1 Spain Food Cold Chain Preservation and Transportation Sales Value Growth Rate (2021-2032)
- 7.10.2 Spain Food Cold Chain Preservation and Transportation Sales Value Share by Type, 2025 VS 2032
- 7.10.3 Spain Food Cold Chain Preservation and Transportation Sales Value Share by Application, 2025 VS 2032
- 7.11 Russia
- 7.11.1 Russia Food Cold Chain Preservation and Transportation Sales Value Growth Rate (2021-2032)
- 7.11.2 Russia Food Cold Chain Preservation and Transportation Sales Value Share by Type, 2025 VS 2032
- 7.11.3 Russia Food Cold Chain Preservation and Transportation Sales Value Share by Application, 2025 VS 2032
- 7.12 Netherlands
- 7.12.1 Netherlands Food Cold Chain Preservation and Transportation Sales Value Growth Rate (2021-2032)
- 7.12.2 Netherlands Food Cold Chain Preservation and Transportation Sales Value Share by Type, 2025 VS 2032
- 7.12.3 Netherlands Food Cold Chain Preservation and Transportation Sales Value Share by Application, 2025 VS 2032
- 7.13 Nordic Countries
- 7.13.1 Nordic Countries Food Cold Chain Preservation and Transportation Sales Value Growth Rate (2021-2032)
- 7.13.2 Nordic Countries Food Cold Chain Preservation and Transportation Sales Value Share by Type, 2025 VS 2032
- 7.13.3 Nordic Countries Food Cold Chain Preservation and Transportation Sales Value Share by Application, 2025 VS 2032
- 7.14 China
- 7.14.1 China Food Cold Chain Preservation and Transportation Sales Value Growth Rate (2021-2032)
- 7.14.2 China Food Cold Chain Preservation and Transportation Sales Value Share by Type, 2025 VS 2032
- 7.14.3 China Food Cold Chain Preservation and Transportation Sales Value Share by Application, 2025 VS 2032
- 7.15 Japan
- 7.15.1 Japan Food Cold Chain Preservation and Transportation Sales Value Growth Rate (2021-2032)
- 7.15.2 Japan Food Cold Chain Preservation and Transportation Sales Value Share by Type, 2025 VS 2032
- 7.15.3 Japan Food Cold Chain Preservation and Transportation Sales Value Share by Application, 2025 VS 2032
- 7.16 South Korea
- 7.16.1 South Korea Food Cold Chain Preservation and Transportation Sales Value Growth Rate (2021-2032)
- 7.16.2 South Korea Food Cold Chain Preservation and Transportation Sales Value Share by Type, 2025 VS 2032
- 7.16.3 South Korea Food Cold Chain Preservation and Transportation Sales Value Share by Application, 2025 VS 2032
- 7.17 India
- 7.17.1 India Food Cold Chain Preservation and Transportation Sales Value Growth Rate (2021-2032)
- 7.17.2 India Food Cold Chain Preservation and Transportation Sales Value Share by Type, 2025 VS 2032
- 7.17.3 India Food Cold Chain Preservation and Transportation Sales Value Share by Application, 2025 VS 2032
- 7.18 Australia
- 7.18.1 Australia Food Cold Chain Preservation and Transportation Sales Value Growth Rate (2021-2032)
- 7.18.2 Australia Food Cold Chain Preservation and Transportation Sales Value Share by Type, 2025 VS 2032
- 7.18.3 Australia Food Cold Chain Preservation and Transportation Sales Value Share by Application, 2025 VS 2032
- 7.19 Southeast Asia
- 7.19.1 Southeast Asia Food Cold Chain Preservation and Transportation Sales Value Growth Rate (2021-2032)
- 7.19.2 Southeast Asia Food Cold Chain Preservation and Transportation Sales Value Share by Type, 2025 VS 2032
- 7.19.3 Southeast Asia Food Cold Chain Preservation and Transportation Sales Value Share by Application, 2025 VS 2032
- 7.20 Brazil
- 7.20.1 Brazil Food Cold Chain Preservation and Transportation Sales Value Growth Rate (2021-2032)
- 7.20.2 Brazil Food Cold Chain Preservation and Transportation Sales Value Share by Type, 2025 VS 2032
- 7.20.3 Brazil Food Cold Chain Preservation and Transportation Sales Value Share by Application, 2025 VS 2032
- 7.21 Argentina
- 7.21.1 Argentina Food Cold Chain Preservation and Transportation Sales Value Growth Rate (2021-2032)
- 7.21.2 Argentina Food Cold Chain Preservation and Transportation Sales Value Share by Type, 2025 VS 2032
- 7.21.3 Argentina Food Cold Chain Preservation and Transportation Sales Value Share by Application, 2025 VS 2032
- 7.22 Chile
- 7.22.1 Chile Food Cold Chain Preservation and Transportation Sales Value Growth Rate (2021-2032)
- 7.22.2 Chile Food Cold Chain Preservation and Transportation Sales Value Share by Type, 2025 VS 2032
- 7.22.3 Chile Food Cold Chain Preservation and Transportation Sales Value Share by Application, 2025 VS 2032
- 7.23 Colombia
- 7.23.1 Colombia Food Cold Chain Preservation and Transportation Sales Value Growth Rate (2021-2032)
- 7.23.2 Colombia Food Cold Chain Preservation and Transportation Sales Value Share by Type, 2025 VS 2032
- 7.23.3 Colombia Food Cold Chain Preservation and Transportation Sales Value Share by Application, 2025 VS 2032
- 7.24 Peru
- 7.24.1 Peru Food Cold Chain Preservation and Transportation Sales Value Growth Rate (2021-2032)
- 7.24.2 Peru Food Cold Chain Preservation and Transportation Sales Value Share by Type, 2025 VS 2032
- 7.24.3 Peru Food Cold Chain Preservation and Transportation Sales Value Share by Application, 2025 VS 2032
- 7.25 Saudi Arabia
- 7.25.1 Saudi Arabia Food Cold Chain Preservation and Transportation Sales Value Growth Rate (2021-2032)
- 7.25.2 Saudi Arabia Food Cold Chain Preservation and Transportation Sales Value Share by Type, 2025 VS 2032
- 7.25.3 Saudi Arabia Food Cold Chain Preservation and Transportation Sales Value Share by Application, 2025 VS 2032
- 7.26 Israel
- 7.26.1 Israel Food Cold Chain Preservation and Transportation Sales Value Growth Rate (2021-2032)
- 7.26.2 Israel Food Cold Chain Preservation and Transportation Sales Value Share by Type, 2025 VS 2032
- 7.26.3 Israel Food Cold Chain Preservation and Transportation Sales Value Share by Application, 2025 VS 2032
- 7.27 UAE
- 7.27.1 UAE Food Cold Chain Preservation and Transportation Sales Value Growth Rate (2021-2032)
- 7.27.2 UAE Food Cold Chain Preservation and Transportation Sales Value Share by Type, 2025 VS 2032
- 7.27.3 UAE Food Cold Chain Preservation and Transportation Sales Value Share by Application, 2025 VS 2032
- 7.28 Turkey
- 7.28.1 Turkey Food Cold Chain Preservation and Transportation Sales Value Growth Rate (2021-2032)
- 7.28.2 Turkey Food Cold Chain Preservation and Transportation Sales Value Share by Type, 2025 VS 2032
- 7.28.3 Turkey Food Cold Chain Preservation and Transportation Sales Value Share by Application, 2025 VS 2032
- 7.29 Iran
- 7.29.1 Iran Food Cold Chain Preservation and Transportation Sales Value Growth Rate (2021-2032)
- 7.29.2 Iran Food Cold Chain Preservation and Transportation Sales Value Share by Type, 2025 VS 2032
- 7.29.3 Iran Food Cold Chain Preservation and Transportation Sales Value Share by Application, 2025 VS 2032
- 7.30 Egypt
- 7.30.1 Egypt Food Cold Chain Preservation and Transportation Sales Value Growth Rate (2021-2032)
- 7.30.2 Egypt Food Cold Chain Preservation and Transportation Sales Value Share by Type, 2025 VS 2032
- 7.30.3 Egypt Food Cold Chain Preservation and Transportation Sales Value Share by Application, 2025 VS 2032
8 Company Profiles
- 8.1 Trane Technologies
- 8.1.1 Trane Technologies Company Information
- 8.1.2 Trane Technologies Business Overview
- 8.1.3 Trane Technologies Food Cold Chain Preservation and Transportation Revenue and Gross Margin (2021-2026)
- 8.1.4 Trane Technologies Food Cold Chain Preservation and Transportation Product Portfolio
- 8.1.5 Trane Technologies Recent Developments
- 8.2 Carrier Global
- 8.2.1 Carrier Global Company Information
- 8.2.2 Carrier Global Business Overview
- 8.2.3 Carrier Global Food Cold Chain Preservation and Transportation Revenue and Gross Margin (2021-2026)
- 8.2.4 Carrier Global Food Cold Chain Preservation and Transportation Product Portfolio
- 8.2.5 Carrier Global Recent Developments
- 8.3 Daikin Industries
- 8.3.1 Daikin Industries Company Information
- 8.3.2 Daikin Industries Business Overview
- 8.3.3 Daikin Industries Food Cold Chain Preservation and Transportation Revenue and Gross Margin (2021-2026)
- 8.3.4 Daikin Industries Food Cold Chain Preservation and Transportation Product Portfolio
- 8.3.5 Daikin Industries Recent Developments
- 8.4 CIMC
- 8.4.1 CIMC Company Information
- 8.4.2 CIMC Business Overview
- 8.4.3 CIMC Food Cold Chain Preservation and Transportation Revenue and Gross Margin (2021-2026)
- 8.4.4 CIMC Food Cold Chain Preservation and Transportation Product Portfolio
- 8.4.5 CIMC Recent Developments
- 8.5 COSCO SHIPPING Development
- 8.5.1 COSCO SHIPPING Development Company Information
- 8.5.2 COSCO SHIPPING Development Business Overview
- 8.5.3 COSCO SHIPPING Development Food Cold Chain Preservation and Transportation Revenue and Gross Margin (2021-2026)
- 8.5.4 COSCO SHIPPING Development Food Cold Chain Preservation and Transportation Product Portfolio
- 8.5.5 COSCO SHIPPING Development Recent Developments
- 8.6 DENSO
- 8.6.1 DENSO Company Information
- 8.6.2 DENSO Business Overview
- 8.6.3 DENSO Food Cold Chain Preservation and Transportation Revenue and Gross Margin (2021-2026)
- 8.6.4 DENSO Food Cold Chain Preservation and Transportation Product Portfolio
- 8.6.5 DENSO Recent Developments
- 8.7 Panasonic
- 8.7.1 Panasonic Company Information
- 8.7.2 Panasonic Business Overview
- 8.7.3 Panasonic Food Cold Chain Preservation and Transportation Revenue and Gross Margin (2021-2026)
- 8.7.4 Panasonic Food Cold Chain Preservation and Transportation Product Portfolio
- 8.7.5 Panasonic Recent Developments
- 8.8 Johnson Controls
- 8.8.1 Johnson Controls Company Information
- 8.8.2 Johnson Controls Business Overview
- 8.8.3 Johnson Controls Food Cold Chain Preservation and Transportation Revenue and Gross Margin (2021-2026)
- 8.8.4 Johnson Controls Food Cold Chain Preservation and Transportation Product Portfolio
- 8.8.5 Johnson Controls Recent Developments
- 8.9 Dover
- 8.9.1 Dover Company Information
- 8.9.2 Dover Business Overview
- 8.9.3 Dover Food Cold Chain Preservation and Transportation Revenue and Gross Margin (2021-2026)
- 8.9.4 Dover Food Cold Chain Preservation and Transportation Product Portfolio
- 8.9.5 Dover Recent Developments
- 8.10 GEA Group
- 8.10.1 GEA Group Company Information
- 8.10.2 GEA Group Business Overview
- 8.10.3 GEA Group Food Cold Chain Preservation and Transportation Revenue and Gross Margin (2021-2026)
- 8.10.4 GEA Group Food Cold Chain Preservation and Transportation Product Portfolio
- 8.10.5 GEA Group Recent Developments
- 8.11 Danfoss
- 8.11.1 Danfoss Company Information
- 8.11.2 Danfoss Business Overview
- 8.11.3 Danfoss Food Cold Chain Preservation and Transportation Revenue and Gross Margin (2021-2026)
- 8.11.4 Danfoss Food Cold Chain Preservation and Transportation Product Portfolio
- 8.11.5 Danfoss Recent Developments
- 8.12 Mitsubishi Heavy Industries
- 8.12.1 Mitsubishi Heavy Industries Company Information
- 8.12.2 Mitsubishi Heavy Industries Business Overview
- 8.12.3 Mitsubishi Heavy Industries Food Cold Chain Preservation and Transportation Revenue and Gross Margin (2021-2026)
- 8.12.4 Mitsubishi Heavy Industries Food Cold Chain Preservation and Transportation Product Portfolio
- 8.12.5 Mitsubishi Heavy Industries Recent Developments
- 8.13 Liebherr
- 8.13.1 Liebherr Company Information
- 8.13.2 Liebherr Business Overview
- 8.13.3 Liebherr Food Cold Chain Preservation and Transportation Revenue and Gross Margin (2021-2026)
- 8.13.4 Liebherr Food Cold Chain Preservation and Transportation Product Portfolio
- 8.13.5 Liebherr Recent Developments
- 8.14 Lennox
- 8.14.1 Lennox Company Information
- 8.14.2 Lennox Business Overview
- 8.14.3 Lennox Food Cold Chain Preservation and Transportation Revenue and Gross Margin (2021-2026)
- 8.14.4 Lennox Food Cold Chain Preservation and Transportation Product Portfolio
- 8.14.5 Lennox Recent Developments
- 8.15 JBT Marel
- 8.15.1 JBT Marel Company Information
- 8.15.2 JBT Marel Business Overview
- 8.15.3 JBT Marel Food Cold Chain Preservation and Transportation Revenue and Gross Margin (2021-2026)
- 8.15.4 JBT Marel Food Cold Chain Preservation and Transportation Product Portfolio
- 8.15.5 JBT Marel Recent Developments
- 8.16 Hoshizaki
- 8.16.1 Hoshizaki Company Information
- 8.16.2 Hoshizaki Business Overview
- 8.16.3 Hoshizaki Food Cold Chain Preservation and Transportation Revenue and Gross Margin (2021-2026)
- 8.16.4 Hoshizaki Food Cold Chain Preservation and Transportation Product Portfolio
- 8.16.5 Hoshizaki Recent Developments
- 8.17 Mayekawa
- 8.17.1 Mayekawa Company Information
- 8.17.2 Mayekawa Business Overview
- 8.17.3 Mayekawa Food Cold Chain Preservation and Transportation Revenue and Gross Margin (2021-2026)
- 8.17.4 Mayekawa Food Cold Chain Preservation and Transportation Product Portfolio
- 8.17.5 Mayekawa Recent Developments
- 8.18 Epta
- 8.18.1 Epta Company Information
- 8.18.2 Epta Business Overview
- 8.18.3 Epta Food Cold Chain Preservation and Transportation Revenue and Gross Margin (2021-2026)
- 8.18.4 Epta Food Cold Chain Preservation and Transportation Product Portfolio
- 8.18.5 Epta Recent Developments
- 8.19 Arneg
- 8.19.1 Arneg Company Information
- 8.19.2 Arneg Business Overview
- 8.19.3 Arneg Food Cold Chain Preservation and Transportation Revenue and Gross Margin (2021-2026)
- 8.19.4 Arneg Food Cold Chain Preservation and Transportation Product Portfolio
- 8.19.5 Arneg Recent Developments
- 8.20 Copeland
- 8.20.1 Copeland Company Information
- 8.20.2 Copeland Business Overview
- 8.20.3 Copeland Food Cold Chain Preservation and Transportation Revenue and Gross Margin (2021-2026)
- 8.20.4 Copeland Food Cold Chain Preservation and Transportation Product Portfolio
- 8.20.5 Copeland Recent Developments
- 8.21 BITZER
- 8.21.1 BITZER Company Information
- 8.21.2 BITZER Business Overview
- 8.21.3 BITZER Food Cold Chain Preservation and Transportation Revenue and Gross Margin (2021-2026)
- 8.21.4 BITZER Food Cold Chain Preservation and Transportation Product Portfolio
- 8.21.5 BITZER Recent Developments
- 8.22 Güntner Group
- 8.22.1 Güntner Group Company Information
- 8.22.2 Güntner Group Business Overview
- 8.22.3 Güntner Group Food Cold Chain Preservation and Transportation Revenue and Gross Margin (2021-2026)
- 8.22.4 Güntner Group Food Cold Chain Preservation and Transportation Product Portfolio
- 8.22.5 Güntner Group Recent Developments
- 8.23 Schmitz Cargobull
- 8.23.1 Schmitz Cargobull Company Information
- 8.23.2 Schmitz Cargobull Business Overview
- 8.23.3 Schmitz Cargobull Food Cold Chain Preservation and Transportation Revenue and Gross Margin (2021-2026)
- 8.23.4 Schmitz Cargobull Food Cold Chain Preservation and Transportation Product Portfolio
- 8.23.5 Schmitz Cargobull Recent Developments
- 8.24 Maersk Container Industry
- 8.24.1 Maersk Container Industry Company Information
- 8.24.2 Maersk Container Industry Business Overview
- 8.24.3 Maersk Container Industry Food Cold Chain Preservation and Transportation Revenue and Gross Margin (2021-2026)
- 8.24.4 Maersk Container Industry Food Cold Chain Preservation and Transportation Product Portfolio
- 8.24.5 Maersk Container Industry Recent Developments
- 8.25 Electrolux Professional
- 8.25.1 Electrolux Professional Company Information
- 8.25.2 Electrolux Professional Business Overview
- 8.25.3 Electrolux Professional Food Cold Chain Preservation and Transportation Revenue and Gross Margin (2021-2026)
- 8.25.4 Electrolux Professional Food Cold Chain Preservation and Transportation Product Portfolio
- 8.25.5 Electrolux Professional Recent Developments
- 8.26 Midera Food Processing
- 8.26.1 Midera Food Processing Company Information
- 8.26.2 Midera Food Processing Business Overview
- 8.26.3 Midera Food Processing Food Cold Chain Preservation and Transportation Revenue and Gross Margin (2021-2026)
- 8.26.4 Midera Food Processing Food Cold Chain Preservation and Transportation Product Portfolio
- 8.26.5 Midera Food Processing Recent Developments
- 8.27 EVAPCO
- 8.27.1 EVAPCO Company Information
- 8.27.2 EVAPCO Business Overview
- 8.27.3 EVAPCO Food Cold Chain Preservation and Transportation Revenue and Gross Margin (2021-2026)
- 8.27.4 EVAPCO Food Cold Chain Preservation and Transportation Product Portfolio
- 8.27.5 EVAPCO Recent Developments
- 8.28 LUVE Group
- 8.28.1 LUVE Group Company Information
- 8.28.2 LUVE Group Business Overview
- 8.28.3 LUVE Group Food Cold Chain Preservation and Transportation Revenue and Gross Margin (2021-2026)
- 8.28.4 LUVE Group Food Cold Chain Preservation and Transportation Product Portfolio
- 8.28.5 LUVE Group Recent Developments
- 8.29 Rivacold
- 8.29.1 Rivacold Company Information
- 8.29.2 Rivacold Business Overview
- 8.29.3 Rivacold Food Cold Chain Preservation and Transportation Revenue and Gross Margin (2021-2026)
- 8.29.4 Rivacold Food Cold Chain Preservation and Transportation Product Portfolio
- 8.29.5 Rivacold Recent Developments
- 8.30 Aucma
- 8.30.1 Aucma Company Information
- 8.30.2 Aucma Business Overview
- 8.30.3 Aucma Food Cold Chain Preservation and Transportation Revenue and Gross Margin (2021-2026)
- 8.30.4 Aucma Food Cold Chain Preservation and Transportation Product Portfolio
- 8.30.5 Aucma Recent Developments
- 8.31 Bingshan
- 8.31.1 Bingshan Company Information
- 8.31.2 Bingshan Business Overview
- 8.31.3 Bingshan Food Cold Chain Preservation and Transportation Revenue and Gross Margin (2021-2026)
- 8.31.4 Bingshan Food Cold Chain Preservation and Transportation Product Portfolio
- 8.31.5 Bingshan Recent Developments
- 8.32 Moon Environment Technology
- 8.32.1 Moon Environment Technology Company Information
- 8.32.2 Moon Environment Technology Business Overview
- 8.32.3 Moon Environment Technology Food Cold Chain Preservation and Transportation Revenue and Gross Margin (2021-2026)
- 8.32.4 Moon Environment Technology Food Cold Chain Preservation and Transportation Product Portfolio
- 8.32.5 Moon Environment Technology Recent Developments
- 8.33 Square Technology Group
- 8.33.1 Square Technology Group Company Information
- 8.33.2 Square Technology Group Business Overview
- 8.33.3 Square Technology Group Food Cold Chain Preservation and Transportation Revenue and Gross Margin (2021-2026)
- 8.33.4 Square Technology Group Food Cold Chain Preservation and Transportation Product Portfolio
- 8.33.5 Square Technology Group Recent Developments
- 8.34 Hiron Commercial Cold Chain
- 8.34.1 Hiron Commercial Cold Chain Company Information
- 8.34.2 Hiron Commercial Cold Chain Business Overview
- 8.34.3 Hiron Commercial Cold Chain Food Cold Chain Preservation and Transportation Revenue and Gross Margin (2021-2026)
- 8.34.4 Hiron Commercial Cold Chain Food Cold Chain Preservation and Transportation Product Portfolio
- 8.34.5 Hiron Commercial Cold Chain Recent Developments
- 8.35 Snowman Group
- 8.35.1 Snowman Group Company Information
- 8.35.2 Snowman Group Business Overview
- 8.35.3 Snowman Group Food Cold Chain Preservation and Transportation Revenue and Gross Margin (2021-2026)
- 8.35.4 Snowman Group Food Cold Chain Preservation and Transportation Product Portfolio
- 8.35.5 Snowman Group Recent Developments
- 8.36 Kingspan
- 8.36.1 Kingspan Company Information
- 8.36.2 Kingspan Business Overview
- 8.36.3 Kingspan Food Cold Chain Preservation and Transportation Revenue and Gross Margin (2021-2026)
- 8.36.4 Kingspan Food Cold Chain Preservation and Transportation Product Portfolio
- 8.36.5 Kingspan Recent Developments
- 8.37 Ali Group
- 8.37.1 Ali Group Company Information
- 8.37.2 Ali Group Business Overview
- 8.37.3 Ali Group Food Cold Chain Preservation and Transportation Revenue and Gross Margin (2021-2026)
- 8.37.4 Ali Group Food Cold Chain Preservation and Transportation Product Portfolio
- 8.37.5 Ali Group Recent Developments
- 8.38 True Manufacturing
- 8.38.1 True Manufacturing Company Information
- 8.38.2 True Manufacturing Business Overview
- 8.38.3 True Manufacturing Food Cold Chain Preservation and Transportation Revenue and Gross Margin (2021-2026)
- 8.38.4 True Manufacturing Food Cold Chain Preservation and Transportation Product Portfolio
- 8.38.5 True Manufacturing Recent Developments
- 8.39 BEWI
- 8.39.1 BEWI Company Information
- 8.39.2 BEWI Business Overview
- 8.39.3 BEWI Food Cold Chain Preservation and Transportation Revenue and Gross Margin (2021-2026)
- 8.39.4 BEWI Food Cold Chain Preservation and Transportation Product Portfolio
- 8.39.5 BEWI Recent Developments
- 8.40 Heat and Control
- 8.40.1 Heat and Control Company Information
- 8.40.2 Heat and Control Business Overview
- 8.40.3 Heat and Control Food Cold Chain Preservation and Transportation Revenue and Gross Margin (2021-2026)
- 8.40.4 Heat and Control Food Cold Chain Preservation and Transportation Product Portfolio
- 8.40.5 Heat and Control Recent Developments
- 8.41 FPS Food Process Solutions
- 8.41.1 FPS Food Process Solutions Company Information
- 8.41.2 FPS Food Process Solutions Business Overview
- 8.41.3 FPS Food Process Solutions Food Cold Chain Preservation and Transportation Revenue and Gross Margin (2021-2026)
- 8.41.4 FPS Food Process Solutions Food Cold Chain Preservation and Transportation Product Portfolio
- 8.41.5 FPS Food Process Solutions Recent Developments
- 8.42 DSI Dantech
- 8.42.1 DSI Dantech Company Information
- 8.42.2 DSI Dantech Business Overview
- 8.42.3 DSI Dantech Food Cold Chain Preservation and Transportation Revenue and Gross Margin (2021-2026)
- 8.42.4 DSI Dantech Food Cold Chain Preservation and Transportation Product Portfolio
- 8.42.5 DSI Dantech Recent Developments
- 8.43 Air Products
- 8.43.1 Air Products Company Information
- 8.43.2 Air Products Business Overview
- 8.43.3 Air Products Food Cold Chain Preservation and Transportation Revenue and Gross Margin (2021-2026)
- 8.43.4 Air Products Food Cold Chain Preservation and Transportation Product Portfolio
- 8.43.5 Air Products Recent Developments
- 8.44 Linde
- 8.44.1 Linde Company Information
- 8.44.2 Linde Business Overview
- 8.44.3 Linde Food Cold Chain Preservation and Transportation Revenue and Gross Margin (2021-2026)
- 8.44.4 Linde Food Cold Chain Preservation and Transportation Product Portfolio
- 8.44.5 Linde Recent Developments
- 8.45 Krone
- 8.45.1 Krone Company Information
- 8.45.2 Krone Business Overview
- 8.45.3 Krone Food Cold Chain Preservation and Transportation Revenue and Gross Margin (2021-2026)
- 8.45.4 Krone Food Cold Chain Preservation and Transportation Product Portfolio
- 8.45.5 Krone Recent Developments
- 8.46 Great Dane
- 8.46.1 Great Dane Company Information
- 8.46.2 Great Dane Business Overview
- 8.46.3 Great Dane Food Cold Chain Preservation and Transportation Revenue and Gross Margin (2021-2026)
- 8.46.4 Great Dane Food Cold Chain Preservation and Transportation Product Portfolio
- 8.46.5 Great Dane Recent Developments
- 8.47 Utility Trailer
- 8.47.1 Utility Trailer Company Information
- 8.47.2 Utility Trailer Business Overview
- 8.47.3 Utility Trailer Food Cold Chain Preservation and Transportation Revenue and Gross Margin (2021-2026)
- 8.47.4 Utility Trailer Food Cold Chain Preservation and Transportation Product Portfolio
- 8.47.5 Utility Trailer Recent Developments
- 8.48 Hyundai Translead
- 8.48.1 Hyundai Translead Company Information
- 8.48.2 Hyundai Translead Business Overview
- 8.48.3 Hyundai Translead Food Cold Chain Preservation and Transportation Revenue and Gross Margin (2021-2026)
- 8.48.4 Hyundai Translead Food Cold Chain Preservation and Transportation Product Portfolio
- 8.48.5 Hyundai Translead Recent Developments
- 8.49 Wabash
- 8.49.1 Wabash Company Information
- 8.49.2 Wabash Business Overview
- 8.49.3 Wabash Food Cold Chain Preservation and Transportation Revenue and Gross Margin (2021-2026)
- 8.49.4 Wabash Food Cold Chain Preservation and Transportation Product Portfolio
- 8.49.5 Wabash Recent Developments
- 8.50 The Reefer Group
- 8.50.1 The Reefer Group Company Information
- 8.50.2 The Reefer Group Business Overview
- 8.50.3 The Reefer Group Food Cold Chain Preservation and Transportation Revenue and Gross Margin (2021-2026)
- 8.50.4 The Reefer Group Food Cold Chain Preservation and Transportation Product Portfolio
- 8.50.5 The Reefer Group Recent Developments
- 8.51 Lamberet
- 8.51.1 Lamberet Company Information
- 8.51.2 Lamberet Business Overview
- 8.51.3 Lamberet Food Cold Chain Preservation and Transportation Revenue and Gross Margin (2021-2026)
- 8.51.4 Lamberet Food Cold Chain Preservation and Transportation Product Portfolio
- 8.51.5 Lamberet Recent Developments
- 8.52 Kögel
- 8.52.1 Kögel Company Information
- 8.52.2 Kögel Business Overview
- 8.52.3 Kögel Food Cold Chain Preservation and Transportation Revenue and Gross Margin (2021-2026)
- 8.52.4 Kögel Food Cold Chain Preservation and Transportation Product Portfolio
- 8.52.5 Kögel Recent Developments
- 8.53 Kingtec Group
- 8.53.1 Kingtec Group Company Information
- 8.53.2 Kingtec Group Business Overview
- 8.53.3 Kingtec Group Food Cold Chain Preservation and Transportation Revenue and Gross Margin (2021-2026)
- 8.53.4 Kingtec Group Food Cold Chain Preservation and Transportation Product Portfolio
- 8.53.5 Kingtec Group Recent Developments
- 8.54 Hwasung Thermo
- 8.54.1 Hwasung Thermo Company Information
- 8.54.2 Hwasung Thermo Business Overview
- 8.54.3 Hwasung Thermo Food Cold Chain Preservation and Transportation Revenue and Gross Margin (2021-2026)
- 8.54.4 Hwasung Thermo Food Cold Chain Preservation and Transportation Product Portfolio
- 8.54.5 Hwasung Thermo Recent Developments
- 8.55 Jingxue Energy Saving Technology
- 8.55.1 Jingxue Energy Saving Technology Company Information
- 8.55.2 Jingxue Energy Saving Technology Business Overview
- 8.55.3 Jingxue Energy Saving Technology Food Cold Chain Preservation and Transportation Revenue and Gross Margin (2021-2026)
- 8.55.4 Jingxue Energy Saving Technology Food Cold Chain Preservation and Transportation Product Portfolio
- 8.55.5 Jingxue Energy Saving Technology Recent Developments
- 8.56 OctoCore
- 8.56.1 OctoCore Company Information
- 8.56.2 OctoCore Business Overview
- 8.56.3 OctoCore Food Cold Chain Preservation and Transportation Revenue and Gross Margin (2021-2026)
- 8.56.4 OctoCore Food Cold Chain Preservation and Transportation Product Portfolio
- 8.56.5 OctoCore Recent Developments
- 8.57 Knauf Industries
- 8.57.1 Knauf Industries Company Information
- 8.57.2 Knauf Industries Business Overview
- 8.57.3 Knauf Industries Food Cold Chain Preservation and Transportation Revenue and Gross Margin (2021-2026)
- 8.57.4 Knauf Industries Food Cold Chain Preservation and Transportation Product Portfolio
- 8.57.5 Knauf Industries Recent Developments
- 8.58 Ranpak
- 8.58.1 Ranpak Company Information
- 8.58.2 Ranpak Business Overview
- 8.58.3 Ranpak Food Cold Chain Preservation and Transportation Revenue and Gross Margin (2021-2026)
- 8.58.4 Ranpak Food Cold Chain Preservation and Transportation Product Portfolio
- 8.58.5 Ranpak Recent Developments
- 8.59 Cryopak
- 8.59.1 Cryopak Company Information
- 8.59.2 Cryopak Business Overview
- 8.59.3 Cryopak Food Cold Chain Preservation and Transportation Revenue and Gross Margin (2021-2026)
- 8.59.4 Cryopak Food Cold Chain Preservation and Transportation Product Portfolio
- 8.59.5 Cryopak Recent Developments
- 8.60 CSafe
- 8.60.1 CSafe Company Information
- 8.60.2 CSafe Business Overview
- 8.60.3 CSafe Food Cold Chain Preservation and Transportation Revenue and Gross Margin (2021-2026)
- 8.60.4 CSafe Food Cold Chain Preservation and Transportation Product Portfolio
- 8.60.5 CSafe Recent Developments
9 Concluding Insights
10 Appendix
- 10.1 Reasons for Doing This Study
- 10.2 Research Methodology
- 10.3 Research Process
- 10.4 Authors List of This Report
- 10.5 Data Source
- 10.5.1 Secondary Sources
- 10.5.2 Primary Sources
GET THE RESEARCH
Choose your license.
PDF by email within 3–5 working days after payment confirmation.
Talk to an analyst