APO RESEARCH · REPORT
Amino Acid Surfactants
Amino acid surfactants are a family of mild surface-active agents in which the hydrophilic moiety is derived from an amino acid and the hydrophobic moiety is introduced through a fatty chain, typically from coconut, lauric, or other natural fatty-acid feedstocks.
Product & engineering
Understand the product.
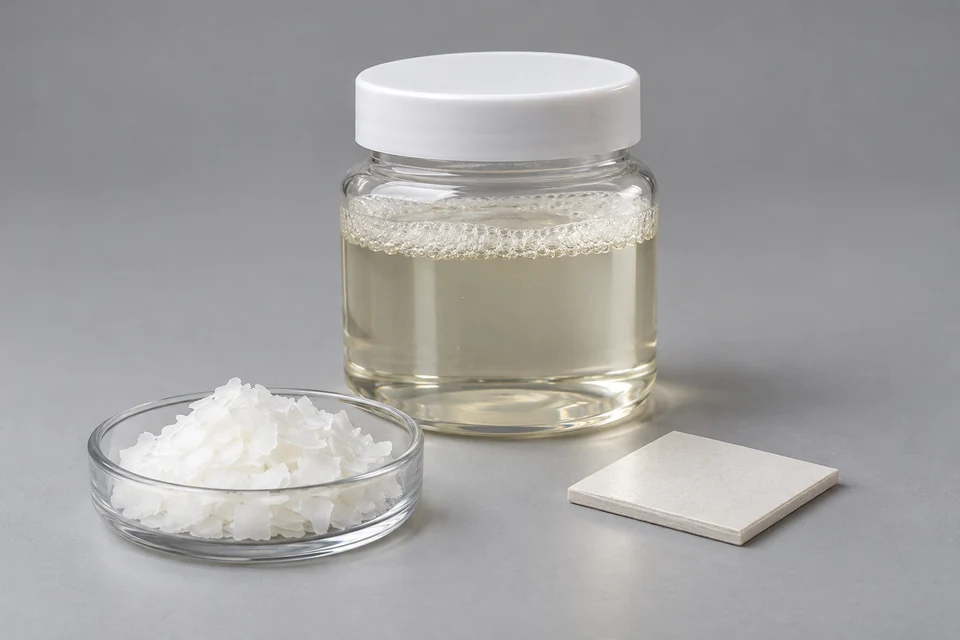
Amino acid surfactants are a family of mild surface-active agents in which the hydrophilic moiety is derived from an amino acid and the hydrophobic moiety is introduced through a fatty chain, typically from coconut, lauric, or other natural fatty-acid feedstocks. In commercial use they are positioned primarily as sulfate-free cleansing materials for skin, hair, and oral-care formulations, combining effective detergency with low irritation, favorable skin feel, and ready biodegradability. Most industrial products belong to the N-acyl amino acid salt class, in which an amino acid such as glutamic acid, glycine, sarcosine, alanine, taurine, or aspartic acid is linked to a C12–C18 fatty acyl group and then neutralized into a sodium, potassium, or alkanolamine salt to obtain the desired solubility, foaming profile, and formulation compatibility.
The manufacturing route is centered on acylation chemistry. In industrial practice, the amino acid or its derivative is reacted with a fatty-acid chloride, ester, anhydride, or related acyl donor to form the amide bond, followed by neutralization to produce the final surfactant salt. The downstream process typically includes removal of residual reactants and salts, control of color and odor, adjustment of active content, and conversion into the required commercial form, which may be aqueous solution, paste, powder, or flake. Product performance is strongly influenced by the amino-acid backbone, fatty-chain distribution, counterion, residual free fatty acid, and electrolyte level, all of which affect mildness, foam texture, viscosity response, hard-water tolerance, and compatibility with co-surfactants and conditioning agents.
From a commercial classification standpoint, amino acid surfactants are most usefully grouped by amino-acid family rather than by a generic ionic taxonomy. The principal product families are glutamate-based surfactants, glycinate-based surfactants, sarcosinate-based surfactants, alaninate-based surfactants, taurate-based surfactants, and smaller aspartate or related specialty variants. The category is dominated by mild anionic systems, although amphoteric amino acid-derived surfactants also exist in adjacent specialty niches. Glutamates and glycinate derivatives are widely used where softness, creamy foam, and skin mildness are critical; sarcosinates are valued for efficient cleansing and broad formulation latitude; alaninates are used in mild rinse-off systems with favorable foam and viscosity behavior; taurates are established in premium sulfate-free cleansers because of their dense foam and stability across practical formulation conditions.
The application base of amino acid surfactants is concentrated in personal care and oral care rather than commodity household detergency. Their strongest positions are in facial cleansers, body washes and shower gels, shampoos, baby cleansers, hand cleansers, intimate cleansers, syndet bars, and selected toothpaste or oral cleansing systems. In these formulations they are used either as primary surfactants or as part of blended surfactant systems to raise mildness, improve after-feel, refine foam quality, and support sulfate-free positioning. Their industrial value lies in the ability to deliver a premium cleansing profile that aligns with modern formulation requirements for low irritation, biodegradability, renewable-feedstock compatibility, and sensory performance.
Composition, supplied form and processing history determine the usable material. Evaluate the property required by the actual application with the specified test method; a chemistry name alone does not define a finished grade.
What turns activity into demand
Qualified formulation or component output creates material purchases through loading, process yield and the supplied mass basis. Raw material, formulated blend and finished-part revenues describe separate transaction stages.
The commercial boundary
For Amino Acid Surfactants, distinguish the supplied product from its inputs and the complete application. Report types and applications may overlap; retain the selected edition's product definition, geography, period, unit and transaction basis when comparing estimates.
Which conditions determine usable amino acid surfactants performance?
Amino acid surfactants are a family of mild surface-active agents in which the hydrophilic moiety is derived from an amino acid and the hydrophobic moiety is introduced through a fatty chain, typically from coconut, lauric, or other natural fatty-acid feedstocks. Match formulation and impurity limits to the converting process, then verify the property after processing or curing. Compare like-for-like dry or as-supplied quantities; a finished component and its raw material represent different transaction stages.
Selected research
Industry Growth & Trends
Global Amino Acid Surfactants Industry Growth and Trends Forecast to 2032
Market perspective
Amino acid surfactants are a family of mild surface-active agents in which the hydrophilic moiety is derived from an amino acid and the hydrophobic moiety is introduced through a fatty chain, typically from coconut, lauric, or other natural fatty-acid feedstocks. In commercial use they are positioned primarily as sulfate-free cleansing materials for skin, hair, and oral-care formulations, combining effective detergency with low irritation, favorable skin feel, and ready biodegradability. Most industrial products belong to the N-acyl amino acid salt class, in which an amino acid such as glutamic acid, glycine, sarcosine, alanine, taurine, or aspartic acid is linked to a C12–C18 fatty acyl group and then neutralized into a sodium, potassium, or alkanolamine salt to obtain the desired solubility, foaming profile, and formulation compatibility.
The manufacturing route is centered on acylation chemistry. In industrial practice, the amino acid or its derivative is reacted with a fatty-acid chloride, ester, anhydride, or related acyl donor to form the amide bond, followed by neutralization to produce the final surfactant salt. The downstream process typically includes removal of residual reactants and salts, control of color and odor, adjustment of active content, and conversion into the required commercial form, which may be aqueous solution, paste, powder, or flake. Product performance is strongly influenced by the amino-acid backbone, fatty-chain distribution, counterion, residual free fatty acid, and electrolyte level, all of which affect mildness, foam texture, viscosity response, hard-water tolerance, and compatibility with co-surfactants and conditioning agents.
From a commercial classification standpoint, amino acid surfactants are most usefully grouped by amino-acid family rather than by a generic ionic taxonomy. The principal product families are glutamate-based surfactants, glycinate-based surfactants, sarcosinate-based surfactants, alaninate-based surfactants, taurate-based surfactants, and smaller aspartate or related specialty variants. The category is dominated by mild anionic systems, although amphoteric amino acid-derived surfactants also exist in adjacent specialty niches. Glutamates and glycinate derivatives are widely used where softness, creamy foam, and skin mildness are critical; sarcosinates are valued for efficient cleansing and broad formulation latitude; alaninates are used in mild rinse-off systems with favorable foam and viscosity behavior; taurates are established in premium sulfate-free cleansers because of their dense foam and stability across practical formulation conditions.
Read the full market overview
The application base of amino acid surfactants is concentrated in personal care and oral care rather than commodity household detergency. Their strongest positions are in facial cleansers, body washes and shower gels, shampoos, baby cleansers, hand cleansers, intimate cleansers, syndet bars, and selected toothpaste or oral cleansing systems. In these formulations they are used either as primary surfactants or as part of blended surfactant systems to raise mildness, improve after-feel, refine foam quality, and support sulfate-free positioning. Their industrial value lies in the ability to deliver a premium cleansing profile that aligns with modern formulation requirements for low irritation, biodegradability, renewable-feedstock compatibility, and sensory performance.
The global Amino Acid Surfactants market reached USD 973.11 million in 2025, up from USD 788.14 million in 2021, while sales volume increased from 224.42 kt to 259.61 kt over the same period. Average selling price rose from USD 3,512 per ton in 2021 to USD 3,748 per ton in 2025. Looking ahead, the market is projected to reach USD 1,465.97 million by 2032, with sales volume rising to 369.76 kt and average selling price to USD 3,965 per ton. This implies a value CAGR of 5.88% and a volume CAGR of 5.22% for 2026 to 2032, indicating that future expansion will continue to be supported by both broader shipment scale and gradual mix improvement.
Market development is being shaped by a deeper shift in cleansing formulation priorities. Amino Acid Surfactants has moved further into mainstream premium rinse off systems as formulators place greater weight on low irritation cleansing, weakly acidic formulation design, creamy foam profile, cleaner rinse feel, and stronger biodegradability positioning. The category is also benefiting from continued expansion in sulfate free liquids, higher value facial cleansing systems, premium shampoos, baby care, intimate care, and selected solid or concentrated formats. At the same time, the market remains technically selective. Product adoption still depends on the ability of each chemistry and each supplier to deliver stable active matter, acceptable viscosity behavior, low odor, low color, and consistent downstream formulation performance.
By type, the market remains concentrated in Glutamic Acid Based and Glycine Based chemistries. In 2025, Glutamic Acid Based accounted for 92.55 kt and USD 307.61 million, while Glycine Based reached 81.93 kt and USD 318.69 million. Glycine Based has already moved ahead in value terms and is expected to strengthen its lead further by 2032, reflecting its combination of large shipment scale and a structurally higher value position. Taurate Based remains the third largest type and one of the faster growing mainstream chemistries, reaching 37.75 kt and USD 164.26 million in 2025. Sarcosine Based held a mid tier position at 28.79 kt and USD 108.21 million, while Alanine Based remained smaller in scale though firmly premium in price and application profile. The resulting type structure shows that market leadership is being determined by chemistry specific performance windows rather than by simple volume accumulation alone.
By application, Facial Cleansing remained the largest segment in 2025, accounting for 107.24 kt and USD 425.36 million, equal to 43.71% of total market value. Hair Cleansing followed with 72.74 kt and USD 266.34 million, while Body Cleansing reached 43.46 kt and USD 142.85 million. Baby Care, Intimate Care, and Hand Cleansing remained smaller but strategically important end uses, especially in systems where low irritation and repeated use tolerance are critical. By 2032, Facial Cleansing is expected to remain the leading application, though Hair Cleansing and Body Cleansing are projected to gain relative weight, reflecting wider penetration of amino acid based surfactant systems in broader personal cleansing routines.
Regional demand remains led by China, North America, and Europe. In 2025, China accounted for USD 301.15 million, North America for USD 261.89 million, and Europe for USD 206.35 million. Asia excluding China generated USD 144.70 million, while Middle East, Africa, and South America remained comparatively smaller at USD 59.02 million. China is expected to deliver the largest absolute increase in market value through 2032, supported by both rising local demand and its growing role in global supply. North America and Europe continue to hold important positions due to higher average selling prices, more premium application mix, and stronger penetration in higher specification cleansing categories.
Report Scope
This report provides a structured, data-driven view of the global Amino Acid Surfactants market, combining harmonized quantitative metrics with targeted qualitative insight to support business and growth strategy, market positioning, and capital allocation.
The Amino Acid Surfactants market size, estimates, and forecasts are presented in terms of sales volume (kt) and revenue (US$ million), with 2025 as the base year and historical and forecast data for 2021-2032. The report segments the global Amino Acid Surfactants market by Type, Application, region/country, and company, provides regional market sizes at the segment level, profiles the competitive landscape and key players and their market ranks, and reviews technology trends and new product developments relevant to Amino Acid Surfactants.
Key Companies & Market Share Insights
This section analyzes the strategies and performance of leading manufacturers in the global Amino Acid Surfactants market, including portfolio focus, innovation and product development, mergers and acquisitions, collaborations, and geographic expansion used to sustain or enhance competitive positions. It also summarizes recent corporate developments and key financial indicators and provides global revenue, price, and sales volume data by manufacturer for 2020-2025, enabling benchmarking of scale, pricing, and market share and supporting assessment of market concentration through indicators such as CR5 and CR10.
Amino Acid Surfactants Market by Company
Ajinomoto
Clariant
Tinci Materials
Nanjing Huashi New Material
Croda International
Galaxy Surfactants
BASF
Miwon Commercial
Schill+Seilacher
Zschimmer & Schwarz
Innospec
Stepan
NOF Corporation
Changsha Puji Biotechnology
Guangzhou Startec Science and Technology
Syensqo
Sanyo Chemical
Taiwan NJC
Huzhou Ouli Biological
Hunan Resun
Zhangjiagang Great Chemicals
Asahi Kasei Finechem
Berg + Schmidt
Amino Acid Surfactants Segment by Type
Glutamic Acid Based
Glycine Based
Taurate Based
Sarcosine Based
Alanine Based
Others
Amino Acid Surfactants Segment by Application
Facial Cleansing
Hair Cleansing
Body Cleansing
Baby Care
Intimate Care
Hand Cleansing
Others
Amino Acid Surfactants Segment by Region
North America
United States
Canada
Mexico
Europe
Germany
France
U.K.
Italy
Russia
Spain
Netherlands
Switzerland
Sweden
Poland
Asia-Pacific
China
Japan
South Korea
India
Australia
Taiwan
Southeast Asia
South America
Brazil
Argentina
Chile
Colombia
Middle East & Africa
Egypt
South Africa
Israel
Türkiye
GCC Countries
Key Drivers & Barriers
High-impact rendering factors and drivers have been studied in this report to aid the readers to understand the general development. Moreover, the report includes restraints and challenges that may act as stumbling blocks on the way of the players. This will assist the users to be attentive and make informed decisions related to business. Specialists have also laid their focus on the upcoming business prospects.
Reasons to Buy This Report
1. This report will help the readers to understand the competition within the industries and strategies for the competitive environment to enhance the potential profit. The report also focuses on the competitive landscape of the global Amino Acid Surfactants market, and introduces in detail the market share, industry ranking, competitor ecosystem, market performance, new product development, operation situation, expansion, and acquisition. etc. of the main players, which helps the readers to identify the main competitors and deeply understand the competition pattern of the market.
2. This report will help stakeholders to understand the global industry status and trends of Amino Acid Surfactants and provides them with information on key market drivers, restraints, challenges, and opportunities.
3. This report will help stakeholders to understand competitors better and gain more insights to strengthen their position in their businesses. The competitive landscape section includes the market share and rank (in volume and value), competitor ecosystem, new product development, expansion, and acquisition.
4. This report stays updated with novel technology integration, features, and the latest developments in the market.
5. This report helps stakeholders to gain insights into which regions to target globally.
6. This report helps stakeholders to gain insights into the end-user perception concerning the adoption of Amino Acid Surfactants.
7. This report helps stakeholders to identify some of the key players in the market and understand their valuable contribution.
Chapter Outline
Chapter 1: Introduces the study scope of this report, executive summary of market segments by type, market size segments for North America, Europe, Asia Pacific, South America, Middle East & Africa.
Chapter 2: Introduces the market dynamics, latest developments of the market, the driving factors and restrictive factors of the market, the challenges and risks faced by manufacturers in the industry, and the analysis of relevant policies in the industry.
Chapter 3: Detailed analysis of Amino Acid Surfactants manufacturers competitive landscape, price, sales, revenue, market share and ranking, latest development plan, merger, and acquisition information, etc.
Chapter 4: Sales, revenue of Amino Acid Surfactants in regional level. It provides a quantitative analysis of the market size and development potential of each region and introduces the future development prospects, and market space in the world.
Chapter 5: Introduces market segments by application, market size segment for North America, Europe, Asia Pacific, South America, Middle East & Africa.
Chapter 6: Provides profiles of key players, introducing the basic situation of the main companies in the market in detail, including product sales, revenue, price, gross margin, product introduction, recent development, etc.
Chapter 7, 8, 9, 10 and 11: North America, Europe, Asia Pacific, South America, Middle East & Africa, sales and revenue by country.
Chapter 12: Analysis of industrial chain, key raw materials, manufacturing cost, and market dynamics.
Chapter 13: Concluding Insights of the report.
More report detail
Tables and figures
Scope & coverage.
Types
- Glutamic Acid Based
- Glycine Based
- Taurate Based
- Sarcosine Based
- Alanine Based
- Others
Applications
- Facial Cleansing
- Hair Cleansing
- Body Cleansing
- Baby Care
- Intimate Care
- Hand Cleansing
- Others
Companies covered
- Ajinomoto
- Clariant
- Tinci Materials
- Nanjing Huashi New Material
- Croda International
- Galaxy Surfactants
- BASF
- Miwon Commercial
- Schill+Seilacher
- Zschimmer & Schwarz
- Innospec
- Stepan
- NOF Corporation
- Changsha Puji Biotechnology
- Guangzhou Startec Science and Technology
- Syensqo
- Sanyo Chemical
- Taiwan NJC
- Huzhou Ouli Biological
- Hunan Resun
- Zhangjiagang Great Chemicals
- Asahi Kasei Finechem
- Berg + Schmidt
Inside the report.
1 Market Overview
- 1.1 Product Definition
- 1.2 Global Market Growth Prospects
- 1.2.1 Global Amino Acid Surfactants Market Size Estimates and Forecasts (2021-2032)
- 1.2.2 Global Amino Acid Surfactants Sales Estimates and Forecasts (2021-2032)
- 1.3 Amino Acid Surfactants Market by Type
- 1.3.1 Glutamic Acid Based
- 1.3.2 Glycine Based
- 1.3.3 Taurate Based
- 1.3.4 Sarcosine Based
- 1.3.5 Alanine Based
- 1.3.6 Others
- 1.4 Global Amino Acid Surfactants Market Size by Type
- 1.4.1 Global Amino Acid Surfactants Market Size Overview by Type (2021-2032)
- 1.4.2 Global Amino Acid Surfactants Historic Market Size Review by Type (2021-2026)
- 1.4.3 Global Amino Acid Surfactants Forecasted Market Size by Type (2027-2032)
- 1.5 Key Regions Market Size by Type
- 1.5.1 North America Amino Acid Surfactants Sales Breakdown by Type (2021-2026)
- 1.5.2 Europe Amino Acid Surfactants Sales Breakdown by Type (2021-2026)
- 1.5.3 Asia-Pacific Amino Acid Surfactants Sales Breakdown by Type (2021-2026)
- 1.5.4 South America Amino Acid Surfactants Sales Breakdown by Type (2021-2026)
- 1.5.5 Middle East and Africa Amino Acid Surfactants Sales Breakdown by Type (2021-2026)
2 Global Market Dynamics
- 2.1 Amino Acid Surfactants Industry Trends
- 2.2 Amino Acid Surfactants Industry Drivers
- 2.3 Amino Acid Surfactants Industry Opportunities and Challenges
- 2.4 Amino Acid Surfactants Industry Restraints
3 Market Competitive Landscape by Company
- 3.1 Global Top Players by Amino Acid Surfactants Revenue (2021-2026)
- 3.2 Global Top Players by Amino Acid Surfactants Sales (2021-2026)
- 3.3 Global Top Players by Amino Acid Surfactants Price (2021-2026)
- 3.4 Global Amino Acid Surfactants Industry Company Ranking, 2024 VS 2025 VS 2026
- 3.5 Global Amino Acid Surfactants Major Company Production Sites & Headquarters
- 3.6 Global Amino Acid Surfactants Company, Product Type & Application
- 3.7 Global Amino Acid Surfactants Company Establishment Date
- 3.8 Market Competitive Analysis
- 3.8.1 Global Amino Acid Surfactants Market CR5 and HHI
- 3.8.2 Global Top 5 and 10 Amino Acid Surfactants Players Market Share by Revenue in 2025
- 3.8.3 2025 Amino Acid Surfactants Tier 1, Tier 2, and Tier 3
4 Amino Acid Surfactants Regional Status and Outlook
- 4.1 Global Amino Acid Surfactants Market Size and CAGR by Region: 2021 VS 2025 VS 2032
- 4.2 Global Amino Acid Surfactants Historic Market Size by Region
- 4.2.1 Global Amino Acid Surfactants Sales in Volume by Region (2021-2026)
- 4.2.2 Global Amino Acid Surfactants Sales in Value by Region (2021-2026)
- 4.2.3 Global Amino Acid Surfactants Sales (Volume & Value), Price and Gross Margin (2021-2026)
- 4.3 Global Amino Acid Surfactants Forecasted Market Size by Region
- 4.3.1 Global Amino Acid Surfactants Sales in Volume by Region (2027-2032)
- 4.3.2 Global Amino Acid Surfactants Sales in Value by Region (2027-2032)
- 4.3.3 Global Amino Acid Surfactants Sales (Volume & Value), Price and Gross Margin (2027-2032)
5 Amino Acid Surfactants by Application
- 5.1 Amino Acid Surfactants Market by Application
- 5.1.1 Facial Cleansing
- 5.1.2 Hair Cleansing
- 5.1.3 Body Cleansing
- 5.1.4 Baby Care
- 5.1.5 Intimate Care
- 5.1.6 Hand Cleansing
- 5.1.7 Others
- 5.2 Global Amino Acid Surfactants Market Size by Application
- 5.2.1 Global Amino Acid Surfactants Market Size Overview by Application (2021-2032)
- 5.2.2 Global Amino Acid Surfactants Historic Market Size Review by Application (2021-2026)
- 5.2.3 Global Amino Acid Surfactants Forecasted Market Size by Application (2027-2032)
- 5.3 Key Regions Market Size by Application
- 5.3.1 North America Amino Acid Surfactants Sales Breakdown by Application (2021-2026)
- 5.3.2 Europe Amino Acid Surfactants Sales Breakdown by Application (2021-2026)
- 5.3.3 Asia-Pacific Amino Acid Surfactants Sales Breakdown by Application (2021-2026)
- 5.3.4 South America Amino Acid Surfactants Sales Breakdown by Application (2021-2026)
- 5.3.5 Middle East and Africa Amino Acid Surfactants Sales Breakdown by Application (2021-2026)
6 Company Profiles
- 6.1 Ajinomoto
- 6.1.1 Ajinomoto Company Information
- 6.1.2 Ajinomoto Business Overview
- 6.1.3 Ajinomoto Amino Acid Surfactants Sales, Revenue and Gross Margin (2021-2026)
- 6.1.4 Ajinomoto Amino Acid Surfactants Product Portfolio
- 6.1.5 Ajinomoto Recent Developments
- 6.2 Clariant
- 6.2.1 Clariant Company Information
- 6.2.2 Clariant Business Overview
- 6.2.3 Clariant Amino Acid Surfactants Sales, Revenue and Gross Margin (2021-2026)
- 6.2.4 Clariant Amino Acid Surfactants Product Portfolio
- 6.2.5 Clariant Recent Developments
- 6.3 Tinci Materials
- 6.3.1 Tinci Materials Company Information
- 6.3.2 Tinci Materials Business Overview
- 6.3.3 Tinci Materials Amino Acid Surfactants Sales, Revenue and Gross Margin (2021-2026)
- 6.3.4 Tinci Materials Amino Acid Surfactants Product Portfolio
- 6.3.5 Tinci Materials Recent Developments
- 6.4 Nanjing Huashi New Material
- 6.4.1 Nanjing Huashi New Material Company Information
- 6.4.2 Nanjing Huashi New Material Business Overview
- 6.4.3 Nanjing Huashi New Material Amino Acid Surfactants Sales, Revenue and Gross Margin (2021-2026)
- 6.4.4 Nanjing Huashi New Material Amino Acid Surfactants Product Portfolio
- 6.4.5 Nanjing Huashi New Material Recent Developments
- 6.5 Croda International
- 6.5.1 Croda International Company Information
- 6.5.2 Croda International Business Overview
- 6.5.3 Croda International Amino Acid Surfactants Sales, Revenue and Gross Margin (2021-2026)
- 6.5.4 Croda International Amino Acid Surfactants Product Portfolio
- 6.5.5 Croda International Recent Developments
- 6.6 Galaxy Surfactants
- 6.6.1 Galaxy Surfactants Company Information
- 6.6.2 Galaxy Surfactants Business Overview
- 6.6.3 Galaxy Surfactants Amino Acid Surfactants Sales, Revenue and Gross Margin (2021-2026)
- 6.6.4 Galaxy Surfactants Amino Acid Surfactants Product Portfolio
- 6.6.5 Galaxy Surfactants Recent Developments
- 6.7 BASF
- 6.7.1 BASF Company Information
- 6.7.2 BASF Business Overview
- 6.7.3 BASF Amino Acid Surfactants Sales, Revenue and Gross Margin (2021-2026)
- 6.7.4 BASF Amino Acid Surfactants Product Portfolio
- 6.7.5 BASF Recent Developments
- 6.8 Miwon Commercial
- 6.8.1 Miwon Commercial Company Information
- 6.8.2 Miwon Commercial Business Overview
- 6.8.3 Miwon Commercial Amino Acid Surfactants Sales, Revenue and Gross Margin (2021-2026)
- 6.8.4 Miwon Commercial Amino Acid Surfactants Product Portfolio
- 6.8.5 Miwon Commercial Recent Developments
- 6.9 Schill+Seilacher
- 6.9.1 Schill+Seilacher Company Information
- 6.9.2 Schill+Seilacher Business Overview
- 6.9.3 Schill+Seilacher Amino Acid Surfactants Sales, Revenue and Gross Margin (2021-2026)
- 6.9.4 Schill+Seilacher Amino Acid Surfactants Product Portfolio
- 6.9.5 Schill+Seilacher Recent Developments
- 6.10 Zschimmer & Schwarz
- 6.10.1 Zschimmer & Schwarz Company Information
- 6.10.2 Zschimmer & Schwarz Business Overview
- 6.10.3 Zschimmer & Schwarz Amino Acid Surfactants Sales, Revenue and Gross Margin (2021-2026)
- 6.10.4 Zschimmer & Schwarz Amino Acid Surfactants Product Portfolio
- 6.10.5 Zschimmer & Schwarz Recent Developments
- 6.11 Innospec
- 6.11.1 Innospec Company Information
- 6.11.2 Innospec Business Overview
- 6.11.3 Innospec Amino Acid Surfactants Sales, Revenue and Gross Margin (2021-2026)
- 6.11.4 Innospec Amino Acid Surfactants Product Portfolio
- 6.11.5 Innospec Recent Developments
- 6.12 Stepan
- 6.12.1 Stepan Company Information
- 6.12.2 Stepan Business Overview
- 6.12.3 Stepan Amino Acid Surfactants Sales, Revenue and Gross Margin (2021-2026)
- 6.12.4 Stepan Amino Acid Surfactants Product Portfolio
- 6.12.5 Stepan Recent Developments
- 6.13 NOF Corporation
- 6.13.1 NOF Corporation Company Information
- 6.13.2 NOF Corporation Business Overview
- 6.13.3 NOF Corporation Amino Acid Surfactants Sales, Revenue and Gross Margin (2021-2026)
- 6.13.4 NOF Corporation Amino Acid Surfactants Product Portfolio
- 6.13.5 NOF Corporation Recent Developments
- 6.14 Changsha Puji Biotechnology
- 6.14.1 Changsha Puji Biotechnology Company Information
- 6.14.2 Changsha Puji Biotechnology Business Overview
- 6.14.3 Changsha Puji Biotechnology Amino Acid Surfactants Sales, Revenue and Gross Margin (2021-2026)
- 6.14.4 Changsha Puji Biotechnology Amino Acid Surfactants Product Portfolio
- 6.14.5 Changsha Puji Biotechnology Recent Developments
- 6.15 Guangzhou Startec Science and Technology
- 6.15.1 Guangzhou Startec Science and Technology Company Information
- 6.15.2 Guangzhou Startec Science and Technology Business Overview
- 6.15.3 Guangzhou Startec Science and Technology Amino Acid Surfactants Sales, Revenue and Gross Margin (2021-2026)
- 6.15.4 Guangzhou Startec Science and Technology Amino Acid Surfactants Product Portfolio
- 6.15.5 Guangzhou Startec Science and Technology Recent Developments
- 6.16 Syensqo
- 6.16.1 Syensqo Company Information
- 6.16.2 Syensqo Business Overview
- 6.16.3 Syensqo Amino Acid Surfactants Sales, Revenue and Gross Margin (2021-2026)
- 6.16.4 Syensqo Amino Acid Surfactants Product Portfolio
- 6.16.5 Syensqo Recent Developments
- 6.17 Sanyo Chemical
- 6.17.1 Sanyo Chemical Company Information
- 6.17.2 Sanyo Chemical Business Overview
- 6.17.3 Sanyo Chemical Amino Acid Surfactants Sales, Revenue and Gross Margin (2021-2026)
- 6.17.4 Sanyo Chemical Amino Acid Surfactants Product Portfolio
- 6.17.5 Sanyo Chemical Recent Developments
- 6.18 Taiwan NJC
- 6.18.1 Taiwan NJC Company Information
- 6.18.2 Taiwan NJC Business Overview
- 6.18.3 Taiwan NJC Amino Acid Surfactants Sales, Revenue and Gross Margin (2021-2026)
- 6.18.4 Taiwan NJC Amino Acid Surfactants Product Portfolio
- 6.18.5 Taiwan NJC Recent Developments
- 6.19 Huzhou Ouli Biological
- 6.19.1 Huzhou Ouli Biological Company Information
- 6.19.2 Huzhou Ouli Biological Business Overview
- 6.19.3 Huzhou Ouli Biological Amino Acid Surfactants Sales, Revenue and Gross Margin (2021-2026)
- 6.19.4 Huzhou Ouli Biological Amino Acid Surfactants Product Portfolio
- 6.19.5 Huzhou Ouli Biological Recent Developments
- 6.20 Hunan Resun
- 6.20.1 Hunan Resun Company Information
- 6.20.2 Hunan Resun Business Overview
- 6.20.3 Hunan Resun Amino Acid Surfactants Sales, Revenue and Gross Margin (2021-2026)
- 6.20.4 Hunan Resun Amino Acid Surfactants Product Portfolio
- 6.20.5 Hunan Resun Recent Developments
- 6.21 Zhangjiagang Great Chemicals
- 6.21.1 Zhangjiagang Great Chemicals Company Information
- 6.21.2 Zhangjiagang Great Chemicals Business Overview
- 6.21.3 Zhangjiagang Great Chemicals Amino Acid Surfactants Sales, Revenue and Gross Margin (2021-2026)
- 6.21.4 Zhangjiagang Great Chemicals Amino Acid Surfactants Product Portfolio
- 6.21.5 Zhangjiagang Great Chemicals Recent Developments
- 6.22 Asahi Kasei Finechem
- 6.22.1 Asahi Kasei Finechem Company Information
- 6.22.2 Asahi Kasei Finechem Business Overview
- 6.22.3 Asahi Kasei Finechem Amino Acid Surfactants Sales, Revenue and Gross Margin (2021-2026)
- 6.22.4 Asahi Kasei Finechem Amino Acid Surfactants Product Portfolio
- 6.22.5 Asahi Kasei Finechem Recent Developments
- 6.23 Berg + Schmidt
- 6.23.1 Berg + Schmidt Company Information
- 6.23.2 Berg + Schmidt Business Overview
- 6.23.3 Berg + Schmidt Amino Acid Surfactants Sales, Revenue and Gross Margin (2021-2026)
- 6.23.4 Berg + Schmidt Amino Acid Surfactants Product Portfolio
- 6.23.5 Berg + Schmidt Recent Developments
7 North America by Country
- 7.1 North America Amino Acid Surfactants Sales by Country
- 7.1.1 North America Amino Acid Surfactants Sales Growth Rate (CAGR) by Country: 2021 VS 2025 VS 2032
- 7.1.2 North America Amino Acid Surfactants Sales by Country (2021-2026)
- 7.1.3 North America Amino Acid Surfactants Sales Forecast by Country (2027-2032)
- 7.2 North America Amino Acid Surfactants Market Size by Country
- 7.2.1 North America Amino Acid Surfactants Market Size Growth Rate (CAGR) by Country: 2021 VS 2025 VS 2032
- 7.2.2 North America Amino Acid Surfactants Market Size by Country (2021-2026)
- 7.2.3 North America Amino Acid Surfactants Market Size Forecast by Country (2027-2032)
8 Europe by Country
- 8.1 Europe Amino Acid Surfactants Sales by Country
- 8.1.1 Europe Amino Acid Surfactants Sales Growth Rate (CAGR) by Country: 2021 VS 2025 VS 2032
- 8.1.2 Europe Amino Acid Surfactants Sales by Country (2021-2026)
- 8.1.3 Europe Amino Acid Surfactants Sales Forecast by Country (2027-2032)
- 8.2 Europe Amino Acid Surfactants Market Size by Country
- 8.2.1 Europe Amino Acid Surfactants Market Size Growth Rate (CAGR) by Country: 2021 VS 2025 VS 2032
- 8.2.2 Europe Amino Acid Surfactants Market Size by Country (2021-2026)
- 8.2.3 Europe Amino Acid Surfactants Market Size Forecast by Country (2027-2032)
9 Asia-Pacific by Country
- 9.1 Asia-Pacific Amino Acid Surfactants Sales by Country
- 9.1.1 Asia-Pacific Amino Acid Surfactants Sales Growth Rate (CAGR) by Country: 2021 VS 2025 VS 2032
- 9.1.2 Asia-Pacific Amino Acid Surfactants Sales by Country (2021-2026)
- 9.1.3 Asia-Pacific Amino Acid Surfactants Sales Forecast by Country (2027-2032)
- 9.2 Asia-Pacific Amino Acid Surfactants Market Size by Country
- 9.2.1 Asia-Pacific Amino Acid Surfactants Market Size Growth Rate (CAGR) by Country: 2021 VS 2025 VS 2032
- 9.2.2 Asia-Pacific Amino Acid Surfactants Market Size by Country (2021-2026)
- 9.2.3 Asia-Pacific Amino Acid Surfactants Market Size Forecast by Country (2027-2032)
10 South America by Country
- 10.1 South America Amino Acid Surfactants Sales by Country
- 10.1.1 South America Amino Acid Surfactants Sales Growth Rate (CAGR) by Country: 2021 VS 2025 VS 2032
- 10.1.2 South America Amino Acid Surfactants Sales by Country (2021-2026)
- 10.1.3 South America Amino Acid Surfactants Sales Forecast by Country (2027-2032)
- 10.2 South America Amino Acid Surfactants Market Size by Country
- 10.2.1 South America Amino Acid Surfactants Market Size Growth Rate (CAGR) by Country: 2021 VS 2025 VS 2032
- 10.2.2 South America Amino Acid Surfactants Market Size by Country (2021-2026)
- 10.2.3 South America Amino Acid Surfactants Market Size Forecast by Country (2027-2032)
11 Middle East and Africa by Country
- 11.1 Middle East and Africa Amino Acid Surfactants Sales by Country
- 11.1.1 Middle East and Africa Amino Acid Surfactants Sales Growth Rate (CAGR) by Country: 2021 VS 2025 VS 2032
- 11.1.2 Middle East and Africa Amino Acid Surfactants Sales by Country (2021-2026)
- 11.1.3 Middle East and Africa Amino Acid Surfactants Sales Forecast by Country (2027-2032)
- 11.2 Middle East and Africa Amino Acid Surfactants Market Size by Country
- 11.2.1 Middle East and Africa Amino Acid Surfactants Market Size Growth Rate (CAGR) by Country: 2021 VS 2025 VS 2032
- 11.2.2 Middle East and Africa Amino Acid Surfactants Market Size by Country (2021-2026)
- 11.2.3 Middle East and Africa Amino Acid Surfactants Market Size Forecast by Country (2027-2032)
12 Value Chain and Sales Channels Analysis
- 12.1 Amino Acid Surfactants Value Chain Analysis
- 12.1.1 Amino Acid Surfactants Key Raw Materials
- 12.1.2 Key Raw Materials Price
- 12.1.3 Raw Materials Key Suppliers
- 12.1.4 Manufacturing Cost Structure
- 12.1.5 Amino Acid Surfactants Production Mode & Process
- 12.2 Amino Acid Surfactants Sales Channels Analysis
- 12.2.1 Direct Comparison with Distribution Share
- 12.2.2 Amino Acid Surfactants Distributors
- 12.2.3 Amino Acid Surfactants Customers
13 Concluding Insights
14 Appendix
- 14.1 Reasons for Doing This Study
- 14.2 Research Methodology
- 14.3 Research Process
- 14.4 Authors List of This Report
- 14.5 Data Source
- 14.5.1 Secondary Sources
- 14.5.2 Primary Sources
- 14.6 Disclaimer
GET THE RESEARCH
Choose your license.
Choose who needs access.
All options are for this report and research series.
PDF by email within 3–5 working days after payment confirmation.
Talk to an analyst