APO RESEARCH · REPORT
Beryllium Copper Alloy
Beryllium copper alloy, commonly written CuBe or BeCu, is a copper-based precipitation-hardening alloy family in which beryllium is the principal strengthening element, typically in the low-single-digit weight-percent range (roughly 0.2 to 2.0 wt% Be depending on grade), sometimes combined with nickel, cobalt, or both to tune conductivity, stress-relaxation resistance, and aging response.
Product & engineering
Understand the product.
Beryllium copper alloy, commonly written CuBe or BeCu, is a copper-based precipitation-hardening alloy family in which beryllium is the principal strengthening element, typically in the low-single-digit weight-percent range (roughly 0.2 to 2.0 wt% Be depending on grade), sometimes combined with nickel, cobalt, or both to tune conductivity, stress-relaxation resistance, and aging response. The defining feature is a deliberately age-hardenable copper matrix: after solution treatment and quenching, controlled aging precipitates Be-rich phases from a supersaturated copper solid solution, producing a property set that is difficult to reach with other copper alloys—high elastic strength and fatigue resistance at useful conductivity, with stable spring force retention and good corrosion performance, plus practical attributes such as non-magnetic behavior and spark-resistant service in many conditions.
Compositionally, CuBe is best understood as two mainstream product families plus related variants. High-strength grades use higher Be content within the commercial range and are optimized for maximum strength, hardness, and spring performance; free-machining variants may include small lead additions to improve chip formation without changing the core precipitation-hardening mechanism. High-conductivity grades use lower Be and often add Ni, Co, or both (Cu Ni Be, Cu Co Be, Cu Co Ni Be families) to raise electrical and thermal conductivity while retaining an elevated strength level relative to most copper alloys, and to improve stress-relaxation behavior in electrical contact and connector duty. In addition to wrought grades, there are casting-oriented CuBe compositions designed for fluidity, feeding, and heat-treatable strength in near-net-shape parts.
Key parameters vary strongly with grade and temper because CuBe is a heat-treatable, cold-work-sensitive system rather than a single fixed material. Electrical conductivity typically spans the broad band from about the low-20s to roughly 60–70% IACS across the family as composition and aging state shift from strength-biased to conductivity-biased products. Peak mechanical properties are reached by combining cold work with age hardening; in that condition, high-strength strip and wire products can reach tensile strength on the order of 1.4–1.6 GPa, with hardness commonly in the high-300s HV and, in heavily cold-worked peak-aged conditions, approaching the low-400s HV. The practical engineering value comes from the combination of elevated yield strength, high elastic limit, and resistance to stress relaxation relative to most copper alloys, while maintaining meaningful electrical and thermal conductivity for current-carrying spring contacts and high-cycle components.
A manufacturing route for wrought CuBe starts with controlled melting and alloying, casting to billet or slab, hot working, and staged cold reduction (rolling or drawing) with intermediate anneals as needed for formability. Final properties are developed by solution annealing to dissolve strengthening constituents, quenching to retain a supersaturated copper matrix, optional cold work to raise dislocation density and elastic strength, and artificial aging (typically in the few-hundred-degree-C range) to precipitate Be-rich phases and lock in the target strength–conductivity balance. Casting routes deliver the alloy as near-net-shape parts by pouring into molds and then applying solution treatment and aging, with machining used mainly for finishing rather than for creating the entire geometry. Across both routes, beryllium chemistry imposes strict control of fumes and dust during melting, hot work, grinding, and machining; this is a process reality of the material family rather than a product “spec.”
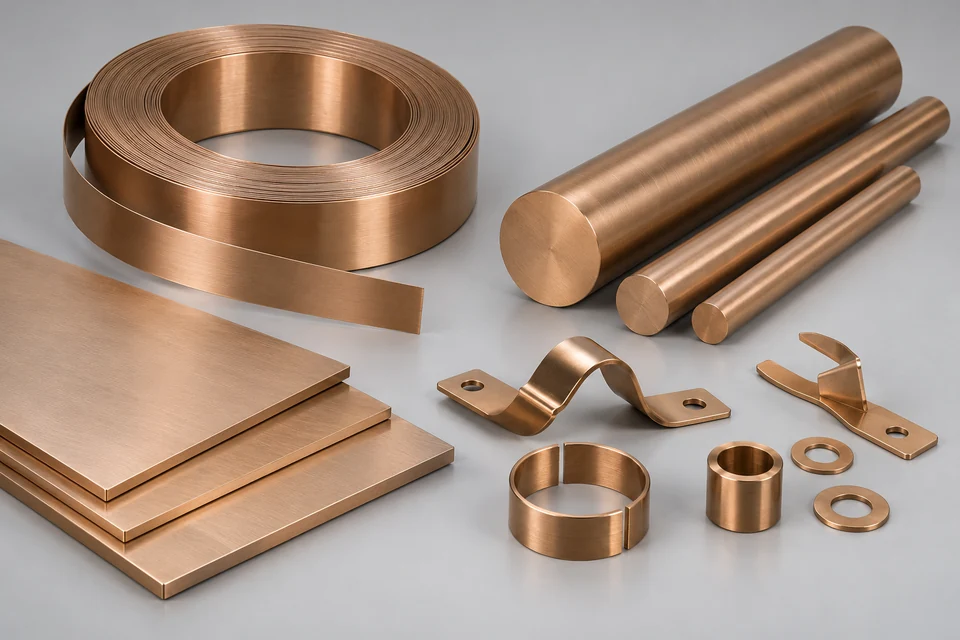
For classification in a non-overlapping “sold-as delivery form” market view, CuBe products are commonly segmented as Strip and Foil; Sheet and Plate; Rod and Bar; Wire; Tube; Forgings; Castings; Extrusions; and Others (reserved narrowly for machined blanks and non-standard cut pieces that cannot be cleanly mapped back to the primary forms). Application segmentation typically concentrates in electronics and telecommunications (connectors, contact springs, relays, switches, and precision current-carrying elastic elements), automotive (electrical connectors, sensor and power interconnects, spring contacts, wear components), aerospace and defense (high-reliability spring and contact elements, bushings, wear and guide parts), industrial equipment (tooling components, non-sparking elements, precision wear parts), energy including oil and gas and nuclear service (non-sparking and corrosion-resistant components, electrical contact and spring elements in harsh environments), and medical devices where compact, repeatable spring performance and corrosion resistance are valued.
Composition, supplied form and processing history determine the usable material. Evaluate the property required by the actual application with the specified test method; a chemistry name alone does not define a finished grade.
What turns activity into demand
Qualified formulation or component output creates material purchases through loading, process yield and the supplied mass basis. Raw material, formulated blend and finished-part revenues describe separate transaction stages.
The commercial boundary
For Beryllium Copper Alloy, distinguish the supplied product from its inputs and the complete application. Report types and applications may overlap; retain the selected edition's product definition, geography, period, unit and transaction basis when comparing estimates.
Which conditions determine usable beryllium copper alloy performance?
Beryllium copper alloy, commonly written CuBe or BeCu, is a copper-based precipitation-hardening alloy family in which beryllium is the principal strengthening element, typically in the low-single-digit weight-percent range (roughly 0.2 to 2.0 wt% Be depending on grade), sometimes combined with nickel, cobalt, or both to tune conductivity, stress-relaxation resistance, and aging response. Match formulation and impurity limits to the converting process, then verify the property after processing or curing. Compare like-for-like dry or as-supplied quantities; a finished component and its raw material represent different transaction stages.
Selected research
Market Structure
Global Beryllium Copper Alloy Market by Size, by Type, by Application, by Region, History and Forecast 2021-2032
Market perspective
Beryllium copper alloy, commonly written CuBe or BeCu, is a copper-based precipitation-hardening alloy family in which beryllium is the principal strengthening element, typically in the low-single-digit weight-percent range (roughly 0.2 to 2.0 wt% Be depending on grade), sometimes combined with nickel, cobalt, or both to tune conductivity, stress-relaxation resistance, and aging response. The defining feature is a deliberately age-hardenable copper matrix: after solution treatment and quenching, controlled aging precipitates Be-rich phases from a supersaturated copper solid solution, producing a property set that is difficult to reach with other copper alloys—high elastic strength and fatigue resistance at useful conductivity, with stable spring force retention and good corrosion performance, plus practical attributes such as non-magnetic behavior and spark-resistant service in many conditions.
Compositionally, CuBe is best understood as two mainstream product families plus related variants. High-strength grades use higher Be content within the commercial range and are optimized for maximum strength, hardness, and spring performance; free-machining variants may include small lead additions to improve chip formation without changing the core precipitation-hardening mechanism. High-conductivity grades use lower Be and often add Ni, Co, or both (Cu Ni Be, Cu Co Be, Cu Co Ni Be families) to raise electrical and thermal conductivity while retaining an elevated strength level relative to most copper alloys, and to improve stress-relaxation behavior in electrical contact and connector duty. In addition to wrought grades, there are casting-oriented CuBe compositions designed for fluidity, feeding, and heat-treatable strength in near-net-shape parts.
Key parameters vary strongly with grade and temper because CuBe is a heat-treatable, cold-work-sensitive system rather than a single fixed material. Electrical conductivity typically spans the broad band from about the low-20s to roughly 60–70% IACS across the family as composition and aging state shift from strength-biased to conductivity-biased products. Peak mechanical properties are reached by combining cold work with age hardening; in that condition, high-strength strip and wire products can reach tensile strength on the order of 1.4–1.6 GPa, with hardness commonly in the high-300s HV and, in heavily cold-worked peak-aged conditions, approaching the low-400s HV. The practical engineering value comes from the combination of elevated yield strength, high elastic limit, and resistance to stress relaxation relative to most copper alloys, while maintaining meaningful electrical and thermal conductivity for current-carrying spring contacts and high-cycle components.
Read the full market overview
A manufacturing route for wrought CuBe starts with controlled melting and alloying, casting to billet or slab, hot working, and staged cold reduction (rolling or drawing) with intermediate anneals as needed for formability. Final properties are developed by solution annealing to dissolve strengthening constituents, quenching to retain a supersaturated copper matrix, optional cold work to raise dislocation density and elastic strength, and artificial aging (typically in the few-hundred-degree-C range) to precipitate Be-rich phases and lock in the target strength–conductivity balance. Casting routes deliver the alloy as near-net-shape parts by pouring into molds and then applying solution treatment and aging, with machining used mainly for finishing rather than for creating the entire geometry. Across both routes, beryllium chemistry imposes strict control of fumes and dust during melting, hot work, grinding, and machining; this is a process reality of the material family rather than a product “spec.”
For classification in a non-overlapping “sold-as delivery form” market view, CuBe products are commonly segmented as Strip and Foil; Sheet and Plate; Rod and Bar; Wire; Tube; Forgings; Castings; Extrusions; and Others (reserved narrowly for machined blanks and non-standard cut pieces that cannot be cleanly mapped back to the primary forms). Application segmentation typically concentrates in electronics and telecommunications (connectors, contact springs, relays, switches, and precision current-carrying elastic elements), automotive (electrical connectors, sensor and power interconnects, spring contacts, wear components), aerospace and defense (high-reliability spring and contact elements, bushings, wear and guide parts), industrial equipment (tooling components, non-sparking elements, precision wear parts), energy including oil and gas and nuclear service (non-sparking and corrosion-resistant components, electrical contact and spring elements in harsh environments), and medical devices where compact, repeatable spring performance and corrosion resistance are valued.
The global beryllium copper alloy market expanded materially in value over 2021-2025 despite a mid-cycle volume correction after the 2022 peak. Market size increased from 783.44 million USD in 2021 to 1,064.96 million USD in 2025, while sales volume rose from 17,509.98 tons to 19,387.34 tons and average price increased from 44.74 thousand USD per ton to 54.93 thousand USD per ton, yielding CAGRs of 7.98% for market size, 2.58% for volume, and 5.26% for price for 2021-2025. The 2023-2025 period confirms that price and product mix became the main support for value, as tonnage softened while pricing remained elevated. The market is expected to re-enter a stronger expansion phase in 2026, with sales recovering to 20,702,86 tons and market size reaching 1,160.71 million USD, and is projected to reach 1,982.69 million USD by 2032, yielding CAGRs of 9.33% for market size, 4.03% for volume, and 5.10% for price for 2026-2032.
Industry structure remains technically concentrated and regionally polarized. In 2025, Materion accounted for about 48.43% of global sales volume, and Materion plus NGK Insulators represented about 64.14%, confirming a top-heavy competitive structure in qualified high-performance grades. North America remained the largest value market in 2025 at 533.87 million USD, equal to about 50.13% of global market size, followed by Europe at 297.02 million USD and China at 104.26 million USD. Regional pricing dispersion remains a core feature of the market, with North America and Europe operating at clear premiums versus China and other lower-priced regions. Looking forward, North America remains the largest absolute value pool, while China is the fastest-growing major region by value, with market size projected to rise to 249.37 million USD by 2032, yielding a 2026-2032 CAGR of 14.00%, indicating a meaningful shift toward higher-value product mix and price realization.
By product form, Strip and Foil remains the commercial backbone of the industry, reaching 366.98 million USD in 2025 and projected to increase to 702.07 million USD by 2032, yielding a 2026-2032 CAGR of 9.81%. Forgings remains the highest-priced major form, while Wires shows the strongest forward growth among the main forms. By application, Electronics and Telecom is the largest demand center, increasing from 311.40 million USD in 2025 to 649.33 million USD by 2032, yielding a 2026-2032 CAGR of 10.98%, while Aerospace remains a high-value segment with persistent pricing premium and strong long-term expansion. Overall, the market outlook supports a premiumization-led growth path in which recovered tonnage, sustained price escalation, and a richer electronics, aerospace, and defense mix drive value creation through 2032.
The report provides an overview of the global Beryllium Copper Alloy market in terms of capacity, output, revenue, and price, analyzing global market trends using historical revenue and sales data for 2021-2025, estimates for 2026, and projected CAGRs through 2032.
The study covers key producers of Beryllium Copper Alloy and consumption patterns in major regions and countries, assesses future market potential, and highlights priority regions and countries for segmenting the market into sub-sectors, with country-specific market value data for the U.S., Canada, Mexico, Brazil, China, Japan, South Korea, Southeast Asia, India, Germany, the U.K., Italy, the Middle East, Africa, and other countries.
The report also presents Beryllium Copper Alloy sales, revenue, market share, and industry ranking for the main manufacturers for 2021-2026, identifies the major stakeholders in the global market, and analyzes their competitive landscape and market positioning based on recent developments and segmental revenues.
In addition, the report analyzes segment data by type and application—covering sales, revenue, and price—for 2021-2032, and evaluates and forecasts the Beryllium Copper Alloy market size, projected growth trends, production technologies, key applications, and end-use industries.
Beryllium Copper Alloy Segment by Company
Materion
NGK Insulators
Wieland Group
Lebronze Alloys
China Minmetals Beryllium
Xinjiang Non-Ferrous Metal Industry
Ampco Metal
IBC Advanced Alloys
Kazatomprom
CNMC Ningxia Orient Group
Suzhou Kaifeng Copper
Beryllium Copper Alloy Segment by Type
Strip & Foil
Rod & Bar
Sheet & Plate
Wires
Tubes
Forgings
Castings
Extrusions
Others
Beryllium Copper Alloy Segment by Application
Electronics and Telecom
Industrial
Aerospace
Automotive
Energy
Defense
Medical
Others
Beryllium Copper Alloy Segment by Region
North America
United States
Canada
Mexico
Europe
Germany
France
U.K.
Italy
Russia
Spain
Netherlands
Switzerland
Sweden
Poland
Asia-Pacific
China
Japan
South Korea
India
Australia
Taiwan
Southeast Asia
South America
Brazil
Argentina
Chile
Colombia
Middle East & Africa
Egypt
South Africa
Israel
Türkiye
GCC Countries
Study Objectives
1. To analyze and research the global status and future forecast, involving, production, value, consumption, growth rate (CAGR), market share, historical and forecast.
2. To present the key manufacturers, capacity, production, revenue, market share, and Recent Developments.
3. To split the breakdown data by regions, type, manufacturers, and Application.
4. To analyze the global and key regions market potential and advantage, opportunity and challenge, restraints, and risks.
5. To identify significant trends, drivers, influence factors in global and regions.
6. To analyze competitive developments such as expansions, agreements, new product launches, and acquisitions in the market.
Reasons to Buy This Report
1. This report will help the readers to understand the competition within the industries and strategies for the competitive environment to enhance the potential profit. The report also focuses on the competitive landscape of the global Beryllium Copper Alloy market, and introduces in detail the market share, industry ranking, competitor ecosystem, market performance, new product development, operation situation, expansion, and acquisition. etc. of the main players, which helps the readers to identify the main competitors and deeply understand the competition pattern of the market.
2. This report will help stakeholders to understand the global industry status and trends of Beryllium Copper Alloy and provides them with information on key market drivers, restraints, challenges, and opportunities.
3. This report will help stakeholders to understand competitors better and gain more insights to strengthen their position in their businesses. The competitive landscape section includes the market share and rank (in volume and value), competitor ecosystem, new product development, expansion, and acquisition.
4. This report stays updated with novel technology integration, features, and the latest developments in the market.
5. This report helps stakeholders to gain insights into which regions to target globally.
6. This report helps stakeholders to gain insights into the end-user perception concerning the adoption of Beryllium Copper Alloy.
7. This report helps stakeholders to identify some of the key players in the market and understand their valuable contribution.
Chapter Outline
Chapter 1: Provides an overview of the Beryllium Copper Alloy market, including product definition, global market growth prospects, production value, capacity, and average price forecasts (2021-2032).
Chapter 2: Analysis key trends, drivers, challenges, and opportunities within the global Beryllium Copper Alloy industry.
Chapter 3: Detailed analysis of Beryllium Copper Alloy market competition landscape. Including Beryllium Copper Alloy manufacturers' output value, output and average price from 2021 to 2026, as well as competition analysis indicators such as origin, product type, application, merger and acquisition information, etc.
Chapter 4: Provides the analysis of various market segments by type, covering the market size and development potential of each market segment, to help readers find the blue ocean market in different market segments.
Chapter 5: Provides the analysis of various market segments by application, covering the market size and development potential of each market segment, to help readers find the blue ocean market in different downstream markets.
Chapter 6: Provides profiles of key players, introducing the basic situation of the main companies in the market in detail, including product production/output, value, price, gross margin, product introduction, recent development, etc.
Chapter 7: Production/Production Value of Beryllium Copper Alloy by region. It provides a quantitative analysis of the market size and development potential of each region in the next six years.
Chapter 8: Consumption of Beryllium Copper Alloy in regional level and country level. It provides a quantitative analysis of the market size and development potential of each region and its main countries and introduces the market development, future development prospects, market space, and production of each country in the world.
Chapter 9: Analysis of industrial chain, including the upstream and downstream of the industry.
Chapter 10: Concluding Insights of the report.
More report detail
Tables and figures
Scope & coverage.
Types
- Strip & Foil
- Rod & Bar
- Sheet & Plate
- Wires
- Tubes
- Forgings
- Castings
- Extrusions
- Others
Applications
- Electronics and Telecom
- Industrial
- Aerospace
- Automotive
- Energy
- Defense
- Medical
- Others
Companies covered
- Materion
- NGK Insulators
- Wieland Group
- Lebronze Alloys
- China Minmetals Beryllium
- Xinjiang Non-Ferrous Metal Industry
- Ampco Metal
- IBC Advanced Alloys
- Kazatomprom
- CNMC Ningxia Orient Group
- Suzhou Kaifeng Copper
Inside the report.
1 Market Overview
- 1.1 Product Definition
- 1.2 Global Market Growth Prospects
- 1.2.1 Global Beryllium Copper Alloy Production Value Estimates and Forecasts (2021-2032)
- 1.2.2 Global Beryllium Copper Alloy Production Capacity Estimates and Forecasts (2021-2032)
- 1.2.3 Global Beryllium Copper Alloy Production Estimates and Forecasts (2021-2032)
- 1.2.4 Global Beryllium Copper Alloy Market Average Price (2021-2032)
- 1.3 Assumptions and Limitations
- 1.4 Study Goals and Objectives
2 Global Beryllium Copper Alloy Market Dynamics
- 2.1 Beryllium Copper Alloy Industry Trends
- 2.2 Beryllium Copper Alloy Industry Drivers
- 2.3 Beryllium Copper Alloy Industry Opportunities and Challenges
- 2.4 Beryllium Copper Alloy Industry Restraints
3 Beryllium Copper Alloy Market by Manufacturers
- 3.1 Global Beryllium Copper Alloy Production Value by Manufacturers (2021-2026)
- 3.2 Global Beryllium Copper Alloy Production by Manufacturers (2021-2026)
- 3.3 Global Beryllium Copper Alloy Average Price by Manufacturers (2021-2026)
- 3.4 Global Beryllium Copper Alloy Industry Manufacturers Ranking, 2024 VS 2025 VS 2026
- 3.5 Global Beryllium Copper Alloy Key Manufacturers Manufacturing Sites & Headquarters
- 3.6 Global Beryllium Copper Alloy Manufacturers, Product Type & Application
- 3.7 Global Beryllium Copper Alloy Manufacturers Established Date
- 3.8 Market Competitive Analysis
- 3.8.1 Global Beryllium Copper Alloy Market CR5 and HHI
- 3.8.2 Global Top 5 and 10 Beryllium Copper Alloy Players Market Share by Production Value in 2025
- 3.8.3 2025 Beryllium Copper Alloy Tier 1, Tier 2, and Tier 3
4 Beryllium Copper Alloy Market by Type
- 4.1 Beryllium Copper Alloy Type Introduction
- 4.1.1 Strip & Foil
- 4.1.2 Rod & Bar
- 4.1.3 Sheet & Plate
- 4.1.4 Wires
- 4.1.5 Tubes
- 4.1.6 Forgings
- 4.1.7 Castings
- 4.1.8 Extrusions
- 4.1.9 Others
- 4.2 Global Beryllium Copper Alloy Production by Type
- 4.2.1 Global Beryllium Copper Alloy Production by Type (2021 VS 2025 VS 2032)
- 4.2.2 Global Beryllium Copper Alloy Production by Type (2021-2032)
- 4.2.3 Global Beryllium Copper Alloy Production Market Share by Type (2021-2032)
- 4.3 Global Beryllium Copper Alloy Production Value by Type
- 4.3.1 Global Beryllium Copper Alloy Production Value by Type (2021 VS 2025 VS 2032)
- 4.3.2 Global Beryllium Copper Alloy Production Value by Type (2021-2032)
- 4.3.3 Global Beryllium Copper Alloy Production Value Market Share by Type (2021-2032)
5 Beryllium Copper Alloy Market by Application
- 5.1 Beryllium Copper Alloy Application Introduction
- 5.1.1 Electronics and Telecom
- 5.1.2 Industrial
- 5.1.3 Aerospace
- 5.1.4 Automotive
- 5.1.5 Energy
- 5.1.6 Defense
- 5.1.7 Medical
- 5.1.8 Others
- 5.2 Global Beryllium Copper Alloy Production by Application
- 5.2.1 Global Beryllium Copper Alloy Production by Application (2021 VS 2025 VS 2032)
- 5.2.2 Global Beryllium Copper Alloy Production by Application (2021-2032)
- 5.2.3 Global Beryllium Copper Alloy Production Market Share by Application (2021-2032)
- 5.3 Global Beryllium Copper Alloy Production Value by Application
- 5.3.1 Global Beryllium Copper Alloy Production Value by Application (2021 VS 2025 VS 2032)
- 5.3.2 Global Beryllium Copper Alloy Production Value by Application (2021-2032)
- 5.3.3 Global Beryllium Copper Alloy Production Value Market Share by Application (2021-2032)
6 Company Profiles
- 6.1 Materion
- 6.1.1 Materion Company Information
- 6.1.2 Materion Business Overview
- 6.1.3 Materion Beryllium Copper Alloy Production, Value and Gross Margin (2021-2026)
- 6.1.4 Materion Beryllium Copper Alloy Product Portfolio
- 6.1.5 Materion Recent Developments
- 6.2 NGK Insulators
- 6.2.1 NGK Insulators Company Information
- 6.2.2 NGK Insulators Business Overview
- 6.2.3 NGK Insulators Beryllium Copper Alloy Production, Value and Gross Margin (2021-2026)
- 6.2.4 NGK Insulators Beryllium Copper Alloy Product Portfolio
- 6.2.5 NGK Insulators Recent Developments
- 6.3 Wieland Group
- 6.3.1 Wieland Group Company Information
- 6.3.2 Wieland Group Business Overview
- 6.3.3 Wieland Group Beryllium Copper Alloy Production, Value and Gross Margin (2021-2026)
- 6.3.4 Wieland Group Beryllium Copper Alloy Product Portfolio
- 6.3.5 Wieland Group Recent Developments
- 6.4 Lebronze Alloys
- 6.4.1 Lebronze Alloys Company Information
- 6.4.2 Lebronze Alloys Business Overview
- 6.4.3 Lebronze Alloys Beryllium Copper Alloy Production, Value and Gross Margin (2021-2026)
- 6.4.4 Lebronze Alloys Beryllium Copper Alloy Product Portfolio
- 6.4.5 Lebronze Alloys Recent Developments
- 6.5 China Minmetals Beryllium
- 6.5.1 China Minmetals Beryllium Company Information
- 6.5.2 China Minmetals Beryllium Business Overview
- 6.5.3 China Minmetals Beryllium Beryllium Copper Alloy Production, Value and Gross Margin (2021-2026)
- 6.5.4 China Minmetals Beryllium Beryllium Copper Alloy Product Portfolio
- 6.5.5 China Minmetals Beryllium Recent Developments
- 6.6 Xinjiang Non-Ferrous Metal Industry
- 6.6.1 Xinjiang Non-Ferrous Metal Industry Company Information
- 6.6.2 Xinjiang Non-Ferrous Metal Industry Business Overview
- 6.6.3 Xinjiang Non-Ferrous Metal Industry Beryllium Copper Alloy Production, Value and Gross Margin (2021-2026)
- 6.6.4 Xinjiang Non-Ferrous Metal Industry Beryllium Copper Alloy Product Portfolio
- 6.6.5 Xinjiang Non-Ferrous Metal Industry Recent Developments
- 6.7 Ampco Metal
- 6.7.1 Ampco Metal Company Information
- 6.7.2 Ampco Metal Business Overview
- 6.7.3 Ampco Metal Beryllium Copper Alloy Production, Value and Gross Margin (2021-2026)
- 6.7.4 Ampco Metal Beryllium Copper Alloy Product Portfolio
- 6.7.5 Ampco Metal Recent Developments
- 6.8 IBC Advanced Alloys
- 6.8.1 IBC Advanced Alloys Company Information
- 6.8.2 IBC Advanced Alloys Business Overview
- 6.8.3 IBC Advanced Alloys Beryllium Copper Alloy Production, Value and Gross Margin (2021-2026)
- 6.8.4 IBC Advanced Alloys Beryllium Copper Alloy Product Portfolio
- 6.8.5 IBC Advanced Alloys Recent Developments
- 6.9 Kazatomprom
- 6.9.1 Kazatomprom Company Information
- 6.9.2 Kazatomprom Business Overview
- 6.9.3 Kazatomprom Beryllium Copper Alloy Production, Value and Gross Margin (2021-2026)
- 6.9.4 Kazatomprom Beryllium Copper Alloy Product Portfolio
- 6.9.5 Kazatomprom Recent Developments
- 6.10 CNMC Ningxia Orient Group
- 6.10.1 CNMC Ningxia Orient Group Company Information
- 6.10.2 CNMC Ningxia Orient Group Business Overview
- 6.10.3 CNMC Ningxia Orient Group Beryllium Copper Alloy Production, Value and Gross Margin (2021-2026)
- 6.10.4 CNMC Ningxia Orient Group Beryllium Copper Alloy Product Portfolio
- 6.10.5 CNMC Ningxia Orient Group Recent Developments
- 6.11 Suzhou Kaifeng Copper
- 6.11.1 Suzhou Kaifeng Copper Company Information
- 6.11.2 Suzhou Kaifeng Copper Business Overview
- 6.11.3 Suzhou Kaifeng Copper Beryllium Copper Alloy Production, Value and Gross Margin (2021-2026)
- 6.11.4 Suzhou Kaifeng Copper Beryllium Copper Alloy Product Portfolio
- 6.11.5 Suzhou Kaifeng Copper Recent Developments
7 Global Beryllium Copper Alloy Production by Region
- 7.1 Global Beryllium Copper Alloy Production by Region: 2021 VS 2025 VS 2032
- 7.2 Global Beryllium Copper Alloy Production by Region (2021-2032)
- 7.2.1 Global Beryllium Copper Alloy Production by Region (2021-2026)
- 7.2.2 Global Beryllium Copper Alloy Production Forecast by Region (2027-2032)
- 7.3 Global Beryllium Copper Alloy Production by Region: 2021 VS 2025 VS 2032
- 7.4 Global Beryllium Copper Alloy Production Value by Region (2021-2032)
- 7.4.1 Global Beryllium Copper Alloy Production Value by Region (2021-2026)
- 7.4.2 Global Beryllium Copper Alloy Production Value by Region (2027-2032)
- 7.5 Global Beryllium Copper Alloy Market Price Analysis by Region (2021-2032)
- 7.6 Regional Production Value Trends (2021-2032)
- 7.6.1 North America Beryllium Copper Alloy Production Value (2021-2032)
- 7.6.2 Europe Beryllium Copper Alloy Production Value (2021-2032)
- 7.6.3 Asia-Pacific Beryllium Copper Alloy Production Value (2021-2032)
- 7.6.4 South America Beryllium Copper Alloy Production Value (2021-2032)
- 7.6.5 Middle East & Africa Beryllium Copper Alloy Production Value (2021-2032)
8 Global Beryllium Copper Alloy Consumption by Region
- 8.1 Global Beryllium Copper Alloy Consumption by Region: 2021 VS 2025 VS 2032
- 8.2 Global Beryllium Copper Alloy Consumption by Region (2021-2032)
- 8.2.1 Global Beryllium Copper Alloy Consumption by Region (2021-2026)
- 8.2.2 Global Beryllium Copper Alloy Consumption by Region (2027-2032)
- 8.3 North America
- 8.3.1 North America Beryllium Copper Alloy Consumption Growth Rate by Country: 2021 VS 2025 VS 2032
- 8.3.2 North America Beryllium Copper Alloy Consumption by Country (2021-2032)
- 8.3.3 U.S.
- 8.3.4 Canada
- 8.3.5 Mexico
- 8.4 Europe
- 8.4.1 Europe Beryllium Copper Alloy Consumption Growth Rate by Country: 2021 VS 2025 VS 2032
- 8.4.2 Europe Beryllium Copper Alloy Consumption by Country (2021-2032)
- 8.4.3 Germany
- 8.4.4 France
- 8.4.5 U.K.
- 8.4.6 Italy
- 8.4.7 Netherlands
- 8.5 Asia Pacific
- 8.5.1 Asia Pacific Beryllium Copper Alloy Consumption Growth Rate by Country: 2021 VS 2025 VS 2032
- 8.5.2 Asia Pacific Beryllium Copper Alloy Consumption by Country (2021-2032)
- 8.5.3 China
- 8.5.4 Japan
- 8.5.5 South Korea
- 8.5.6 Southeast Asia
- 8.5.7 India
- 8.5.8 Australia
- 8.6 South America
- 8.6.1 South America Beryllium Copper Alloy Consumption Growth Rate by Country: 2021 VS 2025 VS 2032
- 8.6.2 South America Beryllium Copper Alloy Consumption by Country (2021-2032)
- 8.6.3 Brazil
- 8.6.4 Argentina
- 8.6.5 Chile
- 8.6.6 Colombia
- 8.7 Middle East & Africa
- 8.7.1 Middle East & Africa Beryllium Copper Alloy Consumption Growth Rate by Country: 2021 VS 2025 VS 2032
- 8.7.2 Middle East & Africa Beryllium Copper Alloy Consumption by Country (2021-2032)
- 8.7.3 Egypt
- 8.7.4 South Africa
- 8.7.5 Israel
- 8.7.6 Türkiye
- 8.7.7 GCC Countries
9 Value Chain and Sales Channels Analysis
- 9.1 Beryllium Copper Alloy Value Chain Analysis
- 9.1.1 Beryllium Copper Alloy Key Raw Materials
- 9.1.2 Raw Materials Key Suppliers
- 9.1.3 Manufacturing Cost Structure
- 9.1.4 Beryllium Copper Alloy Production Mode & Process
- 9.2 Beryllium Copper Alloy Sales Channels Analysis
- 9.2.1 Direct Comparison with Distribution Share
- 9.2.2 Beryllium Copper Alloy Distributors
- 9.2.3 Beryllium Copper Alloy Customers
10 Concluding Insights
11 Appendix
- 11.1 Reasons for Doing This Study
- 11.2 Research Methodology
- 11.3 Research Process
- 11.4 Authors List of This Report
- 11.5 Data Source
- 11.5.1 Secondary Sources
- 11.5.2 Primary Sources
- 11.6 Disclaimer
GET THE RESEARCH
Choose your license.
Choose who needs access.
All options are for this report and research series.
PDF by email within 3–5 working days after payment confirmation.
Talk to an analyst