APO RESEARCH · REPORT
Propolis
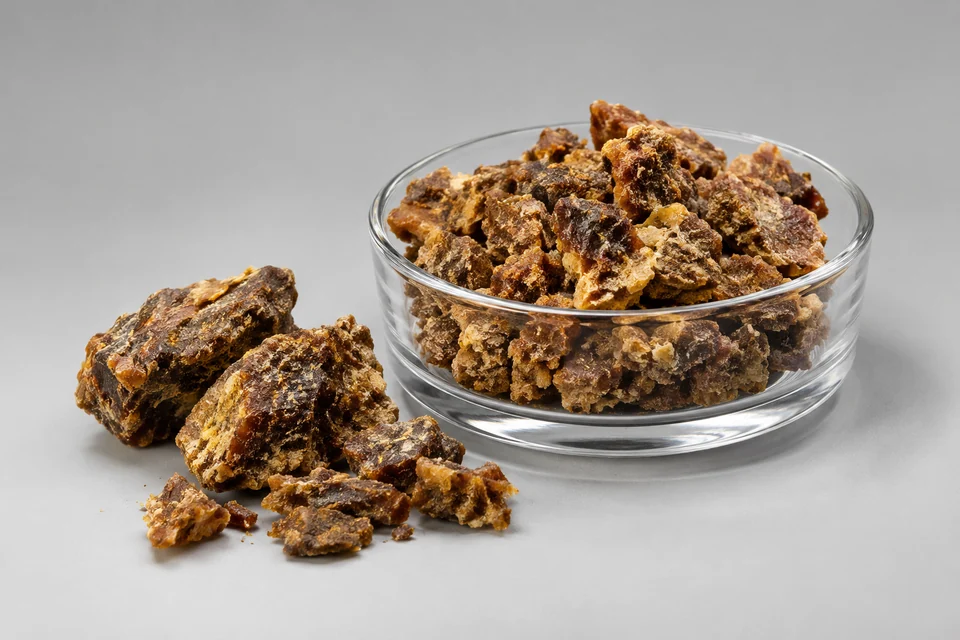
Propolis is a resinous material produced by honey bees from plant exudates collected from buds, bark, stems, leaves and wounded tissues. Worker bees transport these resins to the hive and combine them with salivary secretions, enzymes, beeswax and minor quantities of pollen, forming an adhesive material used to seal cracks, reinforce internal surfaces, narrow hive openings and coat exposed cavities.
Product & engineering
Understand the product.
Propolis is a resinous material produced by honey bees from plant exudates collected from buds, bark, stems, leaves and wounded tissues. Worker bees transport these resins to the hive and combine them with salivary secretions, enzymes, beeswax and minor quantities of pollen, forming an adhesive material used to seal cracks, reinforce internal surfaces, narrow hive openings and coat exposed cavities. Raw propolis retains the chemical imprint of its plant source and the biological modification introduced by the colony. Its composition therefore varies with vegetation, climate, season, bee population and local ecology, with plant resins and balsamic substances forming the principal fraction and waxes, aromatic compounds, pollen and other natural hive materials forming the remaining matrix.
The commercial character of propolis is determined at the apiary level. Resin producing vegetation must occur within the normal foraging range of active colonies, while temperature, rainfall, humidity, soil conditions, altitude and seasonal plant growth determine resin availability and collection periods. Warm conditions generally soften plant resins and increase bee collection activity. Prolonged rainfall reduces foraging time, and extended dry periods can alter resin secretion and vegetation density. Colony genetics also affect collection behavior. Africanized honey bees used across much of Brazil display strong defensive and resin gathering behavior, while European lineages account for a large share of production in temperate regions. Hive design, colony strength, grid configuration and harvest frequency influence output, yet the underlying botanical environment remains the primary determinant of propolis identity.
Temperate propolis is widely associated with poplar species across Europe, North America and parts of Asia. Poplar buds supply flavonoids, phenolic acids and aromatic esters that define the most common European chemical profile. Birch, alder, willow, conifer and other regional plants contribute additional local types. Tropical production reflects a wider botanical base and produces chemically distinct materials that cannot be classified by color alone. Brazilian green propolis, Brazilian red propolis, Mediterranean propolis, birch propolis, Pacific propolis and poplar type propolis represent the principal commercially recognized groups, each associated with a defined vegetation zone and a characteristic set of plant compounds.
Brazilian green propolis is the most internationally recognized tropical type and one of the most important products in the global propolis trade. Its principal botanical source is Baccharis dracunculifolia, a native shrub commonly known in Brazil as alecrim do campo. The young shoots and leaf surfaces of this plant provide the resin collected by bees. The resulting propolis contains prenylated phenylpropanoids, including artepillin C, which has become the principal chemical marker used in the commercial identification of green propolis. The combination of a traceable plant source, a recognizable chemical profile, established extraction technology and long standing export demand has given green propolis a distinct position in finished supplements, liquid extracts and oral sprays.
Minas Gerais is the central commercial region for Brazilian green propolis. Production is concentrated in inland areas where Baccharis dracunculifolia occurs naturally across grassland, pasture margins and disturbed vegetation. The state combines warm seasonal conditions, elevated interior terrain, extensive rural land, established beekeeping activity and access to Africanized honey bee colonies. These conditions support repeated resin collection over commercially useful periods and allow apiaries to operate near dense stands of the source plant. São Paulo, Paraná and adjacent southeastern areas also contribute green propolis, while Minas Gerais remains the region most closely associated with its international identity and export supply.
Brazilian red propolis originates principally from coastal and mangrove environments in northeastern Brazil, especially areas where Dalbergia ecastophyllum grows. Its red color and chemical profile derive from isoflavonoids and related plant compounds transferred from the resin source. Red propolis occupies a smaller commercial base and commands interest in specialized extracts and premium formulations. Brown propolis is produced across broader areas of Brazil from multiple botanical sources and accounts for a substantial part of general raw propolis supply. Its composition varies more widely by region and season. Green, red and brown classifications therefore describe botanical and chemical origin, with commercial value determined by extract yield, chemical identity, supply consistency and downstream demand.
Propolis is harvested from hive surfaces by scraping or from removable plastic collection grids installed inside the hive. Grid collection creates narrow spaces that bees fill with resin and produces cleaner, more uniform raw material after cooling and mechanical release. Scraped propolis contains a larger proportion of wax, wood particles and aged hive material and requires more extensive sorting. Harvested material is cooled, broken and consolidated by origin and season before sale to processors. Beekeepers, cooperatives and specialized collectors supply domestic extraction companies and international buyers, with Brazil, China, New Zealand, Turkey and several European countries forming important production and processing bases.
Industrial extraction converts raw propolis into a form suitable for formulation. The raw material is milled and contacted with ethanol, water, glycerol, propylene glycol or another approved extraction medium. Ethanol remains the principal commercial solvent because it dissolves a broad fraction of phenolic and aromatic resin compounds. The liquid extract is separated from insoluble solids, cooled to precipitate wax, filtered and concentrated under reduced pressure. The resulting material may remain as a liquid extract, proceed to a viscous concentrate or be converted into a dry powder. Water soluble and alcohol free systems use modified extraction and dispersion methods to maintain active resin fractions in liquid form. Dry extracts are commonly blended with carriers to improve flow, dispersion and incorporation into capsules, tablets, sachets and other solid products.
Finished propolis products are manufactured as capsules, liquid drops, tinctures, oral sprays, throat sprays, tablets, lozenges, syrups, gummies, drinkable vials and mixed bee product formulations. Capsules use dry or concentrated extracts and provide a fixed oral dose. Liquids preserve the extract in ethanol, glycerol, water based or mixed solvent systems and allow flexible dosing. Sprays deliver diluted extract directly to the mouth or throat and require stable dispersion through the pump system. Tablets and lozenges combine propolis with sweeteners, binders, flavoring agents and complementary botanical ingredients. Product value is determined by the quantity and concentration of extract, botanical origin, extraction ratio, formulation type, package format and brand distribution.
The industry links dispersed apiary production with increasingly concentrated extraction and finished product manufacturing. Raw propolis production remains dependent on local vegetation and colony management, while extraction requires dedicated vessels, solvent handling, filtration, concentration and drying equipment. Finished product manufacturing adds formulation, encapsulation, liquid filling, spray packaging and retail distribution. Brazil supplies a significant share of internationally traded green and red propolis. China combines large domestic beekeeping output with extensive capsule and health product manufacturing. New Zealand participates through branded bee product companies with integrated sourcing and consumer distribution. Japan and South Korea remain important premium consumption and product development markets, particularly for Brazilian green propolis. Turkey has expanded through contract beekeeping, domestic extraction and branded supplements, while European manufacturers maintain strong positions in liquid extracts, sprays, lozenges and pharmacy oriented products.
Commercial demand is concentrated in oral supplements and upper respiratory care formats. Capsules and liquid extracts account for the broadest daily use, while sprays and lozenges occupy the mouth and throat segment. Online retail has expanded access to specialist brands and imported products, while pharmacies, drugstores, health stores, supermarkets and direct sales networks remain important for established consumer brands. Brand ownership and physical manufacturing are frequently separated. Large supplement companies may purchase standardized extracts and use contract manufacturers, while specialist propolis companies may control apiary sourcing, extraction, formulation and finished product sales within one operating group.
The supplied food or ingredient must be defined by composition, processing and storage form. Product labels such as natural, reduced sugar or high protein do not by themselves establish a uniform formulation, nutritional result or market boundary.
What turns activity into demand
Accepted recipes and sold servings create ingredient or finished-food purchases through inclusion, yield and storage loss. Ingredient mass, finished-product sales and food-service revenue are different measurement bases.
The commercial boundary
For Propolis, distinguish the supplied product from its inputs and the complete application. Report types and applications may overlap; retain the selected edition's product definition, geography, period, unit and transaction basis when comparing estimates.
What defines the supplied propolis offering?
Propolis is a resinous material produced by honey bees from plant exudates collected from buds, bark, stems, leaves and wounded tissues. Worker bees transport these resins to the hive and combine them with salivary secretions, enzymes, beeswax and minor quantities of pollen, forming an adhesive material used to seal cracks, reinforce internal surfaces, narrow hive openings and coat exposed cavities. Compare moisture or solids, ingredient content, packaging and shelf-life conditions on the same basis. Separate ingredient deliveries from finished-food sales and retain the relevant manufacturing yield; retail value cannot substitute for ingredient volume.
Selected research
Market Outlook & Growth Opportunities
Global Propolis Market Outlook and Growth Opportunities 2026
Market perspective
Propolis is a resinous material produced by honey bees from plant exudates collected from buds, bark, stems, leaves and wounded tissues. Worker bees transport these resins to the hive and combine them with salivary secretions, enzymes, beeswax and minor quantities of pollen, forming an adhesive material used to seal cracks, reinforce internal surfaces, narrow hive openings and coat exposed cavities. Raw propolis retains the chemical imprint of its plant source and the biological modification introduced by the colony. Its composition therefore varies with vegetation, climate, season, bee population and local ecology, with plant resins and balsamic substances forming the principal fraction and waxes, aromatic compounds, pollen and other natural hive materials forming the remaining matrix.
The commercial character of propolis is determined at the apiary level. Resin producing vegetation must occur within the normal foraging range of active colonies, while temperature, rainfall, humidity, soil conditions, altitude and seasonal plant growth determine resin availability and collection periods. Warm conditions generally soften plant resins and increase bee collection activity. Prolonged rainfall reduces foraging time, and extended dry periods can alter resin secretion and vegetation density. Colony genetics also affect collection behavior. Africanized honey bees used across much of Brazil display strong defensive and resin gathering behavior, while European lineages account for a large share of production in temperate regions. Hive design, colony strength, grid configuration and harvest frequency influence output, yet the underlying botanical environment remains the primary determinant of propolis identity.
Temperate propolis is widely associated with poplar species across Europe, North America and parts of Asia. Poplar buds supply flavonoids, phenolic acids and aromatic esters that define the most common European chemical profile. Birch, alder, willow, conifer and other regional plants contribute additional local types. Tropical production reflects a wider botanical base and produces chemically distinct materials that cannot be classified by color alone. Brazilian green propolis, Brazilian red propolis, Mediterranean propolis, birch propolis, Pacific propolis and poplar type propolis represent the principal commercially recognized groups, each associated with a defined vegetation zone and a characteristic set of plant compounds.
Read the full market overview
Brazilian green propolis is the most internationally recognized tropical type and one of the most important products in the global propolis trade. Its principal botanical source is Baccharis dracunculifolia, a native shrub commonly known in Brazil as alecrim do campo. The young shoots and leaf surfaces of this plant provide the resin collected by bees. The resulting propolis contains prenylated phenylpropanoids, including artepillin C, which has become the principal chemical marker used in the commercial identification of green propolis. The combination of a traceable plant source, a recognizable chemical profile, established extraction technology and long standing export demand has given green propolis a distinct position in finished supplements, liquid extracts and oral sprays.
Minas Gerais is the central commercial region for Brazilian green propolis. Production is concentrated in inland areas where Baccharis dracunculifolia occurs naturally across grassland, pasture margins and disturbed vegetation. The state combines warm seasonal conditions, elevated interior terrain, extensive rural land, established beekeeping activity and access to Africanized honey bee colonies. These conditions support repeated resin collection over commercially useful periods and allow apiaries to operate near dense stands of the source plant. São Paulo, Paraná and adjacent southeastern areas also contribute green propolis, while Minas Gerais remains the region most closely associated with its international identity and export supply.
Brazilian red propolis originates principally from coastal and mangrove environments in northeastern Brazil, especially areas where Dalbergia ecastophyllum grows. Its red color and chemical profile derive from isoflavonoids and related plant compounds transferred from the resin source. Red propolis occupies a smaller commercial base and commands interest in specialized extracts and premium formulations. Brown propolis is produced across broader areas of Brazil from multiple botanical sources and accounts for a substantial part of general raw propolis supply. Its composition varies more widely by region and season. Green, red and brown classifications therefore describe botanical and chemical origin, with commercial value determined by extract yield, chemical identity, supply consistency and downstream demand.
Propolis is harvested from hive surfaces by scraping or from removable plastic collection grids installed inside the hive. Grid collection creates narrow spaces that bees fill with resin and produces cleaner, more uniform raw material after cooling and mechanical release. Scraped propolis contains a larger proportion of wax, wood particles and aged hive material and requires more extensive sorting. Harvested material is cooled, broken and consolidated by origin and season before sale to processors. Beekeepers, cooperatives and specialized collectors supply domestic extraction companies and international buyers, with Brazil, China, New Zealand, Turkey and several European countries forming important production and processing bases.
Industrial extraction converts raw propolis into a form suitable for formulation. The raw material is milled and contacted with ethanol, water, glycerol, propylene glycol or another approved extraction medium. Ethanol remains the principal commercial solvent because it dissolves a broad fraction of phenolic and aromatic resin compounds. The liquid extract is separated from insoluble solids, cooled to precipitate wax, filtered and concentrated under reduced pressure. The resulting material may remain as a liquid extract, proceed to a viscous concentrate or be converted into a dry powder. Water soluble and alcohol free systems use modified extraction and dispersion methods to maintain active resin fractions in liquid form. Dry extracts are commonly blended with carriers to improve flow, dispersion and incorporation into capsules, tablets, sachets and other solid products.
Finished propolis products are manufactured as capsules, liquid drops, tinctures, oral sprays, throat sprays, tablets, lozenges, syrups, gummies, drinkable vials and mixed bee product formulations. Capsules use dry or concentrated extracts and provide a fixed oral dose. Liquids preserve the extract in ethanol, glycerol, water based or mixed solvent systems and allow flexible dosing. Sprays deliver diluted extract directly to the mouth or throat and require stable dispersion through the pump system. Tablets and lozenges combine propolis with sweeteners, binders, flavoring agents and complementary botanical ingredients. Product value is determined by the quantity and concentration of extract, botanical origin, extraction ratio, formulation type, package format and brand distribution.
The industry links dispersed apiary production with increasingly concentrated extraction and finished product manufacturing. Raw propolis production remains dependent on local vegetation and colony management, while extraction requires dedicated vessels, solvent handling, filtration, concentration and drying equipment. Finished product manufacturing adds formulation, encapsulation, liquid filling, spray packaging and retail distribution. Brazil supplies a significant share of internationally traded green and red propolis. China combines large domestic beekeeping output with extensive capsule and health product manufacturing. New Zealand participates through branded bee product companies with integrated sourcing and consumer distribution. Japan and South Korea remain important premium consumption and product development markets, particularly for Brazilian green propolis. Turkey has expanded through contract beekeeping, domestic extraction and branded supplements, while European manufacturers maintain strong positions in liquid extracts, sprays, lozenges and pharmacy oriented products.
Commercial demand is concentrated in oral supplements and upper respiratory care formats. Capsules and liquid extracts account for the broadest daily use, while sprays and lozenges occupy the mouth and throat segment. Online retail has expanded access to specialist brands and imported products, while pharmacies, drugstores, health stores, supermarkets and direct sales networks remain important for established consumer brands. Brand ownership and physical manufacturing are frequently separated. Large supplement companies may purchase standardized extracts and use contract manufacturers, while specialist propolis companies may control apiary sourcing, extraction, formulation and finished product sales within one operating group.
The global Propolis market was valued at US$ million in 2026 and is projected to reach US$ million by 2032, implying a compound annual growth rate (CAGR) of % over 2026-2032.
The North America market for Propolis is projected to increase from US$ million in 2026 to US$ million by 2032, at a CAGR of % over 2026-2032.
The Europe market for Propolis is projected to increase from US$ million in 2026 to US$ million by 2032, at a CAGR of % over 2026-2032.
The Asia Pacific market for Propolis is projected to increase from US$ million in 2026 to US$ million by 2032, at a CAGR of % over 2026-2032.
In China, the Propolis market is projected to increase from US$ million in 2026 to US$ million by 2032, at a CAGR of % over 2026-2032.
Major global companies in the Propolis market include Apis Flora, Comvita, MN Própolis, Manuka Health New Zealand, Zhifengtang, Wang's Bee Garden, Baihua, Jiangshan Hengliang and Nature's Answer, among others. In 2025, the top three vendors together accounted for approximately % of global revenue.
This report provides an overview of the global Propolis market in terms of sales, revenue, and price, analyzing global market trends using historical revenue and sales data for 2021-2025, estimates for 2026, and projected CAGRs through 2032.
The study covers key producers of Propolis and sales in major regions and countries, assesses future market potential, and highlights priority regions and countries for segmenting the market into sub-sectors, with country-specific market value data for the U.S., Canada, Mexico, Brazil, China, Japan, South Korea, Southeast Asia, India, Germany, the U.K., Italy, the Middle East, Africa, and other countries.
The report also presents Propolis sales, revenue, market share, and industry ranking for the main manufacturers for 2021-2026, identifies the major stakeholders in the global market, and analyzes their competitive landscape and market positioning based on recent developments and segmental revenues.
In addition, the report analyzes segment data by Type and Application—covering sales, revenue, and price—for 2021-2032, and evaluates and forecasts the Propolis market size, projected growth trends, production technologies, key applications, and end-use industries.
Propolis Segment by Company
Apis Flora
Comvita
MN Própolis
Manuka Health New Zealand
Zhifengtang
Wang's Bee Garden
Baihua
Jiangshan Hengliang
Nature's Answer
Jiangsu J.D.Y Biotechnology
BEE’O Propolis
Bee Health
Martínez Nieto S.A.
Seoul Propolis
Uniflora
Baoshengyuan
Nature's Care Manufacture
Apis Familia
Homart Pharmaceuticals
Wax Green
Apiário Polenectar
King’s Gel
Sunyata Pon Lee
Yamada Bee Farm Corporation
Propolis Segment by Type
Propolis Capsules
Propolis Liquids
Propolis Sprays
Other Propolis Products
Propolis Segment by Sales Channel
Online Retail
Offline Retail
Propolis Segment by Region
North America
United States
Canada
Mexico
Europe
Germany
France
U.K.
Italy
Russia
Spain
Netherlands
Switzerland
Sweden
Poland
Asia-Pacific
China
Japan
South Korea
India
Australia
Taiwan
Southeast Asia
South America
Brazil
Argentina
Chile
Colombia
Middle East & Africa
Egypt
South Africa
Israel
Türkiye
GCC Countries
Study Objectives
1. To analyze and research the global Propolis status and future forecast, involving, sales, revenue, growth rate (CAGR), market share, historical and forecast.
2. To present the key manufacturers, sales, revenue, market share, and Recent Developments.
3. To split the breakdown data by regions, type, manufacturers, and Application.
4. To analyze the global and key regions Propolis market potential and advantage, opportunity and challenge, restraints, and risks.
5. To identify Propolis significant trends, drivers, influence factors in global and regions.
6. To analyze Propolis competitive developments such as expansions, agreements, new product launches, and acquisitions in the market.
Reasons to Buy This Report
1. This report will help the readers to understand the competition within the industries and strategies for the competitive environment to enhance the potential profit. The report also focuses on the competitive landscape of the global Propolis market, and introduces in detail the market share, industry ranking, competitor ecosystem, market performance, new product development, operation situation, expansion, and acquisition. etc. of the main players, which helps the readers to identify the main competitors and deeply understand the competition pattern of the market.
2. This report will help stakeholders to understand the global industry status and trends of Propolis and provides them with information on key market drivers, restraints, challenges, and opportunities.
3. This report will help stakeholders to understand competitors better and gain more insights to strengthen their position in their businesses. The competitive landscape section includes the market share and rank (in sales and value), competitor ecosystem, new product development, expansion, and acquisition.
4. This report stays updated with novel technology integration, features, and the latest developments in the market.
5. This report helps stakeholders to gain insights into which regions to target globally.
6. This report helps stakeholders to gain insights into the end-user perception concerning the adoption of Propolis.
7. This report helps stakeholders to identify some of the key players in the market and understand their valuable contribution.
Chapter Outline
Chapter 1: Provides an overview of the Propolis market, including product definition, global market growth prospects, sales value, sales volume, and average price forecasts (2021-2032).
Chapter 2: Analysis key trends, drivers, challenges, and opportunities within the global Propolis industry.
Chapter 3: Detailed analysis of Propolis manufacturers competitive landscape, price, sales and revenue market share, latest development plan, merger, and acquisition information, etc.
Chapter 4: Provides the analysis of various market segments by type, covering the market size and development potential of each market segment, to help readers find the blue ocean market in different market segments.
Chapter 5: Provides the analysis of various market segments by application, covering the market size and development potential of each market segment, to help readers find the blue ocean market in different downstream markets.
Chapter 6: Sales and value of Propolis in regional level. It provides a quantitative analysis of the market size and development potential of each region and introduces the market development, future development prospects, market space, and market size of each country in the world.
Chapter 7: Sales and value of Propolis in country level. It provides sigmate data by type, and by application for each country/region.
Chapter 8: Provides profiles of key players, introducing the basic situation of the main companies in the market in detail, including product sales, revenue, price, gross margin, product introduction, recent development, etc.
Chapter 9: Analysis of industrial chain, including the upstream and downstream of the industry.
Chapter 10: Concluding Insights.
More report detail
Tables and figures
Scope & coverage.
Types
- Propolis Capsules
- Propolis Liquids
- Propolis Sprays
- Other Propolis Products
Applications
- Online Retail
- Offline Retail
Companies covered
- Apis Flora
- Comvita
- MN Própolis
- Manuka Health New Zealand
- Zhifengtang
- Wang's Bee Garden
- Baihua
- Jiangshan Hengliang
- Nature's Answer
- Jiangsu J.D.Y Biotechnology
- BEE’O Propolis
- Bee Health
- Martínez Nieto S.A.
- Seoul Propolis
- Uniflora
- Baoshengyuan
- Nature's Care Manufacture
- Apis Familia
- Homart Pharmaceuticals
- Wax Green
- Apiário Polenectar
- King’s Gel
- Sunyata Pon Lee
- Yamada Bee Farm Corporation
Inside the report.
1 Market Overview
- 1.1 Product Definition
- 1.2 Global Market Growth Prospects
- 1.2.1 Global Propolis Sales Value (2021-2032)
- 1.2.2 Global Propolis Sales Volume (2021-2032)
- 1.2.3 Global Propolis Sales Average Price (2021-2032)
- 1.3 Assumptions and Limitations
- 1.4 Study Goals and Objectives
2 Propolis Market Dynamics
- 2.1 Propolis Industry Trends
- 2.2 Propolis Industry Drivers
- 2.3 Propolis Industry Opportunities and Challenges
- 2.4 Propolis Industry Restraints
3 Propolis Market by Company
- 3.1 Global Propolis Company Revenue Ranking in 2025
- 3.2 Global Propolis Revenue by Company (2021-2026)
- 3.3 Global Propolis Sales Volume by Company (2021-2026)
- 3.4 Global Propolis Average Price by Company (2021-2026)
- 3.5 Global Propolis Company Ranking (2024-2026)
- 3.6 Global Propolis Company Manufacturing Base and Headquarters
- 3.7 Global Propolis Company Product Type and Application
- 3.8 Global Propolis Company Establishment Date
- 3.9 Market Competitive Analysis
- 3.9.1 Global Propolis Market Concentration Ratio (CR5 and HHI)
- 3.9.2 Global Top 5 and 10 Company Market Share by Revenue in 2025
- 3.9.3 2025 Propolis Tier 1, Tier 2, and Tier 3 Companies
- 3.10 Mergers and Acquisitions Expansion
4 Propolis Market by Type
- 4.1 Propolis Type Introduction
- 4.1.1 Propolis Capsules
- 4.1.2 Propolis Liquids
- 4.1.3 Propolis Sprays
- 4.1.4 Other Propolis Products
- 4.2 Global Propolis Sales Volume by Type
- 4.2.1 Global Propolis Sales Volume by Type (2021 VS 2025 VS 2032)
- 4.2.2 Global Propolis Sales Volume by Type (2021-2032)
- 4.2.3 Global Propolis Sales Volume Share by Type (2021-2032)
- 4.3 Global Propolis Sales Value by Type
- 4.3.1 Global Propolis Sales Value by Type (2021 VS 2025 VS 2032)
- 4.3.2 Global Propolis Sales Value by Type (2021-2032)
- 4.3.3 Global Propolis Sales Value Share by Type (2021-2032)
5 Propolis Market by Application
- 5.1 Propolis Application Introduction
- 5.1.1 Online Retail
- 5.1.2 Offline Retail
- 5.2 Global Propolis Sales Volume by Application
- 5.2.1 Global Propolis Sales Volume by Application (2021 VS 2025 VS 2032)
- 5.2.2 Global Propolis Sales Volume by Application (2021-2032)
- 5.2.3 Global Propolis Sales Volume Share by Application (2021-2032)
- 5.3 Global Propolis Sales Value by Application
- 5.3.1 Global Propolis Sales Value by Application (2021 VS 2025 VS 2032)
- 5.3.2 Global Propolis Sales Value by Application (2021-2032)
- 5.3.3 Global Propolis Sales Value Share by Application (2021-2032)
6 Propolis Regional Sales and Value Analysis
- 6.1 Global Propolis Sales by Region: 2021 VS 2025 VS 2032
- 6.2 Global Propolis Sales by Region (2021-2032)
- 6.2.1 Global Propolis Sales by Region: 2021-2026
- 6.2.2 Global Propolis Sales by Region (2027-2032)
- 6.3 Global Propolis Sales Value by Region: 2021 VS 2025 VS 2032
- 6.4 Global Propolis Sales Value by Region (2021-2032)
- 6.4.1 Global Propolis Sales Value by Region: 2021-2026
- 6.4.2 Global Propolis Sales Value by Region (2027-2032)
- 6.5 Global Propolis Market Price Analysis by Region (2021-2026)
- 6.6 North America
- 6.6.1 North America Propolis Sales Value (2021-2032)
- 6.6.2 North America Propolis Sales Value Share by Country, 2025 VS 2032
- 6.7 Europe
- 6.7.1 Europe Propolis Sales Value (2021-2032)
- 6.7.2 Europe Propolis Sales Value Share by Country, 2025 VS 2032
- 6.8 Asia-Pacific
- 6.8.1 Asia-Pacific Propolis Sales Value (2021-2032)
- 6.8.2 Asia-Pacific Propolis Sales Value Share by Country, 2025 VS 2032
- 6.9 South America
- 6.9.1 South America Propolis Sales Value (2021-2032)
- 6.9.2 South America Propolis Sales Value Share by Country, 2025 VS 2032
- 6.10 Middle East & Africa
- 6.10.1 Middle East & Africa Propolis Sales Value (2021-2032)
- 6.10.2 Middle East & Africa Propolis Sales Value Share by Country, 2025 VS 2032
7 Propolis Country-level Sales and Value Analysis
- 7.1 Global Propolis Sales by Country: 2021 VS 2025 VS 2032
- 7.2 Global Propolis Sales Value by Country: 2021 VS 2025 VS 2032
- 7.3 Global Propolis Sales by Country (2021-2032)
- 7.3.1 Global Propolis Sales by Country (2021-2026)
- 7.3.2 Global Propolis Sales by Country (2027-2032)
- 7.4 Global Propolis Sales Value by Country (2021-2032)
- 7.4.1 Global Propolis Sales Value by Country (2021-2026)
- 7.4.2 Global Propolis Sales Value by Country (2027-2032)
- 7.5 USA
- 7.5.1 USA Propolis Sales Value Growth Rate (2021-2032)
- 7.5.2 USA Propolis Sales Value Share by Type, 2025 VS 2032
- 7.5.3 USA Propolis Sales Value Share by Application, 2025 VS 2032
- 7.6 Canada
- 7.6.1 Canada Propolis Sales Value Growth Rate (2021-2032)
- 7.6.2 Canada Propolis Sales Value Share by Type, 2025 VS 2032
- 7.6.3 Canada Propolis Sales Value Share by Application, 2025 VS 2032
- 7.7 Mexico
- 7.6.1 Mexico Propolis Sales Value Growth Rate (2021-2032)
- 7.6.2 Mexico Propolis Sales Value Share by Type, 2025 VS 2032
- 7.6.3 Mexico Propolis Sales Value Share by Application, 2025 VS 2032
- 7.8 Germany
- 7.8.1 Germany Propolis Sales Value Growth Rate (2021-2032)
- 7.8.2 Germany Propolis Sales Value Share by Type, 2025 VS 2032
- 7.8.3 Germany Propolis Sales Value Share by Application, 2025 VS 2032
- 7.9 France
- 7.9.1 France Propolis Sales Value Growth Rate (2021-2032)
- 7.9.2 France Propolis Sales Value Share by Type, 2025 VS 2032
- 7.9.3 France Propolis Sales Value Share by Application, 2025 VS 2032
- 7.10 U.K.
- 7.10.1 U.K. Propolis Sales Value Growth Rate (2021-2032)
- 7.10.2 U.K. Propolis Sales Value Share by Type, 2025 VS 2032
- 7.10.3 U.K. Propolis Sales Value Share by Application, 2025 VS 2032
- 7.11 Italy
- 7.11.1 Italy Propolis Sales Value Growth Rate (2021-2032)
- 7.11.2 Italy Propolis Sales Value Share by Type, 2025 VS 2032
- 7.11.3 Italy Propolis Sales Value Share by Application, 2025 VS 2032
- 7.12 Spain
- 7.12.1 Spain Propolis Sales Value Growth Rate (2021-2032)
- 7.12.2 Spain Propolis Sales Value Share by Type, 2025 VS 2032
- 7.12.3 Spain Propolis Sales Value Share by Application, 2025 VS 2032
- 7.13 Russia
- 7.13.1 Russia Propolis Sales Value Growth Rate (2021-2032)
- 7.13.2 Russia Propolis Sales Value Share by Type, 2025 VS 2032
- 7.13.3 Russia Propolis Sales Value Share by Application, 2025 VS 2032
- 7.14 Netherlands
- 7.14.1 Netherlands Propolis Sales Value Growth Rate (2021-2032)
- 7.14.2 Netherlands Propolis Sales Value Share by Type, 2025 VS 2032
- 7.14.3 Netherlands Propolis Sales Value Share by Application, 2025 VS 2032
- 7.15 Nordic Countries
- 7.15.1 Nordic Countries Propolis Sales Value Growth Rate (2021-2032)
- 7.15.2 Nordic Countries Propolis Sales Value Share by Type, 2025 VS 2032
- 7.15.3 Nordic Countries Propolis Sales Value Share by Application, 2025 VS 2032
- 7.16 China
- 7.16.1 China Propolis Sales Value Growth Rate (2021-2032)
- 7.16.2 China Propolis Sales Value Share by Type, 2025 VS 2032
- 7.16.3 China Propolis Sales Value Share by Application, 2025 VS 2032
- 7.17 Japan
- 7.17.1 Japan Propolis Sales Value Growth Rate (2021-2032)
- 7.17.2 Japan Propolis Sales Value Share by Type, 2025 VS 2032
- 7.17.3 Japan Propolis Sales Value Share by Application, 2025 VS 2032
- 7.18 South Korea
- 7.18.1 South Korea Propolis Sales Value Growth Rate (2021-2032)
- 7.18.2 South Korea Propolis Sales Value Share by Type, 2025 VS 2032
- 7.18.3 South Korea Propolis Sales Value Share by Application, 2025 VS 2032
- 7.19 India
- 7.19.1 India Propolis Sales Value Growth Rate (2021-2032)
- 7.19.2 India Propolis Sales Value Share by Type, 2025 VS 2032
- 7.19.3 India Propolis Sales Value Share by Application, 2025 VS 2032
- 7.20 Australia
- 7.20.1 Australia Propolis Sales Value Growth Rate (2021-2032)
- 7.20.2 Australia Propolis Sales Value Share by Type, 2025 VS 2032
- 7.20.3 Australia Propolis Sales Value Share by Application, 2025 VS 2032
- 7.21 Southeast Asia
- 7.21.1 Southeast Asia Propolis Sales Value Growth Rate (2021-2032)
- 7.21.2 Southeast Asia Propolis Sales Value Share by Type, 2025 VS 2032
- 7.21.3 Southeast Asia Propolis Sales Value Share by Application, 2025 VS 2032
- 7.22 Brazil
- 7.22.1 Brazil Propolis Sales Value Growth Rate (2021-2032)
- 7.22.2 Brazil Propolis Sales Value Share by Type, 2025 VS 2032
- 7.22.3 Brazil Propolis Sales Value Share by Application, 2025 VS 2032
- 7.23 Argentina
- 7.23.1 Argentina Propolis Sales Value Growth Rate (2021-2032)
- 7.23.2 Argentina Propolis Sales Value Share by Type, 2025 VS 2032
- 7.23.3 Argentina Propolis Sales Value Share by Application, 2025 VS 2032
- 7.24 Chile
- 7.24.1 Chile Propolis Sales Value Growth Rate (2021-2032)
- 7.24.2 Chile Propolis Sales Value Share by Type, 2025 VS 2032
- 7.24.3 Chile Propolis Sales Value Share by Application, 2025 VS 2032
- 7.25 Colombia
- 7.25.1 Colombia Propolis Sales Value Growth Rate (2021-2032)
- 7.25.2 Colombia Propolis Sales Value Share by Type, 2025 VS 2032
- 7.25.3 Colombia Propolis Sales Value Share by Application, 2025 VS 2032
- 7.26 Peru
- 7.26.1 Peru Propolis Sales Value Growth Rate (2021-2032)
- 7.26.2 Peru Propolis Sales Value Share by Type, 2025 VS 2032
- 7.26.3 Peru Propolis Sales Value Share by Application, 2025 VS 2032
- 7.27 Saudi Arabia
- 7.27.1 Saudi Arabia Propolis Sales Value Growth Rate (2021-2032)
- 7.27.2 Saudi Arabia Propolis Sales Value Share by Type, 2025 VS 2032
- 7.27.3 Saudi Arabia Propolis Sales Value Share by Application, 2025 VS 2032
- 7.28 Israel
- 7.28.1 Israel Propolis Sales Value Growth Rate (2021-2032)
- 7.28.2 Israel Propolis Sales Value Share by Type, 2025 VS 2032
- 7.28.3 Israel Propolis Sales Value Share by Application, 2025 VS 2032
- 7.29 UAE
- 7.29.1 UAE Propolis Sales Value Growth Rate (2021-2032)
- 7.29.2 UAE Propolis Sales Value Share by Type, 2025 VS 2032
- 7.29.3 UAE Propolis Sales Value Share by Application, 2025 VS 2032
- 7.30 Turkey
- 7.30.1 Turkey Propolis Sales Value Growth Rate (2021-2032)
- 7.30.2 Turkey Propolis Sales Value Share by Type, 2025 VS 2032
- 7.30.3 Turkey Propolis Sales Value Share by Application, 2025 VS 2032
- 7.31 Iran
- 7.31.1 Iran Propolis Sales Value Growth Rate (2021-2032)
- 7.31.2 Iran Propolis Sales Value Share by Type, 2025 VS 2032
- 7.31.3 Iran Propolis Sales Value Share by Application, 2025 VS 2032
- 7.32 Egypt
- 7.32.1 Egypt Propolis Sales Value Growth Rate (2021-2032)
- 7.32.2 Egypt Propolis Sales Value Share by Type, 2025 VS 2032
- 7.32.3 Egypt Propolis Sales Value Share by Application, 2025 VS 2032
8 Company Profiles
- 8.1 Apis Flora
- 8.1.1 Apis Flora Company Information
- 8.1.2 Apis Flora Business Overview
- 8.1.3 Apis Flora Propolis Sales, Value and Gross Margin (2021-2026)
- 8.1.4 Apis Flora Propolis Product Portfolio
- 8.1.5 Apis Flora Recent Developments
- 8.2 Comvita
- 8.2.1 Comvita Company Information
- 8.2.2 Comvita Business Overview
- 8.2.3 Comvita Propolis Sales, Value and Gross Margin (2021-2026)
- 8.2.4 Comvita Propolis Product Portfolio
- 8.2.5 Comvita Recent Developments
- 8.3 MN Própolis
- 8.3.1 MN Própolis Company Information
- 8.3.2 MN Própolis Business Overview
- 8.3.3 MN Própolis Propolis Sales, Value and Gross Margin (2021-2026)
- 8.3.4 MN Própolis Propolis Product Portfolio
- 8.3.5 MN Própolis Recent Developments
- 8.4 Manuka Health New Zealand
- 8.4.1 Manuka Health New Zealand Company Information
- 8.4.2 Manuka Health New Zealand Business Overview
- 8.4.3 Manuka Health New Zealand Propolis Sales, Value and Gross Margin (2021-2026)
- 8.4.4 Manuka Health New Zealand Propolis Product Portfolio
- 8.4.5 Manuka Health New Zealand Recent Developments
- 8.5 Zhifengtang
- 8.5.1 Zhifengtang Company Information
- 8.5.2 Zhifengtang Business Overview
- 8.5.3 Zhifengtang Propolis Sales, Value and Gross Margin (2021-2026)
- 8.5.4 Zhifengtang Propolis Product Portfolio
- 8.5.5 Zhifengtang Recent Developments
- 8.6 Wang's Bee Garden
- 8.6.1 Wang's Bee Garden Company Information
- 8.6.2 Wang's Bee Garden Business Overview
- 8.6.3 Wang's Bee Garden Propolis Sales, Value and Gross Margin (2021-2026)
- 8.6.4 Wang's Bee Garden Propolis Product Portfolio
- 8.6.5 Wang's Bee Garden Recent Developments
- 8.7 Baihua
- 8.7.1 Baihua Company Information
- 8.7.2 Baihua Business Overview
- 8.7.3 Baihua Propolis Sales, Value and Gross Margin (2021-2026)
- 8.7.4 Baihua Propolis Product Portfolio
- 8.7.5 Baihua Recent Developments
- 8.8 Jiangshan Hengliang
- 8.8.1 Jiangshan Hengliang Company Information
- 8.8.2 Jiangshan Hengliang Business Overview
- 8.8.3 Jiangshan Hengliang Propolis Sales, Value and Gross Margin (2021-2026)
- 8.8.4 Jiangshan Hengliang Propolis Product Portfolio
- 8.8.5 Jiangshan Hengliang Recent Developments
- 8.9 Nature's Answer
- 8.9.1 Nature's Answer Company Information
- 8.9.2 Nature's Answer Business Overview
- 8.9.3 Nature's Answer Propolis Sales, Value and Gross Margin (2021-2026)
- 8.9.4 Nature's Answer Propolis Product Portfolio
- 8.9.5 Nature's Answer Recent Developments
- 8.10 Jiangsu J.D.Y Biotechnology
- 8.10.1 Jiangsu J.D.Y Biotechnology Company Information
- 8.10.2 Jiangsu J.D.Y Biotechnology Business Overview
- 8.10.3 Jiangsu J.D.Y Biotechnology Propolis Sales, Value and Gross Margin (2021-2026)
- 8.10.4 Jiangsu J.D.Y Biotechnology Propolis Product Portfolio
- 8.10.5 Jiangsu J.D.Y Biotechnology Recent Developments
- 8.11 BEE’O Propolis
- 8.11.1 BEE’O Propolis Company Information
- 8.11.2 BEE’O Propolis Business Overview
- 8.11.3 BEE’O Propolis Propolis Sales, Value and Gross Margin (2021-2026)
- 8.11.4 BEE’O Propolis Propolis Product Portfolio
- 8.11.5 BEE’O Propolis Recent Developments
- 8.12 Bee Health
- 8.12.1 Bee Health Company Information
- 8.12.2 Bee Health Business Overview
- 8.12.3 Bee Health Propolis Sales, Value and Gross Margin (2021-2026)
- 8.12.4 Bee Health Propolis Product Portfolio
- 8.12.5 Bee Health Recent Developments
- 8.13 Martínez Nieto S.A.
- 8.13.1 Martínez Nieto S.A. Company Information
- 8.13.2 Martínez Nieto S.A. Business Overview
- 8.13.3 Martínez Nieto S.A. Propolis Sales, Value and Gross Margin (2021-2026)
- 8.13.4 Martínez Nieto S.A. Propolis Product Portfolio
- 8.13.5 Martínez Nieto S.A. Recent Developments
- 8.14 Seoul Propolis
- 8.14.1 Seoul Propolis Company Information
- 8.14.2 Seoul Propolis Business Overview
- 8.14.3 Seoul Propolis Propolis Sales, Value and Gross Margin (2021-2026)
- 8.14.4 Seoul Propolis Propolis Product Portfolio
- 8.14.5 Seoul Propolis Recent Developments
- 8.15 Uniflora
- 8.15.1 Uniflora Company Information
- 8.15.2 Uniflora Business Overview
- 8.15.3 Uniflora Propolis Sales, Value and Gross Margin (2021-2026)
- 8.15.4 Uniflora Propolis Product Portfolio
- 8.15.5 Uniflora Recent Developments
- 8.16 Baoshengyuan
- 8.16.1 Baoshengyuan Company Information
- 8.16.2 Baoshengyuan Business Overview
- 8.16.3 Baoshengyuan Propolis Sales, Value and Gross Margin (2021-2026)
- 8.16.4 Baoshengyuan Propolis Product Portfolio
- 8.16.5 Baoshengyuan Recent Developments
- 8.17 Nature's Care Manufacture
- 8.17.1 Nature's Care Manufacture Company Information
- 8.17.2 Nature's Care Manufacture Business Overview
- 8.17.3 Nature's Care Manufacture Propolis Sales, Value and Gross Margin (2021-2026)
- 8.17.4 Nature's Care Manufacture Propolis Product Portfolio
- 8.17.5 Nature's Care Manufacture Recent Developments
- 8.18 Apis Familia
- 8.18.1 Apis Familia Company Information
- 8.18.2 Apis Familia Business Overview
- 8.18.3 Apis Familia Propolis Sales, Value and Gross Margin (2021-2026)
- 8.18.4 Apis Familia Propolis Product Portfolio
- 8.18.5 Apis Familia Recent Developments
- 8.19 Homart Pharmaceuticals
- 8.19.1 Homart Pharmaceuticals Company Information
- 8.19.2 Homart Pharmaceuticals Business Overview
- 8.19.3 Homart Pharmaceuticals Propolis Sales, Value and Gross Margin (2021-2026)
- 8.19.4 Homart Pharmaceuticals Propolis Product Portfolio
- 8.19.5 Homart Pharmaceuticals Recent Developments
- 8.20 Wax Green
- 8.20.1 Wax Green Company Information
- 8.20.2 Wax Green Business Overview
- 8.20.3 Wax Green Propolis Sales, Value and Gross Margin (2021-2026)
- 8.20.4 Wax Green Propolis Product Portfolio
- 8.20.5 Wax Green Recent Developments
- 8.21 Apiário Polenectar
- 8.21.1 Apiário Polenectar Company Information
- 8.21.2 Apiário Polenectar Business Overview
- 8.21.3 Apiário Polenectar Propolis Sales, Value and Gross Margin (2021-2026)
- 8.21.4 Apiário Polenectar Propolis Product Portfolio
- 8.21.5 Apiário Polenectar Recent Developments
- 8.22 King’s Gel
- 8.22.1 King’s Gel Company Information
- 8.22.2 King’s Gel Business Overview
- 8.22.3 King’s Gel Propolis Sales, Value and Gross Margin (2021-2026)
- 8.22.4 King’s Gel Propolis Product Portfolio
- 8.22.5 King’s Gel Recent Developments
- 8.23 Sunyata Pon Lee
- 8.23.1 Sunyata Pon Lee Company Information
- 8.23.2 Sunyata Pon Lee Business Overview
- 8.23.3 Sunyata Pon Lee Propolis Sales, Value and Gross Margin (2021-2026)
- 8.23.4 Sunyata Pon Lee Propolis Product Portfolio
- 8.23.5 Sunyata Pon Lee Recent Developments
- 8.24 Yamada Bee Farm Corporation
- 8.24.1 Yamada Bee Farm Corporation Company Information
- 8.24.2 Yamada Bee Farm Corporation Business Overview
- 8.24.3 Yamada Bee Farm Corporation Propolis Sales, Value and Gross Margin (2021-2026)
- 8.24.4 Yamada Bee Farm Corporation Propolis Product Portfolio
- 8.24.5 Yamada Bee Farm Corporation Recent Developments
9 Value Chain and Sales Channels Analysis
- 9.1 Propolis Value Chain Analysis
- 9.1.1 Propolis Key Raw Materials
- 9.1.2 Raw Materials Key Suppliers
- 9.1.3 Manufacturing Cost Structure
- 9.1.4 Propolis Sales Mode & Process
- 9.2 Propolis Sales Channels Analysis
- 9.2.1 Direct Comparison with Distribution Share
- 9.2.2 Propolis Distributors
- 9.2.3 Propolis Customers
10 Concluding Insights
11 Appendix
- 11.1 Reasons for Doing This Study
- 11.2 Research Methodology
- 11.3 Research Process
- 11.4 Authors List of This Report
- 11.5 Data Source
- 11.5.1 Secondary Sources
- 11.5.2 Primary Sources
GET THE RESEARCH
Choose your license.
Choose who needs access.
All options are for this report and research series.
PDF by email within 3–5 working days after payment confirmation.
Talk to an analyst