
APO RESEARCH · REPORT
Global Barcode Verification (Customized Research) Market Analysis and Forecast 2026-2032
Barcode verification equipment comprises dedicated measurement instruments and integrated inline systems that evaluate the optical and geometric quality of machine-readable barcodes under standardized test conditions. These systems measure symbol characteristics and assign reproducible quality grades to linear barcodes (1D), two-dimensional symbols (2D) and direct part marks (DPM). Relevant methods include ISO/IEC 15416, ISO/IEC 15415 and ISO/IEC 29158, with applicable equipment conformance and calibration requirements under ISO/IEC 15426. Verification evaluates symbol quality under defined conditions; decoding performance also depends on the receiving reader and its operating environment.
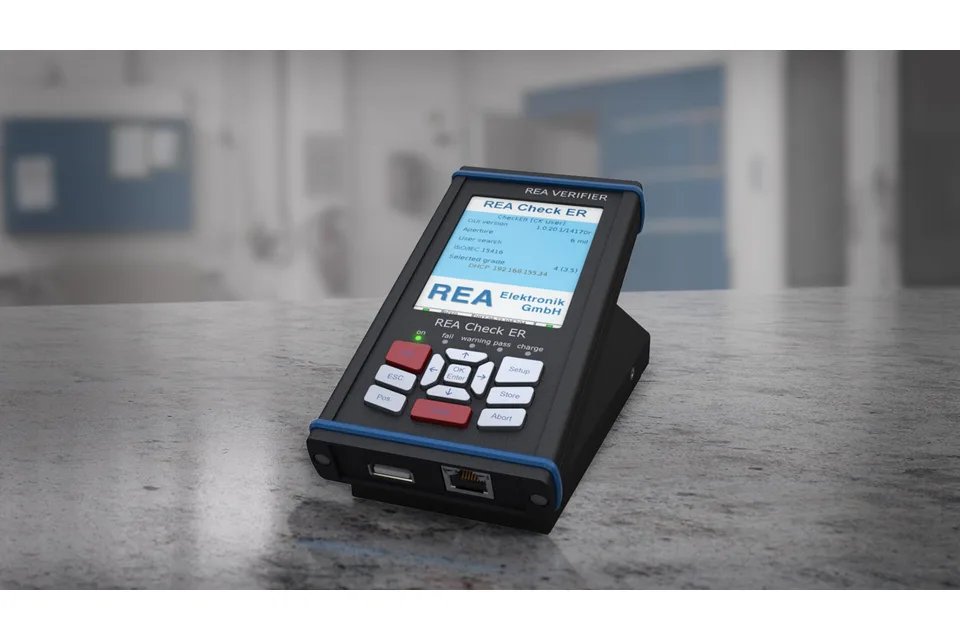
Product & engineering
Understand the product.
Barcode verification equipment comprises dedicated measurement instruments and integrated inline systems that evaluate the optical and geometric quality of machine-readable barcodes under standardized test conditions. These systems measure symbol characteristics and assign reproducible quality grades to linear barcodes (1D), two-dimensional symbols (2D) and direct part marks (DPM). Relevant methods include ISO/IEC 15416, ISO/IEC 15415 and ISO/IEC 29158, with applicable equipment conformance and calibration requirements under ISO/IEC 15426. Verification evaluates symbol quality under defined conditions; decoding performance also depends on the receiving reader and its operating environment.
Selected research
Market Analysis & Forecast
Global Barcode Verification (Customized Research) Market Analysis and Forecast 2026-2032
MARKET AT A GLANCE
Scale & outlook
- 2025
- 84.93USD million
- 2032
- 138.1USD million
Select a bar to inspect its value.
Source: APO Research, Inc.
Market perspective
According to APO Research, Inc., the global Barcode Verification market was valued at USD 70.54 million in 2021 and USD 84.93 million in 2025, and is projected to reach USD 138.10 million by 2032.
This customized research edition examines barcode verification equipment across barcode type, form factor, verification standard, application and geography. It includes dedicated country analyses for Japan, Germany, France and the United Kingdom, alongside global and regional coverage.
The report covers historical performance from 2021 to 2025 and the outlook through 2032. Research topics include equipment revenue and unit sales, manufacturer selling prices, production capacity and utilization, competitive positions and the industry value chain. Monetary values use fixed 2025 exchange rates.
Full market overview
Market coverage is limited to equipment capable of standardized verification and applicable calibration. General barcode scanners, relative-quality-only devices, standalone software, verification services and consumables are excluded.
This is a separate customized edition. Please review its contents and geographic coverage when comparing it with the standard Barcode Verification reports.
More report detail
Tables and figures
Table 1. Global Barcode Verification Market Size Growth Rate by Barcode Type (USD Million), 2021 VS 2025 VS 2032
Table 2. 2D Major Manufacturers
Table 3. 1D Major Manufacturers
Table 4. DPM Major Manufacturers
Table 5. Global Barcode Verification Market Size Growth Rate by Form Factor Type (USD Million), 2021 VS 2025 VS 2032
Table 6. Inline Major Manufacturers
Table 7. Benchtop Major Manufacturers
Table 8. Handheld Major Manufacturers
Table 9. Global Barcode Verification Market Size Growth Rate by Standard (USD Million), 2021 VS 2025 VS 2032
Table 10. ISO/IEC 15415 Major Manufacturers
Table 11. ISO/IEC 15416 Major Manufacturers
Table 12. ISO/IEC 29158 Major Manufacturers
Table 13. Global Barcode Verification Market Size Growth Rate by Application (USD Million), 2021 VS 2025 VS 2032
Table 14. Printing & Packaging Major Manufacturers
Table 15. Pharmaceuticals Major Manufacturers
Table 16. Food & Beverage Major Manufacturers
Table 17. Medical Devices Major Manufacturers
Table 18. Automotive Major Manufacturers
Table 19. Industrial Manufacturing Major Manufacturers
Table 20. Logistics & Distribution Major Manufacturers
Table 21. Global Barcode Verification Production Growth Rate (CAGR) by Region: 2021 VS 2025 VS 2032 (units)
Table 22. Global Barcode Verification Production by Region (2021-2026) & (units)
Table 23. Global Barcode Verification Production by Region (2027-2032) & (units)
Table 24. Global Barcode Verification Production Market Share by Region (2021-2026)
Table 25. Global Barcode Verification Production Market Share by Region (2027-2032)
Table 26. Global Barcode Verification Revenue Grow Rate (CAGR) by Region: 2021 VS 2025 VS 2032 (USD Million)
Table 27. Global Barcode Verification Revenue by Region (2021-2026) & (USD Million)
Table 28. Global Barcode Verification Revenue by Region (2027-2032) & (USD Million)
Table 29. Global Barcode Verification Revenue Market Share by Region (2021-2026)
Table 30. Global Barcode Verification Revenue Market Share by Region (2027-2032)
Table 31. Global Barcode Verification Sales Grow Rate by Region: 2021 VS 2025 VS 2032 (units)
Table 32. Global Barcode Verification Sales by Region (2021-2026) & (units)
Table 33. Global Barcode Verification Sales by Region (2027-2032) & (units)
Table 34. Global Barcode Verification Sales Market Share by Region (2021-2026)
Table 35. Global Barcode Verification Sales Market Share by Region (2027-2032)
Table 36. Global Barcode Verification Revenue by Manufacturers (USD Million) & (2021-2026)
Table 37. Global Barcode Verification Revenue Market Share by Manufacturers (2021-2026)
Table 38. Global Barcode Verification Sales by Manufacturers (units) & (2021-2026)
Table 39. Global Barcode Verification Sales Market Share by Manufacturers (2021-2026)
Table 40. Global Barcode Verification Sales Price (USD/unit) of Manufacturers (2021-2026)
Table 41. Global Barcode Verification Key Manufacturers Ranking, 2024 VS 2025 VS 2026
Table 42. Global Barcode Verification Key Manufacturers Manufacturing Sites & Headquarters
Table 43. Global Barcode Verification Manufacturers, Product Type & Application
Table 44. Global Barcode Verification Manufacturers Commercialization Time
Table 45. Global Manufacturers Market Concentration Ratio (CR5 and HHI)
Table 46. Global Barcode Verification by Manufacturers Type (Tier 1, Tier 2, and Tier 3) & (based on the Revenue of 2025)
Table 47. Global Barcode Verification Revenue By Barcode Type (2021-2026) & (USD Million)
Table 48. Global Barcode Verification Revenue By Barcode Type (2027-2032) & (USD Million)
Table 49. Global Barcode Verification Revenue Market Share By Barcode Type (2021-2026)
Table 50. Global Barcode Verification Revenue Market Share By Barcode Type (2027-2032)
Table 51. Global Barcode Verification Sales By Barcode Type (2021-2026) & (units)
Table 52. Global Barcode Verification Sales By Barcode Type (2027-2032) & (units)
Table 53. Global Barcode Verification Sales Market Share By Barcode Type (2021-2026)
Table 54. Global Barcode Verification Sales Market Share By Barcode Type (2027-2032)
Table 55. Global Barcode Verification Price By Barcode Type (2021-2026) & (USD/unit)
Table 56. Global Barcode Verification Price By Barcode Type (2027-2032) & (USD/unit)
Table 57. Global Barcode Verification Revenue By Form Factor (2021-2026) & (USD Million)
Table 58. Global Barcode Verification Revenue By Form Factor (2027-2032) & (USD Million)
Table 59. Global Barcode Verification Revenue Market Share By Form Factor (2021-2026)
Table 60. Global Barcode Verification Revenue Market Share By Form Factor (2027-2032)
Table 61. Global Barcode Verification Sales By Form Factor (2021-2026) & (units)
Table 62. Global Barcode Verification Sales By Form Factor (2027-2032) & (units)
Table 63. Global Barcode Verification Sales Market Share By Form Factor (2021-2026)
Table 64. Global Barcode Verification Sales Market Share By Form Factor (2027-2032)
Table 65. Global Barcode Verification Price By Form Factor (2021-2026) & (USD/unit)
Table 66. Global Barcode Verification Price By Form Factor (2027-2032) & (USD/unit)
Table 67. Global Barcode Verification Revenue by Barcode Type and Form Factor (2021 to 2026) & (USD Million)
Table 68. Global Barcode Verification Revenue by Barcode Type and Form Factor (2027 to 2032) & (USD Million)
Table 69. Global Barcode Verification Revenue Market Share by Barcode Type and Form Factor (2021 to 2026)
Table 70. Global Barcode Verification Revenue Market Share by Barcode Type and Form Factor (2027 to 2032)
Table 71. Global Barcode Verification Sales by Barcode Type and Form Factor (2021 to 2026) & (Units)
Table 72. Global Barcode Verification Sales by Barcode Type and Form Factor (2027 to 2032) & (Units)
Table 73. Global Barcode Verification Sales Market Share by Barcode Type and Form Factor (2021 to 2026)
Table 74. Global Barcode Verification Sales Market Share by Barcode Type and Form Factor (2027 to 2032)
Table 75. Global Barcode Verification Average Selling Price by Barcode Type and Form Factor (2021 to 2026) & (USD/unit)
Table 76. Global Barcode Verification Average Selling Price by Barcode Type and Form Factor (2027 to 2032) & (USD/unit)
Table 77. Global Barcode Verification Revenue By Standard (2021-2026) & (USD Million)
Table 78. Global Barcode Verification Revenue By Standard (2027-2032) & (USD Million)
Table 79. Global Barcode Verification Revenue Market Share By Standard (2021-2026)
Table 80. Global Barcode Verification Revenue Market Share By Standard (2027-2032)
Table 81. Global Barcode Verification Sales By Standard (2021-2026) & (units)
Table 82. Global Barcode Verification Sales By Standard (2027-2032) & (units)
Table 83. Global Barcode Verification Sales Market Share By Standard (2021-2026)
Table 84. Global Barcode Verification Sales Market Share By Standard (2027-2032)
Table 85. Global Barcode Verification Price By Standard (2021-2026) & (USD/unit)
Table 86. Global Barcode Verification Price By Standard (2027-2032) & (USD/unit)
Table 87. Global Barcode Verification Revenue by Application (2021-2026) & (USD Million)
Table 88. Global Barcode Verification Revenue by Application (2027-2032) & (USD Million)
Table 89. Global Barcode Verification Revenue Market Share by Application (2021-2026)
Table 90. Global Barcode Verification Revenue Market Share by Application (2027-2032)
Table 91. Global Barcode Verification Sales by Application (2021-2026) & (units)
Table 92. Global Barcode Verification Sales by Application (2027-2032) & (units)
Table 93. Global Barcode Verification Sales Market Share by Application (2021-2026)
Table 94. Global Barcode Verification Sales Market Share by Application (2027-2032)
Table 95. Global Barcode Verification Price by Application (2021-2026) & (USD/unit)
Table 96. Global Barcode Verification Price by Application (2027-2032) & (USD/unit)
Table 97. OMRON Company Information
Table 98. OMRON Barcode Verification Sales (units), Revenue (USD Million), Price (USD/unit) and Gross Margin (2021-2026)
Table 99. OMRON Barcode Verification Product Portfolio
Table 100. OMRON Recent Developments
Table 101. Brady Company Information
Table 102. Brady Barcode Verification Sales (units), Revenue (USD Million), Price (USD/unit) and Gross Margin (2021-2026)
Table 103. Brady Barcode Verification Product Portfolio
Table 104. Brady Recent Developments
Table 105. Cognex Company Information
Table 106. Cognex Barcode Verification Sales (units), Revenue (USD Million), Price (USD/unit) and Gross Margin (2021-2026)
Table 107. Cognex Barcode Verification Product Portfolio
Table 108. Cognex Recent Developments
Table 109. TSC Auto ID Company Information
Table 110. TSC Auto ID Barcode Verification Sales (units), Revenue (USD Million), Price (USD/unit) and Gross Margin (2021-2026)
Table 111. TSC Auto ID Barcode Verification Product Portfolio
Table 112. TSC Auto ID Recent Developments
Table 113. EyeC Company Information
Table 114. EyeC Barcode Verification Sales (units), Revenue (USD Million), Price (USD/unit) and Gross Margin (2021-2026)
Table 115. EyeC Barcode Verification Product Portfolio
Table 116. EyeC Recent Developments
Table 117. Axicon Company Information
Table 118. Axicon Barcode Verification Sales (units), Revenue (USD Million), Price (USD/unit) and Gross Margin (2021-2026)
Table 119. Axicon Barcode Verification Product Portfolio
Table 120. Axicon Recent Developments
Table 121. Logopak Company Information
Table 122. Logopak Barcode Verification Sales (units), Revenue (USD Million), Price (USD/unit) and Gross Margin (2021-2026)
Table 123. Logopak Barcode Verification Product Portfolio
Table 124. Logopak Recent Developments
Table 125. REA Elektronik Company Information
Table 126. REA Elektronik Barcode Verification Sales (units), Revenue (USD Million), Price (USD/unit) and Gross Margin (2021-2026)
Table 127. REA Elektronik Barcode Verification Product Portfolio
Table 128. REA Elektronik Recent Developments
Table 129. Siemens Company Information
Table 130. Siemens Barcode Verification Sales (units), Revenue (USD Million), Price (USD/unit) and Gross Margin (2021-2026)
Table 131. Siemens Barcode Verification Product Portfolio
Table 132. Siemens Recent Developments
Table 133. KEYENCE Company Information
Table 134. KEYENCE Barcode Verification Sales (units), Revenue (USD Million), Price (USD/unit) and Gross Margin (2021-2026)
Table 135. KEYENCE Barcode Verification Product Portfolio
Table 136. KEYENCE Recent Developments
Table 137. Lake Image Systems Company Information
Table 138. Lake Image Systems Barcode Verification Sales (units), Revenue (USD Million), Price (USD/unit) and Gross Margin (2021-2026)
Table 139. Lake Image Systems Barcode Verification Product Portfolio
Table 140. Lake Image Systems Recent Developments
Table 141. RJS Technologies Company Information
Table 142. RJS Technologies Barcode Verification Sales (units), Revenue (USD Million), Price (USD/unit) and Gross Margin (2021-2026)
Table 143. RJS Technologies Barcode Verification Product Portfolio
Table 144. RJS Technologies Recent Developments
Table 145. Stratix Company Information
Table 146. Stratix Barcode Verification Sales (units), Revenue (USD Million), Price (USD/unit) and Gross Margin (2021-2026)
Table 147. Stratix Corporation Barcode Verification Product Portfolio
Table 148. Stratix Recent Developments
Table 149. IOSS Company Information
Table 150. IOSS Barcode Verification Sales (units), Revenue (USD Million), Price (USD/unit) and Gross Margin (2021-2026)
Table 151. IOSS Barcode Verification Product Portfolio
Table 152. IOSS Recent Developments
Table 153. HEROJE Company Information
Table 154. HEROJE Barcode Verification Sales (units), Revenue (USD Million), Price (USD/unit) and Gross Margin (2021-2026)
Table 155. HEROJE Barcode Verification Product Portfolio
Table 156. HEROJE Recent Developments
Table 157. Automatic Identification Systems Company Information
Table 158. Automatic Identification Systems Barcode Verification Sales (units), Revenue (USD Million), Price (USD/unit) and Gross Margin (2021-2026)
Table 159. Automatic Identification Systems Barcode Verification Product Portfolio
Table 160. Automatic Identification Systems Recent Developments
Table 161. TrekMark Company Information
Table 162. TrekMark Barcode Verification Sales (units), Revenue (USD Million), Price (USD/unit) and Gross Margin (2021-2026)
Table 163. TrekMark Barcode Verification Product Portfolio
Table 164. TrekMark Recent Developments
Table 165. Perceptor Inspection Company Information
Table 166. Perceptor Inspection Barcode Verification Sales (units), Revenue (USD Million), Price (USD/unit) and Gross Margin (2021-2026)
Table 167. Perceptor Inspection Barcode Verification Product Portfolio
Table 168. Perceptor Inspection Recent Developments
Table 169. Guangzhou Xinyida (ACK) Company Information
Table 170. Guangzhou Xinyida (ACK) Barcode Verification Sales (units), Revenue (USD Million), Price (USD/unit) and Gross Margin (2021-2026)
Table 171. Guangzhou Xinyida (ACK) Barcode Verification Product Portfolio
Table 172. Guangzhou Xinyida (ACK) Recent Developments
Table 173. Dongfang Jiema Company Information
Table 174. Dongfang Jiema Barcode Verification Sales (units), Revenue (USD Million), Price (USD/unit) and Gross Margin (2021-2026)
Table 175. Dongfang Jiema Barcode Verification Product Portfolio
Table 176. Dongfang Jiema Recent Developments
Table 177. North America Barcode Verification Revenue by Barcode Type (2021-2026) & (USD Million)
Table 178. North America Barcode Verification Revenue by Barcode Type (2027-2032) & (USD Million)
Table 179. North America Barcode Verification Sales by Barcode Type (2021-2026) & (units)
Table 180. North America Barcode Verification Sales by Barcode Type (2027-2032) & (units)
Table 181. North America Barcode Verification Sales Price by Barcode Type (2021-2026) & (USD/unit)
Table 182. North America Barcode Verification Sales Price by Barcode Type (2027-2032) & (USD/unit)
Table 183. North America Barcode Verification Revenue by Application (2021-2026) & (USD Million)
Table 184. North America Barcode Verification Revenue by Application (2027-2032) & (USD Million)
Table 185. North America Barcode Verification Sales by Application (2021-2026) & (units)
Table 186. North America Barcode Verification Sales by Application (2027-2032) & (units)
Table 187. North America Barcode Verification Sales Price by Application (2021-2026) & (USD/unit)
Table 188. North America Barcode Verification Sales Price by Application (2027-2032) & (USD/unit)
Table 189. North America Barcode Verification Revenue Grow Rate by Country (2021 VS 2025 VS 2032) & (USD Million)
Table 190. North America Barcode Verification Revenue Grow Rate by Country (2021-2026) & (USD Million)
Table 191. North America Barcode Verification Revenue Grow Rate by Country (2027-2032) & (USD Million)
Table 192. North America Barcode Verification Sales by Country (2021 VS 2025 VS 2032) & (units)
Table 193. North America Barcode Verification Sales by Country (2021-2026) & (units)
Table 194. North America Barcode Verification Sales by Country (2027-2032) & (units)
Table 195. North America Barcode Verification Sales Price by Country (2021-2026) & (USD/unit)
Table 196. North America Barcode Verification Sales Price by Country (2027-2032) & (USD/unit)
Table 197. United States Barcode Verification Revenue (2021-2032) & (USD Million)
Table 198. Canada Barcode Verification Revenue (2021-2032) & (USD Million)
Table 199. Mexico Barcode Verification Revenue (2021-2032) & (USD Million)
Table 200. Europe Barcode Verification Revenue by Barcode Type (2021-2026) & (USD Million)
Table 201. Europe Barcode Verification Revenue by Barcode Type (2027-2032) & (USD Million)
Table 202. Europe Barcode Verification Sales by Barcode Type (2021-2026) & (units)
Table 203. Europe Barcode Verification Sales by Barcode Type (2027-2032) & (units)
Table 204. Europe Barcode Verification Sales Price by Barcode Type (2021-2026) & (USD/unit)
Table 205. Europe Barcode Verification Sales Price by Barcode Type (2027-2032) & (USD/unit)
Table 206. Europe Barcode Verification Revenue by Application (2021-2026) & (USD Million)
Table 207. Europe Barcode Verification Revenue by Application (2027-2032) & (USD Million)
Table 208. Europe Barcode Verification Sales by Application (2021-2026) & (units)
Table 209. Europe Barcode Verification Sales by Application (2027-2032) & (units)
Table 210. Europe Barcode Verification Sales Price by Application (2021-2026) & (USD/unit)
Table 211. Europe Barcode Verification Sales Price by Application (2027-2032) & (USD/unit)
Table 212. Europe Barcode Verification Revenue Grow Rate by Country (2021 VS 2025 VS 2032) & (USD Million)
Table 213. Europe Barcode Verification Revenue Grow Rate by Country (2021-2026) & (USD Million)
Table 214. Europe Barcode Verification Revenue Grow Rate by Country (2027-2032) & (USD Million)
Table 215. Europe Barcode Verification Sales by Country (2021 VS 2025 VS 2032) & (units)
Table 216. Europe Barcode Verification Sales by Country (2021-2026) & (units)
Table 217. Europe Barcode Verification Sales by Country (2027-2032) & (units)
Table 218. Europe Barcode Verification Sales Price by Country (2021-2026) & (USD/unit)
Table 219. Europe Barcode Verification Sales Price by Country (2027-2032) & (USD/unit)
Table 220. Germany Barcode Verification Revenue (2021-2032) & (USD Million)
Table 221. Italy Barcode Verification Revenue (2021-2032) & (USD Million)
Table 222. France Barcode Verification Revenue (2021-2032) & (USD Million)
Table 223. U.K. Barcode Verification Revenue (2021-2032) & (USD Million)
Table 224. Spain Barcode Verification Revenue (2021-2032) & (USD Million)
Table 225. Switzerland Barcode Verification Revenue (2021-2032) & (USD Million)
Table 226. Netherlands Barcode Verification Revenue (2021-2032) & (USD Million)
Table 227. Belgium Barcode Verification Revenue (2021-2032) & (USD Million)
Table 228. Poland Barcode Verification Revenue (2021-2032) & (USD Million)
Table 229. Ireland Barcode Verification Revenue (2021-2032) & (USD Million)
Table 230. Japan Barcode Verification Revenue by Barcode Type (2021-2026) & (USD Million)
Table 231. Japan Barcode Verification Revenue by Barcode Type (2027-2032) & (USD Million)
Table 232. Japan Barcode Verification Sales by Barcode Type (2021-2026) & (units)
Table 233. Japan Barcode Verification Sales by Barcode Type (2027-2032) & (units)
Table 234. Japan Barcode Verification Sales Price by Barcode Type (2021-2026) & (USD/unit)
Table 235. Japan Barcode Verification Sales Price by Barcode Type (2027-2032) & (USD/unit)
Table 236. Japan Barcode Verification Revenue by Form Factor Type (2021-2026) & (USD Million)
Table 237. Japan Barcode Verification Revenue by Form Factor Type (2027-2032) & (USD Million)
Table 238. Japan Barcode Verification Sales by Form Factor Type (2021-2026) & (units)
Table 239. Japan Barcode Verification Sales by Form Factor Type (2027-2032) & (units)
Table 240. Japan Barcode Verification Sales Price by Form Factor Type (2021-2026) & (USD/unit)
Table 241. Japan Barcode Verification Sales Price by Form Factor Type (2027-2032) & (USD/unit)
Table 242. Japan Barcode Verification Revenue by Standard Type (2021-2026) & (USD Million)
Table 243. Japan Barcode Verification Revenue by Standard Type (2027-2032) & (USD Million)
Table 244. Japan Barcode Verification Sales by Standard Type (2021-2026) & (units)
Table 245. Japan Barcode Verification Sales by Standard Type (2027-2032) & (units)
Table 246. Japan Barcode Verification Sales Price by Standard Type (2021-2026) & (USD/unit)
Table 247. Japan Barcode Verification Sales Price by Standard Type (2027-2032) & (USD/unit)
Table 248. Germany Barcode Verification Revenue by Barcode Type (2021-2026) & (USD Million)
Table 249. Germany Barcode Verification Revenue by Barcode Type (2027-2032) & (USD Million)
Table 250. Germany Barcode Verification Sales by Barcode Type (2021-2026) & (units)
Table 251. Germany Barcode Verification Sales by Barcode Type (2027-2032) & (units)
Table 252. Germany Barcode Verification Sales Price by Barcode Type (2021-2026) & (USD/unit)
Table 253. Germany Barcode Verification Sales Price by Barcode Type (2027-2032) & (USD/unit)
Table 254. Germany Barcode Verification Revenue by Form Factor Type (2021-2026) & (USD Million)
Table 255. Germany Barcode Verification Revenue by Form Factor Type (2027-2032) & (USD Million)
Table 256. Germany Barcode Verification Sales by Form Factor Type (2021-2026) & (units)
Table 257. Germany Barcode Verification Sales by Form Factor Type (2027-2032) & (units)
Table 258. Germany Barcode Verification Sales Price by Form Factor Type (2021-2026) & (USD/unit)
Table 259. Germany Barcode Verification Sales Price by Form Factor Type (2027-2032) & (USD/unit)
Table 260. Germany Barcode Verification Revenue by Standard Type (2021-2026) & (USD Million)
Table 261. Germany Barcode Verification Revenue by Standard Type (2027-2032) & (USD Million)
Table 262. Germany Barcode Verification Sales by Standard Type (2021-2026) & (units)
Table 263. Germany Barcode Verification Sales by Standard Type (2027-2032) & (units)
Table 264. Germany Barcode Verification Sales Price by Standard Type (2021-2026) & (USD/unit)
Table 265. Germany Barcode Verification Sales Price by Standard Type (2027-2032) & (USD/unit)
Table 266. France Barcode Verification Revenue by Barcode Type (2021-2026) & (USD Million)
Table 267. France Barcode Verification Revenue by Barcode Type (2027-2032) & (USD Million)
Table 268. France Barcode Verification Sales by Barcode Type (2021-2026) & (units)
Table 269. France Barcode Verification Sales by Barcode Type (2027-2032) & (units)
Table 270. France Barcode Verification Sales Price by Barcode Type (2021-2026) & (USD/unit)
Table 271. France Barcode Verification Sales Price by Barcode Type (2027-2032) & (USD/unit)
Table 272. France Barcode Verification Revenue by Form Factor Type (2021-2026) & (USD Million)
Table 273. France Barcode Verification Revenue by Form Factor Type (2027-2032) & (USD Million)
Table 274. France Barcode Verification Sales by Form Factor Type (2021-2026) & (units)
Table 275. France Barcode Verification Sales by Form Factor Type (2027-2032) & (units)
Table 276. France Barcode Verification Sales Price by Form Factor Type (2021-2026) & (USD/unit)
Table 277. France Barcode Verification Sales Price by Form Factor Type (2027-2032) & (USD/unit)
Table 278. France Barcode Verification Revenue by Standard Type (2021-2026) & (USD Million)
Table 279. France Barcode Verification Revenue by Standard Type (2027-2032) & (USD Million)
Table 280. France Barcode Verification Sales by Standard Type (2021-2026) & (units)
Table 281. France Barcode Verification Sales by Standard Type (2027-2032) & (units)
Table 282. France Barcode Verification Sales Price by Standard Type (2021-2026) & (USD/unit)
Table 283. France Barcode Verification Sales Price by Standard Type (2027-2032) & (USD/unit)
Table 284. UK Barcode Verification Revenue by Barcode Type (2021-2026) & (USD Million)
Table 285. UK Barcode Verification Revenue by Barcode Type (2027-2032) & (USD Million)
Table 286. UK Barcode Verification Sales by Barcode Type (2021-2026) & (units)
Table 287. UK Barcode Verification Sales by Barcode Type (2027-2032) & (units)
Table 288. UK Barcode Verification Sales Price by Barcode Type (2021-2026) & (USD/unit)
Table 289. UK Barcode Verification Sales Price by Barcode Type (2027-2032) & (USD/unit)
Table 290. UK Barcode Verification Revenue by Form Factor Type (2021-2026) & (USD Million)
Table 291. UK Barcode Verification Revenue by Form Factor Type (2027-2032) & (USD Million)
Table 292. UK Barcode Verification Sales by Form Factor Type (2021-2026) & (units)
Table 293. UK Barcode Verification Sales by Form Factor Type (2027-2032) & (units)
Table 294. UK Barcode Verification Sales Price by Form Factor Type (2021-2026) & (USD/unit)
Table 295. UK Barcode Verification Sales Price by Form Factor Type (2027-2032) & (USD/unit)
Table 296. UK Barcode Verification Revenue by Standard Type (2021-2026) & (USD Million)
Table 297. UK Barcode Verification Revenue by Standard Type (2027-2032) & (USD Million)
Table 298. UK Barcode Verification Sales by Standard Type (2021-2026) & (units)
Table 299. UK Barcode Verification Sales by Standard Type (2027-2032) & (units)
Table 300. UK Barcode Verification Sales Price by Standard Type (2021-2026) & (USD/unit)
Table 301. UK Barcode Verification Sales Price by Standard Type (2027-2032) & (USD/unit)
Table 302. China Barcode Verification Revenue by Barcode Type (2021-2026) & (USD Million)
Table 303. China Barcode Verification Revenue by Barcode Type (2027-2032) & (USD Million)
Table 304. China Barcode Verification Sales by Barcode Type (2021-2026) & (units)
Table 305. China Barcode Verification Sales by Barcode Type (2027-2032) & (units)
Table 306. China Barcode Verification Sales Price by Barcode Type (2021-2026) & (USD/unit)
Table 307. China Barcode Verification Sales Price by Barcode Type (2027-2032) & (USD/unit)
Table 308. China Barcode Verification Revenue by Application (2021-2026) & (USD Million)
Table 309. China Barcode Verification Revenue by Application (2027-2032) & (USD Million)
Table 310. China Barcode Verification Sales by Application (2021-2026) & (units)
Table 311. China Barcode Verification Sales by Application (2027-2032) & (units)
Table 312. China Barcode Verification Sales Price by Application (2021-2026) & (USD/unit)
Table 313. China Barcode Verification Sales Price by Application (2027-2032) & (USD/unit)
Table 314. Asia Barcode Verification Revenue by Barcode Type (2021-2026) & (USD Million)
Table 315. Asia Barcode Verification Revenue by Barcode Type (2027-2032) & (USD Million)
Table 316. Asia Barcode Verification Sales by Barcode Type (2021-2026) & (units)
Table 317. Asia Barcode Verification Sales by Barcode Type (2027-2032) & (units)
Table 318. Asia Barcode Verification Sales Price by Barcode Type (2021-2026) & (USD/unit)
Table 319. Asia Barcode Verification Sales Price by Barcode Type (2027-2032) & (USD/unit)
Table 320. Asia Barcode Verification Revenue by Application (2021-2026) & (USD Million)
Table 321. Asia Barcode Verification Revenue by Application (2027-2032) & (USD Million)
Table 322. Asia Barcode Verification Sales by Application (2021-2026) & (units)
Table 323. Asia Barcode Verification Sales by Application (2027-2032) & (units)
Table 324. Asia Barcode Verification Sales Price by Application (2021-2026) & (USD/unit)
Table 325. Asia Barcode Verification Sales Price by Application (2027-2032) & (USD/unit)
Table 326. Asia Barcode Verification Revenue Grow Rate by Country (2021 VS 2025 VS 2032) & (USD Million)
Table 327. Asia Barcode Verification Revenue Grow Rate by Country (2021-2026) & (USD Million)
Table 328. Asia Barcode Verification Revenue Grow Rate by Country (2027-2032) & (USD Million)
Table 329. Asia Barcode Verification Sales by Country (2021 VS 2025 VS 2032) & (units)
Table 330. Asia Barcode Verification Sales by Country (2021-2026) & (units)
Table 331. Asia Barcode Verification Sales by Country (2027-2032) & (units)
Table 332. Asia Barcode Verification Sales Price by Country (2021-2026) & (USD/unit)
Table 333. Asia Barcode Verification Sales Price by Country (2027-2032) & (USD/unit)
Table 334. Japan Barcode Verification Revenue (2021-2032) & (USD Million)
Table 335. South Korea Barcode Verification Revenue (2021-2032) & (USD Million)
Table 336. India Barcode Verification Revenue (2021-2032) & (USD Million)
Table 337. Taiwan Barcode Verification Revenue (2021-2032) & (USD Million)
Table 338. Singapore Barcode Verification Revenue (2021-2032) & (USD Million)
Table 339. Thailand Barcode Verification Revenue (2021-2032) & (USD Million)
Table 340. Australia Barcode Verification Revenue (2021-2032) & (USD Million)
Table 341. Malaysia Barcode Verification Revenue (2021-2032) & (USD Million)
Table 342. Vietnam Barcode Verification Revenue (2021-2032) & (USD Million)
Table 343. SAMEA Barcode Verification Revenue by Barcode Type (2021-2026) & (USD Million)
Table 344. SAMEA Barcode Verification Revenue by Barcode Type (2027-2032) & (USD Million)
Table 345. SAMEA Barcode Verification Sales by Barcode Type (2021-2026) & (units)
Table 346. SAMEA Barcode Verification Sales by Barcode Type (2027-2032) & (units)
Table 347. SAMEA Barcode Verification Sales Price by Barcode Type (2021-2026) & (USD/unit)
Table 348. SAMEA Barcode Verification Sales Price by Barcode Type (2027-2032) & (USD/unit)
Table 349. SAMEA Barcode Verification Revenue by Application (2021-2026) & (USD Million)
Table 350. SAMEA Barcode Verification Revenue by Application (2027-2032) & (USD Million)
Table 351. SAMEA Barcode Verification Sales by Application (2021-2026) & (units)
Table 352. SAMEA Barcode Verification Sales by Application (2027-2032) & (units)
Table 353. SAMEA Barcode Verification Sales Price by Application (2021-2026) & (USD/unit)
Table 354. SAMEA Barcode Verification Sales Price by Application (2027-2032) & (USD/unit)
Table 355. SAMEA Barcode Verification Revenue Grow Rate by Country (2021 VS 2025 VS 2032) & (USD Million)
Table 356. SAMEA Barcode Verification Revenue Grow Rate by Country (2021-2026) & (USD Million)
Table 357. SAMEA Barcode Verification Revenue Grow Rate by Country (2027-2032) & (USD Million)
Table 358. SAMEA Barcode Verification Sales by Country (2021 VS 2025 VS 2032) & (units)
Table 359. SAMEA Barcode Verification Sales by Country (2021-2026) & (units)
Table 360. SAMEA Barcode Verification Sales by Country (2027-2032) & (units)
Table 361. SAMEA Barcode Verification Sales Price by Country (2021-2026) & (USD/unit)
Table 362. SAMEA Barcode Verification Sales Price by Country (2027-2032) & (USD/unit)
Table 363. Brazil Barcode Verification Revenue (2021-2032) & (USD Million)
Table 364. Turkey Barcode Verification Revenue (2021-2032) & (USD Million)
Table 365. South Africa Barcode Verification Revenue (2021-2032) & (USD Million)
Table 366. UAE Barcode Verification Revenue (2021-2032) & (USD Million)
Table 367. Key Raw Materials
Table 368. Key Raw Materials
Table 369. Raw Materials Key Suppliers
Table 370. Raw Materials Key Suppliers
Table 371. Barcode Verification Distributors List
Table 372. Barcode Verification Customers List
Table 373. Research Programs/Design for This Report
Table 374. Research Programs/Design for This Report
Table 375. Authors List of This Report
Table 376. Secondary Sources
Table 377. Primary Sources
Figure 1. Barcode Verification Product Image
Figure 2. Global Barcode Verification Market Size Growth Rate by Barcode Type (USD Million), 2021 VS 2025 VS 2032
Figure 3. Global Barcode Verification Market Size Share by Barcode Type 2021 VS 2025 VS 2032
Figure 4. 2D Image
Figure 5. 1D Image
Figure 6. DPM Image
Figure 7. Global Barcode Verification Market Size Growth Rate by Form Factor Type (USD Million), 2021 VS 2025 VS 2032
Figure 8. Global Barcode Verification Market Size Share by Form Factor Type 2021 VS 2025 VS 2032
Figure 9. Inline Image
Figure 10. Benchtop Image
Figure 11. Handheld Image
Figure 12. Global Barcode Verification Market Size Growth Rate by Standard (USD Million), 2021 VS 2025 VS 2032
Figure 13. Global Barcode Verification Market Size Share 2021 VS 2025 VS 2032
Figure 14. ISO/IEC 15415 Image
Figure 15. ISO/IEC 15416 Image
Figure 16. ISO/IEC 29158 Image
Figure 17. Global Barcode Verification Market Size Growth Rate by Application (USD Million), 2021 VS 2025 VS 2032
Figure 18. Global Barcode Verification Market Size Share 2021 VS 2025 VS 2032
Figure 19. Printing & Packaging Image
Figure 20. Pharmaceuticals Image
Figure 21. Food & Beverage Image
Figure 22. Medical Devices Image
Figure 23. Automotive Image
Figure 24. Industrial Manufacturing Image
Figure 25. Logistics & Distribution Image
Figure 26. Global Barcode Verification Capacity, Capacity Utilization (2021-2032) & (units)
Figure 27. Global Barcode Verification Production by Region: 2021 VS 2025 VS 2032 (units)
Figure 28. Global Barcode Verification Production Market Share by Region: 2021 Versus 2025 Versus 2032
Figure 29. Global Barcode Verification Production Market Share by Region (2021-2032)
Figure 30. North America Barcode Verification Production Growth Rate (2021-2032) & (units)
Figure 31. Europe Barcode Verification Production Growth Rate (2021-2032) & (units)
Figure 32. China Barcode Verification Production Growth Rate (2021-2032) & (units)
Figure 33. Japan Barcode Verification Production Growth Rate (2021-2032) & (units)
Figure 34. South Korea Barcode Verification Production Growth Rate (2021-2032) & (units)
Figure 35. Global Barcode Verification Revenue (USD Million), 2021 VS 2025 VS 2032
Figure 36. Global Barcode Verification Revenue (2021-2032) & (USD Million)
Figure 37. Global Barcode Verification Revenue (CAGR) by Region: 2021 VS 2025 VS 2032 (USD Million)
Figure 38. Global Barcode Verification Revenue Market Share by Region: 2025 Versus 2032
Figure 39. Global Barcode Verification Revenue Market Share by Region (2021-2032)
Figure 40. Global Barcode Verification Sales (2021-2032) & (units)
Figure 41. Global Barcode Verification Sales by Region: 2021 VS 2025 VS 2032 (units)
Figure 42. Global Barcode Verification Sales Market Share by Region (2021-2032)
Figure 43. North America Barcode Verification Sales YoY (2021-2032) & (units)
Figure 44. Europe Barcode Verification Sales YoY (2021-2032) & (units)
Figure 45. China Barcode Verification Sales YoY (2021-2032) & (units)
Figure 46. Asia (Excluding China) Barcode Verification Sales YoY (2021-2032) & (units)
Figure 47. South America, Middle East and Africa Barcode Verification Sales YoY (2021-2032) & (units)
Figure 48. Global Barcode Verification Manufacturers Revenue Share Top 10 and Top 5 in 2025
Figure 49. Global Barcode Verification Manufacturers Sales Share Top 10 and Top 5 in 2025
Figure 50. Manufacturers Type (Tier 1, Tier 2, and Tier 3): 2021 VS 2025
Figure 51. Global Barcode Verification Revenue Market Share By Barcode Type (2021-2032)
Figure 52. Global Barcode Verification Sales Market Share By Barcode Type (2021-2032)
Figure 53. Global Barcode Verification Revenue Market Share By Form Factor (2021-2032)
Figure 54. Global Barcode Verification Sales Market Share By Form Factor (2021-2032)
Figure 55. Global Barcode Verification Revenue Market Share by Barcode Type and Form Factor (2021 to 2032)
Figure 56. Global Barcode Verification Sales Market Share by Barcode Type and Form Factor (2021 to 2032)
Figure 57. Global Barcode Verification Revenue Market Share By Standard (2021-2032)
Figure 58. Global Barcode Verification Sales Market Share By Standard (2021-2032)
Figure 59. Global Barcode Verification Revenue Market Share by Application (2021-2032)
Figure 60. Global Barcode Verification Sales Market Share by Application (2021-2032)
Figure 61. OMRON VHV5-SRV Inline Barcode Verification System
Figure 62. Honeywell PX940V
Figure 63. Cognex DataMan 395V Photographs
Figure 64. TSC Auto ID Technology T6000e
Figure 65. EyeC Proofiler 600 DT Sample Inspection System
Figure 66. Axicon 6100-S Photographs
Figure 67. Verifier is Integrated into Labeling Equipment
Figure 68. REA Check ER Verification System
Figure 69. Siemens SIMATIC MV440 SR
Figure 70. Keyence SR-X300
Figure 71. Discovery Multiscan3 inspection station at Royal Joh. Enschedé, Netherlands
Figure 72. RJS Technologies Inspector 5000 2D Camera
Figure 73. Stratix Xaminer Pro IS 9020
Figure 74. DMR210 Inline Verifier
Figure 75. HEROJE BV9600 series desktop barcode verifier
Figure 76. Automatic Identification Systems SCANALYST 4
Figure 77. TrekMark В-300 Verifier
Figure 78. Perceptor IoT Zebra ZT610
Figure 79. Guangzhou Xinyida (ACK) ACK5205 Barcode Verification
Figure 80. Dongfang Jiema JY-3C
Figure 81. North America Barcode Verification Revenue Share by Barcode Type (2021-2032)
Figure 82. North America Barcode Verification Sales Share by Barcode Type (2021-2032)
Figure 83. North America Barcode Verification Revenue Share by Application (2021-2032)
Figure 84. North America Barcode Verification Sales Share by Application (2021-2032)
Figure 85. North America Barcode Verification Revenue Share by Country (2021-2032)
Figure 86. North America Barcode Verification Sales Share by Country (2021-2032)
Figure 87. Europe Barcode Verification Revenue Share by Barcode Type (2021-2032)
Figure 88. Europe Barcode Verification Sales Share by Barcode Type (2021-2032)
Figure 89. Europe Barcode Verification Revenue Share by Application (2021-2032)
Figure 90. Europe Barcode Verification Sales Share by Application (2021-2032)
Figure 91. Europe Barcode Verification Revenue Share by Country (2021-2032)
Figure 92. Europe Barcode Verification Sales Share by Country (2021-2032)
Figure 93. Japan Barcode Verification Revenue Share by Barcode Barcode Type (2021-2032)
Figure 94. Japan Barcode Verification Sales Share by Barcode Type (2021-2032)
Figure 95. Japan Barcode Verification Revenue Share by Form Factor Type (2021-2032)
Figure 96. Japan Barcode Verification Sales Share by Form Factor Type (2021-2032)
Figure 97. Japan Barcode Verification Revenue Share by Standard Type (2021-2032)
Figure 98. Japan Barcode Verification Sales Share by Standard Type (2021-2032)
Figure 99. Germany Barcode Verification Revenue Share by Barcode Type (2021-2032)
Figure 100. Germany Barcode Verification Sales Share by Barcode Type (2021-2032)
Figure 101. Germany Barcode Verification Revenue Share by Form Factor Type (2021-2032)
Figure 102. Germany Barcode Verification Sales Share by Form Factor Type (2021-2032)
Figure 103. Germany Barcode Verification Revenue Share by Standard Type (2021-2032)
Figure 104. Germany Barcode Verification Sales Share by Standard Type (2021-2032)
Figure 105. France Barcode Verification Revenue Share by Barcode Type (2021-2032)
Figure 106. France Barcode Verification Sales Share by Barcode Type (2021-2032)
Figure 107. France Barcode Verification Revenue Share by Form Factor Type (2021-2032)
Figure 108. France Barcode Verification Sales Share by Form Factor Type (2021-2032)
Figure 109. France Barcode Verification Revenue Share by Standard Type (2021-2032)
Figure 110. France Barcode Verification Sales Share by Standard Type (2021-2032)
Figure 111. UK Barcode Verification Revenue Share by Barcode Type (2021-2032)
Figure 112. UK Barcode Verification Sales Share by Barcode Type (2021-2032)
Figure 113. UK Barcode Verification Revenue Share by Form Factor Type (2021-2032)
Figure 114. UK Barcode Verification Sales Share by Form Factor Type (2021-2032)
Figure 115. UK Barcode Verification Revenue Share by Standard Type (2021-2032)
Figure 116. UK Barcode Verification Sales Share by Standard Type (2021-2032)
Figure 117. China Barcode Verification Revenue Share by Barcode Type (2021-2032)
Figure 118. China Barcode Verification Sales Share by Barcode Type (2021-2032)
Figure 119. China Barcode Verification Revenue Share by Application (2021-2032)
Figure 120. China Barcode Verification Sales Share by Application (2021-2032)
Figure 121. Asia Barcode Verification Revenue Share by Barcode Type (2021-2032)
Figure 122. Asia Barcode Verification Sales Share by Barcode Type (2021-2032)
Figure 123. Asia Barcode Verification Revenue Share by Application (2021-2032)
Figure 124. Asia Barcode Verification Sales Share by Application (2021-2032)
Figure 125. Asia Barcode Verification Revenue Share by Country (2021-2032)
Figure 126. Asia Barcode Verification Sales Share by Country (2021-2032)
Figure 127. SAMEA Barcode Verification Revenue Share by Barcode Type (2021-2032)
Figure 128. SAMEA Barcode Verification Sales Share by Barcode Type (2021-2032)
Figure 129. SAMEA Barcode Verification Revenue Share by Application (2021-2032)
Figure 130. SAMEA Barcode Verification Sales Share by Application (2021-2032)
Figure 131. SAMEA Barcode Verification Revenue Share by Country (2021-2032)
Figure 132. SAMEA Barcode Verification Sales Share by Country (2021-2032)
Figure 133. Barcode Verification Value Chain
Figure 134. Manufacturing Cost Structure
Figure 135. Barcode Verification Production Mode & Process
Figure 136. Direct Comparison with Distribution Share
Figure 137. Distributors Profiles
Figure 138. Years Considered
Figure 139. Research Process
Figure 140. Key Executives Interviewed
Scope & coverage.
by Barcode Type
- 1D
- 2D
- DPM
by Form Factor
- Handheld
- Benchtop
- Inline
by Verification Standard
- ISO/IEC 15416
- ISO/IEC 15415
- ISO/IEC 29158
by Application
- Printing & Packaging
- Pharmaceuticals
- Food & Beverage
- Medical Devices
- Automotive
- Industrial Manufacturing
- Logistics & Distribution
- Others
Companies covered
- Global Barcode Verification Price by Application
- OMRON
- Brady
- Cognex
- TSC Auto ID
- EyeC
- Axicon
- Logopak
- REA Elektronik
- Siemens
- KEYENCE
- Lake Image Systems
- RJS Technologies
- Stratix
- IOSS
- HEROJE
- Automatic Identification Systems
- TrekMark
- Perceptor Inspection
- Guangzhou Xinyida (ACK)
- Dongfang Jiema
Inside the report.
1 Market Overview
- 1.1 Product Definition
- 1.2 Barcode Verification Market by Barcode Type
- 1.2.1 Global Barcode Verification Market Size by Barcode Type, 2021 VS 2025 VS 2032
- 1.2.2 2D
- 1.2.3 1D
- 1.2.4 DPM
- 1.3 Barcode Verification Market by Form Factor Type
- 1.3.1 Global Barcode Verification Market Size by Form Factor Type, 2021 VS 2025 VS 2032
- 1.3.2 Inline
- 1.3.3 Benchtop
- 1.3.4 Handheld
- 1.4 Barcode Verification Market by Standard
- 1.4.1 Global Barcode Verification Market Size by Standard, 2021 VS 2025 VS 2032
- 1.4.2 ISO/IEC 15415
- 1.4.3 ISO/IEC 15416
- 1.4.4 ISO/IEC 29158
- 1.5 Barcode Verification Market by Application
- 1.5.1 Global Barcode Verification Market Size by Application, 2021 VS 2025 VS 2032
- 1.5.2 Printing & Packaging
- 1.5.3 Pharmaceuticals
- 1.5.4 Food & Beverage
- 1.5.5 Medical Devices
- 1.5.6 Automotive
- 1.5.7 Industrial Manufacturing
- 1.5.8 Logistics & Distribution
- 1.5.9 Others
- 1.6 Assumptions and Limitations
2 Barcode Verification Market Dynamics
- 2.1 Barcode Verification Industry Trends
- 2.2 Barcode Verification Industry Drivers
- 2.3 Barcode Verification Industry Opportunities and Challenges
- 2.3.1 Barcode Verification Industry Opportunities
- 2.3.2 Barcode Verification Industry Challenges
- 2.4 Barcode Verification Industry Restraints
3 Global Barcode Verification Production Overview
- 3.1 Global Barcode Verification Production Capacity (2021-2032)
- 3.2 Global Barcode Verification Production by Region: 2021 VS 2025 VS 2032
- 3.3 Global Barcode Verification Production by Region
- 3.3.1 Global Barcode Verification Production by Region (2021-2026)
- 3.3.2 Global Barcode Verification Production by Region (2027-2032)
- 3.3.3 Global Barcode Verification Production Market Share by Region (2021-2032)
- 3.4 North America
- 3.5 Europe
- 3.6 China
- 3.7 Japan
- 3.8 South Korea
4 Global Market Growth Prospects
- 4.1 Global Barcode Verification Revenue Estimates and Forecasts (2021-2032)
- 4.2 Global Barcode Verification Revenue by Region
- 4.2.1 Global Barcode Verification Revenue by Region: 2021 VS 2025 VS 2032
- 4.2.2 Global Barcode Verification Revenue by Region (2021-2026)
- 4.2.3 Global Barcode Verification Revenue by Region (2027-2032)
- 4.2.4 Global Barcode Verification Revenue Market Share by Region (2021-2032)
- 4.3 Global Barcode Verification Sales Estimates and Forecasts 2021-2032
- 4.4 Global Barcode Verification Sales by Region
- 4.4.1 Global Barcode Verification Sales by Region: 2021 VS 2025 VS 2032
- 4.4.2 Global Barcode Verification Sales by Region (2021-2026)
- 4.4.3 Global Barcode Verification Sales by Region (2027-2032)
- 4.4.4 Global Barcode Verification Sales Market Share by Region (2021-2032)
- 4.5 North America
- 4.6 Europe
- 4.7 China
- 4.8 Asia (Excluding China)
- 4.9 South America, Middle East and Africa
5 Market Competitive Landscape by Manufacturers
- 5.1 Global Barcode Verification Revenue by Manufacturers
- 5.1.1 Global Barcode Verification Revenue by Manufacturers (2021-2026)
- 5.1.2 Global Barcode Verification Revenue Market Share by Manufacturers (2021-2026)
- 5.1.3 Global Barcode Verification Manufacturers Revenue Share Top 10 and Top 5 in 2025
- 5.2 Global Barcode Verification Sales by Manufacturers
- 5.2.1 Global Barcode Verification Sales by Manufacturers (2021-2026)
- 5.2.2 Global Barcode Verification Sales Market Share by Manufacturers (2021-2026)
- 5.2.3 Global Barcode Verification Manufacturers Sales Share Top 10 and Top 5 in 2025
- 5.3 Global Barcode Verification Sales Price by Manufacturers (2021-2026)
- 5.4 Global Barcode Verification Key Manufacturers Ranking, 2024 VS 2025 VS 2026
- 5.5 Global Barcode Verification Key Manufacturers Manufacturing Sites & Headquarters
- 5.6 Global Barcode Verification Manufacturers, Product Type & Application
- 5.7 Global Barcode Verification Manufacturers Commercialization Time
- 5.8 Market Competitive Analysis
- 5.8.1 Global Barcode Verification Market CR5 and HHI
- 5.8.2 2025 Barcode Verification Tier 1, Tier 2, and Tier 3
6 Barcode Verification Market by Barcode Type
- 6.1 Global Barcode Verification Revenue By Barcode Type
- 6.1.1 Global Barcode Verification Revenue By Barcode Type (2021-2032) & (USD Million)
- 6.1.2 Global Barcode Verification Revenue Market Share By Barcode Type (2021-2032)
- 6.2 Global Barcode Verification Sales By Barcode Type
- 6.2.1 Global Barcode Verification Sales By Barcode Type (2021-2032) & (units)
- 6.2.2 Global Barcode Verification Sales Market Share By Barcode Type (2021-2032)
- 6.3 Global Barcode Verification Price By Barcode Type
7 Barcode Verification Market by Form Factor Type
- 7.1 Global Barcode Verification Revenue By Form Factor
- 7.1.1 Global Barcode Verification Revenue By Form Factor (2021-2032) & (USD Million)
- 7.1.2 Global Barcode Verification Revenue Market Share By Form Factor (2021-2032)
- 7.2 Global Barcode Verification Sales By Form Factor
- 7.2.1 Global Barcode Verification Sales By Form Factor (2021-2032) & (units)
- 7.2.2 Global Barcode Verification Sales Market Share By Form Factor (2021-2032)
- 7.3 Global Barcode Verification Price By Form Factor
8 Global Barcode Verification Market by Barcode Type and Form Factor
- 8.1 Global Barcode Verification Revenue by Barcode Type and Form Factor
- 8.1.1 Global Barcode Verification Revenue by Barcode Type and Form Factor (2021 to 2032)
- 8.1.2 Global Barcode Verification Revenue Market Share by Barcode Type and Form Factor
- 8.2 Global Barcode Verification Sales by Barcode Type and Form Factor
- 8.2.1 Global Barcode Verification Sales by Barcode Type and Form Factor (2021 to 2032)
- 8.2.2 Global Barcode Verification Sales Market Share by Barcode Type and Form Factor
- 8.3 Global Barcode Verification Average Selling Price by Barcode Type and Form Factor
9 Barcode Verification Market by Standard
- 9.1 Global Barcode Verification Revenue By Standard
- 9.1.1 Global Barcode Verification Revenue By Standard (2021-2032) & (USD Million)
- 9.1.2 Global Barcode Verification Revenue Market Share By Standard (2021-2032)
- 9.2 Global Barcode Verification Sales By Standard
- 9.2.1 Global Barcode Verification Sales By Standard (2021-2032) & (units)
- 9.2.2 Global Barcode Verification Sales Market Share By Standard (2021-2032)
- 9.3 Global Barcode Verification Price By Standard
10 Barcode Verification Market by Application
- 10.1 Global Barcode Verification Revenue by Application
- 10.1.1 Global Barcode Verification Revenue by Application (2021-2032) & (USD Million)
- 10.1.2 Global Barcode Verification Revenue Market Share by Application (2021-2032)
- 10.2 Global Barcode Verification Sales by Application
- 10.2.1 Global Barcode Verification Sales by Application (2021-2032) & (units)
- 10.2.2 Global Barcode Verification Sales Market Share by Application (2021-2032)
- 10.3 Global Barcode Verification Price by Application
11 Company Profiles
- 11.1 OMRON
- 11.1.1 OMRON Company Information
- 11.1.2 OMRON Business Overview
- 11.1.3 OMRON Barcode Verification Sales, Revenue, Price, and Gross Margin (2021-2026)
- 11.1.4 OMRON Barcode Verification Product Portfolio
- 11.1.5 OMRON Recent Developments
- 11.2 Brady
- 11.2.1 Brady Company Information
- 11.2.2 Brady Business Overview
- 11.2.3 Brady Barcode Verification Sales, Revenue, Price, and Gross Margin (2021-2026)
- 11.2.4 Brady Barcode Verification Product Portfolio
- 11.2.5 Brady Recent Developments
- 11.3 Cognex
- 11.3.1 Cognex Company Information
- 11.3.2 Cognex Business Overview
- 11.3.3 Cognex Barcode Verification Sales, Revenue, Price, and Gross Margin (2021-2026)
- 11.3.4 Cognex Barcode Verification Product Portfolio
- 11.3.5 Cognex Recent Developments
- 11.4 TSC Auto ID
- 11.4.1 TSC Auto ID Company Information
- 11.4.2 TSC Auto ID Business Overview
- 11.4.3 TSC Auto ID Barcode Verification Sales, Revenue, Price, and Gross Margin (2021-2026)
- 11.4.4 TSC Auto ID Barcode Verification Product Portfolio
- 11.4.5 TSC Auto ID Recent Developments
- 11.5 EyeC
- 11.5.1 EyeC Company Information
- 11.5.2 EyeC Business Overview
- 11.5.3 EyeC Barcode Verification Sales, Revenue, Price, and Gross Margin (2021-2026)
- 11.5.4 EyeC Barcode Verification Product Portfolio
- 11.5.5 EyeC Recent Developments
- 11.6 Axicon
- 11.6.1 Axicon Company Information
- 11.6.2 Axicon Business Overview
- 11.6.3 Axicon Barcode Verification Sales, Revenue, Price, and Gross Margin (2021-2026)
- 11.6.4 Axicon Barcode Verification Product Portfolio
- 11.6.5 Axicon Recent Developments
- 11.7 Logopak
- 11.7.1 Logopak Company Information
- 11.7.2 Logopak Business Overview
- 11.7.3 Logopak Barcode Verification Sales, Revenue, Price, and Gross Margin (2021-2026)
- 11.7.4 Logopak Barcode Verification Product Portfolio
- 11.7.5 Logopak Recent Developments
- 11.8 REA Elektronik
- 11.8.1 REA Elektronik Company Information
- 11.8.2 REA Elektronik Business Overview
- 11.8.3 REA Elektronik Barcode Verification Sales, Revenue, Price, and Gross Margin (2021-2026)
- 11.8.4 REA Elektronik Barcode Verification Product Portfolio
- 11.8.5 REA Elektronik Recent Developments
- 11.9 Siemens
- 11.9.1 Siemens Company Information
- 11.9.2 Siemens Business Overview
- 11.9.3 Siemens Barcode Verification Sales, Revenue, Price, and Gross Margin (2021-2026)
- 11.9.4 Siemens Barcode Verification Product Portfolio
- 11.9.5 Siemens Recent Developments
- 11.10 KEYENCE
- 11.10.1 KEYENCE Company Information
- 11.10.2 KEYENCE Business Overview
- 11.10.3 KEYENCE Barcode Verification Sales, Revenue, Price, and Gross Margin (2021-2026)
- 11.10.4 KEYENCE Barcode Verification Product Portfolio
- 11.10.5 KEYENCE Recent Developments
- 11.11 Lake Image Systems
- 11.11.1 Lake Image Systems Company Information
- 11.11.2 Lake Image Systems Business Overview
- 11.11.3 Lake Image Systems Barcode Verification Sales, Revenue, Price, and Gross Margin (2021-2026)
- 11.11.4 Lake Image Systems Barcode Verification Product Portfolio
- 11.11.5 Lake Image Systems Recent Developments
- 11.12 RJS Technologies
- 11.12.1 RJS Technologies Company Information
- 11.12.2 RJS Technologies Business Overview
- 11.12.3 RJS Technologies Barcode Verification Sales, Revenue, Price, and Gross Margin (2021-2026)
- 11.12.4 RJS Technologies Barcode Verification Product Portfolio
- 11.12.5 RJS Technologies Recent Developments
- 11.13 Stratix
- 11.13.1 Stratix Company Information
- 11.13.2 Stratix Business Overview
- 11.13.3 Stratix Barcode Verification Sales, Revenue, Price, and Gross Margin (2021-2026)
- 11.13.4 Stratix Barcode Verification Product Portfolio
- 11.13.5 Stratix Recent Developments
- 11.14 IOSS
- 11.14.1 IOSS Company Information
- 11.14.2 IOSS Business Overview
- 11.14.3 IOSS Barcode Verification Sales, Revenue, Price, and Gross Margin (2021-2026)
- 11.14.4 IOSS Barcode Verification Product Portfolio
- 11.14.5 IOSS Recent Developments
- 11.15 HEROJE
- 11.15.1 HEROJE Company Information
- 11.15.2 HEROJE Business Overview
- 11.15.3 HEROJE Barcode Verification Sales, Revenue, Price, and Gross Margin (2021-2026)
- 11.15.4 HEROJE Barcode Verification Product Portfolio
- 11.15.5 HEROJE Recent Developments
- 11.16 Automatic Identification Systems
- 11.16.1 Automatic Identification Systems Company Information
- 11.16.2 Automatic Identification Systems Business Overview
- 11.16.3 Automatic Identification Systems Barcode Verification Sales, Revenue, Price, and Gross Margin (2021-2026)
- 11.16.4 Automatic Identification Systems Barcode Verification Product Portfolio
- 11.16.5 Automatic Identification Systems Recent Developments
- 11.17 TrekMark
- 11.17.1 TrekMark Company Information
- 11.17.2 TrekMark Business Overview
- 11.17.3 TrekMark Barcode Verification Sales, Revenue, Price, and Gross Margin (2021-2026)
- 11.17.4 TrekMark Barcode Verification Product Portfolio
- 11.17.5 TrekMark Recent Developments
- 11.18 Perceptor Inspection
- 11.18.1 Perceptor Inspection Company Information
- 11.18.2 Perceptor Inspection Business Overview
- 11.18.3 Perceptor Inspection Barcode Verification Sales, Revenue, Price, and Gross Margin (2021-2026)
- 11.18.4 Perceptor Inspection Barcode Verification Product Portfolio
- 11.18.5 Perceptor Inspection Recent Developments
- 11.19 Guangzhou Xinyida (ACK)
- 11.19.1 Guangzhou Xinyida (ACK) Company Information
- 11.19.2 Guangzhou Xinyida (ACK) Business Overview
- 11.19.3 Guangzhou Xinyida (ACK) Barcode Verification Sales, Revenue, Price, and Gross Margin (2021-2026)
- 11.19.4 Guangzhou Xinyida (ACK) Barcode Verification Product Portfolio
- 11.19.5 Guangzhou Xinyida (ACK) Recent Developments
- 11.20 Dongfang Jiema
- 11.20.1 Dongfang Jiema Company Information
- 11.20.2 Dongfang Jiema Business Overview
- 11.20.3 Dongfang Jiema Barcode Verification Sales, Revenue, Price, and Gross Margin (2021-2026)
- 11.20.4 Dongfang Jiema Barcode Verification Product Portfolio
- 11.20.5 Dongfang Jiema Recent Developments
12 North America
- 12.1 North America Barcode Verification Market Size by Barcode Type
- 12.1.1 North America Barcode Verification Revenue by Barcode Type (2021-2032)
- 12.1.2 North America Barcode Verification Sales by Barcode Type (2021-2032)
- 12.1.3 North America Barcode Verification Price by Barcode Type (2021-2032)
- 12.2 North America Barcode Verification Market Size by Application
- 12.2.1 North America Barcode Verification Revenue by Application (2021-2032)
- 12.2.2 North America Barcode Verification Sales by Application (2021-2032)
- 12.2.3 North America Barcode Verification Price by Application (2021-2032)
- 12.3 North America Barcode Verification Market Size by Country
- 12.3.1 North America Barcode Verification Revenue Grow Rate by Country (2021 VS 2025 VS 2032)
- 12.3.2 North America Barcode Verification Sales by Country (2021 VS 2025 VS 2032)
- 12.3.3 North America Barcode Verification Price by Country (2021-2032)
- 12.3.4 United States
- 12.3.5 Canada
- 12.3.6 Mexico
13 Europe
- 13.1 Europe Barcode Verification Market Size by Barcode Type
- 13.1.1 Europe Barcode Verification Revenue by Barcode Type (2021-2032)
- 13.1.2 Europe Barcode Verification Sales by Barcode Type (2021-2032)
- 13.1.3 Europe Barcode Verification Price by Barcode Type (2021-2032)
- 13.2 Europe Barcode Verification Market Size by Application
- 13.2.1 Europe Barcode Verification Revenue by Application (2021-2032)
- 13.2.2 Europe Barcode Verification Sales by Application (2021-2032)
- 13.2.3 Europe Barcode Verification Price by Application (2021-2032)
- 13.3 Europe Barcode Verification Market Size by Country
- 13.3.1 Europe Barcode Verification Revenue Grow Rate by Country (2021 VS 2025 VS 2032)
- 13.3.2 Europe Barcode Verification Sales by Country (2021 VS 2025 VS 2032)
- 13.3.3 Europe Barcode Verification Price by Country (2021-2032)
- 13.3.4 Germany
- 13.3.5 Italy
- 13.3.6 France
- 13.3.7 U.K.
- 13.3.8 Spain
- 13.3.9 Switzerland
- 13.3.10 Netherlands
- 13.3.11 Belgium
- 13.3.12 Poland
- 13.3.13 Ireland
14 Japan
- 14.1 Japan Barcode Verification Market Size by Barcode Type
- 14.1.1 Japan Barcode Verification Revenue by Barcode Type (2021-2032)
- 14.1.2 Japan Barcode Verification Sales by Barcode Type (2021-2032)
- 14.1.3 Japan Barcode Verification Price by Barcode Type (2021-2032)
- 14.2 Japan Barcode Verification Market Size by Form Factor Type
- 14.2.1 Japan Barcode Verification Revenue by Form Factor Type (2021-2032)
- 14.2.2 Japan Barcode Verification Sales by Form Factor Type (2021-2032)
- 14.2.3 Japan Barcode Verification Price by Form Factor Type (2021-2032)
- 14.3 Japan Barcode Verification Market Size by Standard Type
- 14.3.1 Japan Barcode Verification Revenue by Standard Type (2021-2032)
- 14.3.2 Japan Barcode Verification Sales by Standard Type (2021-2032)
- 14.3.3 Japan Barcode Verification Price by Standard Type (2021-2032)
15 Germany
- 15.1 Germany Barcode Verification Market Size by Barcode Type
- 15.1.1 Germany Barcode Verification Revenue by Barcode Type (2021-2032)
- 15.1.2 Germany Barcode Verification Sales by Barcode Type (2021-2032)
- 15.1.3 Germany Barcode Verification Price by Barcode Type (2021-2032)
- 15.2 Germany Barcode Verification Market Size by Form Factor Type
- 15.2.1 Germany Barcode Verification Revenue by Form Factor Type (2021-2032)
- 15.2.2 Germany Barcode Verification Sales by Form Factor Type (2021-2032)
- 15.2.3 Germany Barcode Verification Price by Form Factor Type (2021-2032)
- 15.3 Germany Barcode Verification Market Size by Standard Type
- 15.3.1 Germany Barcode Verification Revenue by Standard Type (2021-2032)
- 15.3.2 Germany Barcode Verification Sales by Standard Type (2021-2032)
- 15.3.3 Germany Barcode Verification Price by Standard Type (2021-2032)
16 France
- 16.1 France Barcode Verification Market Size by Barcode Type
- 16.1.1 France Barcode Verification Revenue by Barcode Type (2021-2032)
- 16.1.2 France Barcode Verification Sales by Barcode Type (2021-2032)
- 16.1.3 France Barcode Verification Price by Barcode Type (2021-2032)
- 16.2 France Barcode Verification Market Size by Form Factor Type
- 16.2.1 France Barcode Verification Revenue by Form Factor Type (2021-2032)
- 16.2.2 France Barcode Verification Sales by Form Factor Type (2021-2032)
- 16.2.3 France Barcode Verification Price by Form Factor Type (2021-2032)
- 16.3 France Barcode Verification Market Size by Standard Type
- 16.3.1 France Barcode Verification Revenue by Standard Type (2021-2032)
- 16.3.2 France Barcode Verification Sales by Standard Type (2021-2032)
- 16.3.3 France Barcode Verification Price by Standard Type (2021-2032)
17 UK
- 17.1 UK Barcode Verification Market Size by Barcode Type
- 17.1.1 UK Barcode Verification Revenue by Barcode Type (2021-2032)
- 17.1.2 UK Barcode Verification Sales by Barcode Type (2021-2032)
- 17.1.3 UK Barcode Verification Price by Barcode Type (2021-2032)
- 17.2 UK Barcode Verification Market Size by Form Factor Type
- 17.2.1 UK Barcode Verification Revenue by Form Factor Type (2021-2032)
- 17.2.2 UK Barcode Verification Sales by Form Factor Type (2021-2032)
- 17.2.3 UK Barcode Verification Price by Form Factor Type (2021-2032)
- 17.3 UK Barcode Verification Market Size by Standard Type
- 17.3.1 UK Barcode Verification Revenue by Standard Type (2021-2032)
- 17.3.2 UK Barcode Verification Sales by Standard Type (2021-2032)
- 17.3.3 UK Barcode Verification Price by Standard Type (2021-2032)
18 China
- 18.1 China Barcode Verification Market Size by Barcode Type
- 18.1.1 China Barcode Verification Revenue by Barcode Type (2021-2032)
- 18.1.2 China Barcode Verification Sales by Barcode Type (2021-2032)
- 18.1.3 China Barcode Verification Price by Barcode Type (2021-2032)
- 18.2 China Barcode Verification Market Size by Application
- 18.2.1 China Barcode Verification Revenue by Application (2021-2032)
- 18.2.2 China Barcode Verification Sales by Application (2021-2032)
- 18.2.3 China Barcode Verification Price by Application (2021-2032)
19 Asia (Excluding China)
- 19.1 Asia Barcode Verification Market Size by Barcode Type
- 19.1.1 Asia Barcode Verification Revenue by Barcode Type (2021-2032)
- 19.1.2 Asia Barcode Verification Sales by Barcode Type (2021-2032)
- 19.1.3 Asia Barcode Verification Price by Barcode Type (2021-2032)
- 19.2 Asia Barcode Verification Market Size by Application
- 19.2.1 Asia Barcode Verification Revenue by Application (2021-2032)
- 19.2.2 Asia Barcode Verification Sales by Application (2021-2032)
- 19.2.3 Asia Barcode Verification Price by Application (2021-2032)
- 19.3 Asia Barcode Verification Market Size by Country
- 19.3.1 Asia Barcode Verification Revenue Grow Rate by Country (2021 VS 2025 VS 2032)
- 19.3.2 Asia Barcode Verification Sales by Country (2021 VS 2025 VS 2032)
- 19.3.3 Asia Barcode Verification Price by Country (2021-2032)
- 19.3.4 Japan
- 19.3.5 South Korea
- 19.3.6 India
- 19.3.7 Taiwan
- 19.3.8 Singapore
- 19.3.9 Thailand
- 19.3.10 Australia
- 19.3.11 Malaysia
- 19.3.12 Vietnam
20 South America, Middle East and Africa
- 20.1 SAMEA Barcode Verification Market Size by Barcode Type
- 20.1.1 SAMEA Barcode Verification Revenue by Barcode Type (2021-2032)
- 20.1.2 SAMEA Barcode Verification Sales by Barcode Type (2021-2032)
- 20.1.3 SAMEA Barcode Verification Price by Barcode Type (2021-2032)
- 20.2 SAMEA Barcode Verification Market Size by Application
- 20.2.1 SAMEA Barcode Verification Revenue by Application (2021-2032)
- 20.2.2 SAMEA Barcode Verification Sales by Application (2021-2032)
- 20.2.3 SAMEA Barcode Verification Price by Application (2021-2032)
- 20.3 SAMEA Barcode Verification Market Size by Country
- 20.3.1 SAMEA Barcode Verification Revenue Grow Rate by Country (2021 VS 2025 VS 2032)
- 20.3.2 SAMEA Barcode Verification Sales by Country (2021 VS 2025 VS 2032)
- 20.3.3 SAMEA Barcode Verification Price by Country (2021-2032)
- 20.3.4 Brazil
- 20.3.5 Turkey
- 20.3.6 South Africa
- 20.3.7 UAE
21 Value Chain and Sales Channels Analysis
- 21.1 Barcode Verification Value Chain Analysis
- 21.1.1 Barcode Verification Key Raw Materials
- 21.1.2 Raw Materials Key Suppliers
- 21.1.3 Manufacturing Cost Structure
- 21.1.4 Barcode Verification Production Mode & Process
- 21.2 Barcode Verification Sales Channels Analysis
- 21.2.1 Direct Comparison with Distribution Share
- 21.2.2 Barcode Verification Distributors
- 21.2.3 Barcode Verification Customers
22 Concluding Insights
23 Appendix
- 23.1 Reasons for Doing This Study
- 23.2 Research Methodology
- 23.3 Research Process
- 23.4 Authors List of This Report
- 23.4.1 Data Source
- 23.4.2 Secondary Sources
- 23.4.3 Primary Sources
- 23.5 Disclaimer
GET THE RESEARCH
Choose your license.
PDF by email within 3–5 working days after payment confirmation.
Talk to an analyst