
APO RESEARCH · REPORT
Mechanical Seals
Mechanical seal refers to at least a pair of end faces perpendicular to the axis of rotation in the fluid pressure and compensation mechanism of elasticity (or magnetic force) and auxiliary seals to maintain the fit and relative sliding under the cooperation of the device to prevent fluid leakage.
Product & engineering
Understand the product.
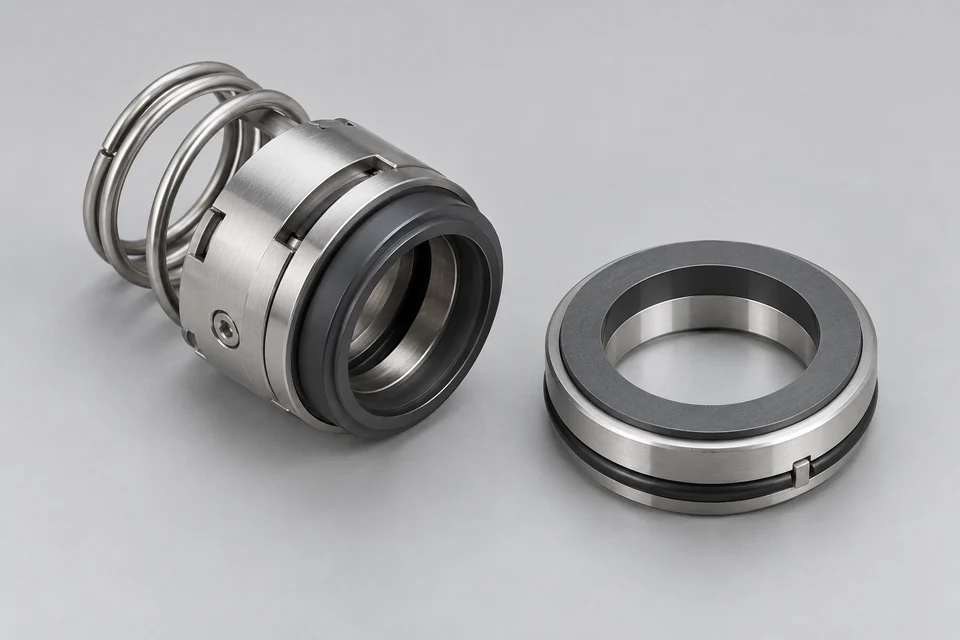
Mechanical seal refers to at least a pair of end faces perpendicular to the axis of rotation in the fluid pressure and compensation mechanism of elasticity (or magnetic force) and auxiliary seals to maintain the fit and relative sliding under the cooperation of the device to prevent fluid leakage. The working principle of mechanical seal is under the action of spring force and medium pressure, the two sealing end surfaces closely fit so that the junction between the sealing end surfaces forms a continuous (non-contact) or intermittent (contact) of the liquid film or gas film, forming a seal of the pressurized medium.
Contact mechanical seal is the earliest and most used class of mechanical face seal. The basic elements of the contact mechanical seal include friction, compensation mechanism, auxiliary sealing ring, and transmission anti-rotation mechanism. Friction includes rotating ring (dynamic ring) and stationary ring (static ring); compensation mechanism consists of elastic components, such as springs, bellows, etc.; auxiliary seals include dynamic ring sealing ring, static ring sealing ring, gland sealing ring, etc.; transmission and anti-rotation mechanism includes transmission pin, anti-rotation pin, locking transmission device. A dry gas seal is a new non-contact mechanical seal using gas lubrication to seal the end face. A dry gas seal is a new type of advanced, non-contact mechanical end seal developed in the late 1960s based on gas dynamic pressure bearing. Dry gas seals utilize the principle of fluid dynamics to realize the non-contact operation of the sealing face by opening a dynamic pressure groove on the sealing face.
In 1885, mechanical seals first appeared in England as a patent. After entering the 20th century, mechanical seals began to be gradually applied in industrial production activities, along with upstream basic materials, sealing theory, downstream industry needs, and other continuous innovations and developments.
Mechanical seals can be divided into Compressor Mechanical Seals, Pump Mechanical Seals, Mixer Mechanical Seals, Turbine Mechanical Seals, and other types according to the kind of equipment; the type of seal (according to the structure and design of the form of classification) can be divided into According to seal types (categorized by structure and design form), they can be divided into Spring Seals, Split Seals, Bellow Seals, Cartridge Seals, and other types.
Mechanical seals are widely used in downstream industries: as one of the basic parts of the host, they are commonly used in Oil and Gas, Chemicals, Water Treatment, Paper and Pulp, Pharmaceuticals, and other industries. The downstream customers mainly include mechanical seal modification, spare parts sales, and seal product repair for the existing units of petrochemicals, coal chemicals, and other end customers, as well as supporting mechanical seals for the units of host plants.
Main features of the industry
①Large-scale, high-parameter, and high-reliability mechanical seal products have become the development trend. With the improvement of the globalization of the equipment manufacturing industry, large-scale petrochemical complete sets of equipment, large-scale LNG complete sets of equipment, deep-sea and deep-earth oil and gas resources extraction equipment, such as large-scale, large-scale, green, integrated, high-parameter high-end demand for mechanical seals continues to increase, especially large-scale petrochemical, aerospace, nuclear, special pumps and other high-end equipment in the industry on the mechanical seals of the technical requirements of the increasingly high. Seal products and sealing technology are expected to focus on the following three directions: according to the host production process parameters for special design, personalized design and manufacturing, research and development of new processes applicable to high-parameter, high-performance seals and sealing materials, sealing devices in extreme operating conditions and the best design conditions for long cycles of safe and stable operation.
②Stricter leakage detection standards, longer operating life. Due to the mechanical seal's customer awareness of energy saving and environmental protection, the mechanical seals from the past purely controlled the amount of liquid leakage to the current control of gas volatiles escape, the requirements to achieve a real “zero leakage”, “zero escape”, to ensure production safety, to achieve environmental protection. At the same time, to meet the host's long cycle of stable operation and improve the host's operating efficiency, the mechanical seal service life requirements are longer to extend the host's maintenance cycle and operation cycle.
③From the past to emphasize the development of a separate seal body to the importance of the entire seal system, including the seal body and sealing the auxiliary system. In fluid machinery, the mechanical seal is one of the most demanding working conditions of the components; in high temperatures, high pressure, easy to corrode, high-speed rotation of the working environment to achieve the seal is very difficult, but also difficult to seal dynamic monitoring. The reasonable use of a sealing auxiliary system improves the working environment of the seal, can greatly extend the service life of mechanical seals, enhances the reliability of mechanical seals, and expands the application range of mechanical seals.
In different industries, the working environment of the host and working conditions are characterized by different; even in the same industry, there are differences in customer requirements for the host. Therefore, the mechanical seal industry has a typical personalized customized production characteristic. The general business model is for mechanical seal manufacturers to participate in the host plant, design institute, and end customer bidding; in determining the winning enterprise, the two sides sign a technical agreement or contract; mechanical seal manufacturers according to the specific needs of different customers to carry out the technical design of the product, the organization of the production, after the factory test delivered to the customer to use. As mechanical seals are a kind of wearing parts, customers usually need to replace new seals after a certain period of use or repair the seal products of high value; in this case, the company will sign a supply contract directly with the end customer.
For the entire sealing industry, the market can be divided into the incremental market and stock market, of which the incremental market refers to the new project supporting the market. Usually, this kind of market directs customers for the host machine equipment manufacturers, such as compressor plants, pumps, mixing kettle manufacturers, etc., mechanical seals downstream of the industry's investment in fixed assets and technological transformation projects determine the incremental demand for mechanical seals in the market. Incremental business for the industry guarantees future performance growth, and its market competition is very fierce.
The stock market refers to the petrochemical plant that has entered the driving state due to normal wear and tear and the need to regularly replace the seal products of the market. Direct customers for petrochemical companies, such as SABIC, Mobil, Sinopec, PetroChina, INEOS, and so on, typically maintain a high gross margin and a more stable modest revenue growth.
Mechanical seals are worn parts, especially for high temperature, high pressure, high speed, toxic, and other media. Mechanical seals usually need to be replaced every 1-3 years, so the stock market demand for mechanical seals is more stable. Mechanical seals industry market demand and industrial investment in fixed assets are closely related to the situation, directly affected by the host equipment corresponding to the downstream industry market demand. When the fixed asset investment expansion, the mechanical seal industry, the downstream terminal sector will produce linked growth and drive the mechanical seal industry market demand expansion.
The oil and gas industry accounted for 41.32% and 41.42% of the mechanical seals market in 2022 and 2023, respectively, showing a steady growth trend. Supported by strong asset utilization, improved repair and maintenance spending by mechanical seal customers in 2023, and larger project activity and short-cycle investments that will continue to support global demand, the outlook for the oil and gas industry is highly dependent on the overall macroeconomic environment, including fuel demand, demand growth in mature markets and developing regions, and changes in the regulatory environment.
The chemical industry accounted for 23.22% and 23.19% of the mechanical seals market in 2022 and 2023, respectively. The slight share reduction is related to the current tensions and political unrest in the energy sector, with customer spending remaining resilient for the third consecutive year in 2023, following the negative impact of the 2020 pandemic on demand for chemical products. Customer repair and maintenance budgets have improved, and mechanical seal bookings have broadly returned to pre-pandemic levels in 2023 and 2022. The outlook for the chemical industry remains heavily dependent on global economic conditions. As global economic and unemployment conditions improve, consumer spending should increase in response. Increased spending will drive greater demand for basic and specialty chemicals.
Mechanical Seals are categorized based on device type into Compressor Mechanical Seals, Pump Mechanical Seals, Mixer Mechanical Seals, Turbine Mechanical Seals, etc., with Pump Mechanical Seals being the largest classification. It will account for approximately 38% of the market share in 2023, followed by Compressor Mechanical Seals at 30%. Seal type is categorized into Spring Seals, Split Seals, Bellow Seals, Cartridge Seals, etc. Cartridge Seals will account for about 42% market share in 2023, followed by Spring Seals at 22%.
The global market for Mechanical Seals was estimated to be worth USD 4,630.23 million in 2023 and is forecast to a readjusted size of USD 6,811.79 million by 2030 with a CAGR of 4.94% during the forecast period 2024-2030.
The North American market for Mechanical Seals was valued at $1,193.09 million in 2023 and will reach $1,737.97 million by 2030, at a CAGR of 4.86 % from 2024 through 2030.
The European market for Mechanical Seals was valued at $1,379.15 million in 2023 and will reach $1,984.95 million by 2030, at a CAGR of 4.58 % from 2024 through 2030.
Electrical or electromechanical components must be evaluated under the specified voltage, current, switching, thermal and environmental duty. Component rating and the capacity of a complete installed system describe different boundaries.
What turns activity into demand
Qualified installations and replacement needs create orders through the required electrical duty and system configuration. Nameplate capacity, delivered equipment and useful operating output are distinct measures.
The commercial boundary
For Mechanical Seals, distinguish the supplied product from its inputs and the complete application. Report types and applications may overlap; retain the selected edition's product definition, geography, period, unit and transaction basis when comparing estimates.
Which conditions determine usable mechanical seals performance?
Mechanical seal refers to at least a pair of end faces perpendicular to the axis of rotation in the fluid pressure and compensation mechanism of elasticity (or magnetic force) and auxiliary seals to maintain the fit and relative sliding under the cooperation of the device to prevent fluid leakage. Read continuous and transient behaviour together with protection, thermal management and the connected load. Separate the individual device from controllers, installation and complete equipment when comparing market quantity or value.
Selected research
Industry Growth & Trends
Global Mechanical Seals Industry Growth and Trends Forecast to 2032
Market perspective
Mechanical seal refers to at least a pair of end faces perpendicular to the axis of rotation in the fluid pressure and compensation mechanism of elasticity (or magnetic force) and auxiliary seals to maintain the fit and relative sliding under the cooperation of the device to prevent fluid leakage. The working principle of mechanical seal is under the action of spring force and medium pressure, the two sealing end surfaces closely fit so that the junction between the sealing end surfaces forms a continuous (non-contact) or intermittent (contact) of the liquid film or gas film, forming a seal of the pressurized medium.
Contact mechanical seal is the earliest and most used class of mechanical face seal. The basic elements of the contact mechanical seal include friction, compensation mechanism, auxiliary sealing ring, and transmission anti-rotation mechanism. Friction includes rotating ring (dynamic ring) and stationary ring (static ring); compensation mechanism consists of elastic components, such as springs, bellows, etc.; auxiliary seals include dynamic ring sealing ring, static ring sealing ring, gland sealing ring, etc.; transmission and anti-rotation mechanism includes transmission pin, anti-rotation pin, locking transmission device. A dry gas seal is a new non-contact mechanical seal using gas lubrication to seal the end face. A dry gas seal is a new type of advanced, non-contact mechanical end seal developed in the late 1960s based on gas dynamic pressure bearing. Dry gas seals utilize the principle of fluid dynamics to realize the non-contact operation of the sealing face by opening a dynamic pressure groove on the sealing face.
In 1885, mechanical seals first appeared in England as a patent. After entering the 20th century, mechanical seals began to be gradually applied in industrial production activities, along with upstream basic materials, sealing theory, downstream industry needs, and other continuous innovations and developments.
Read the full market overview
Mechanical seals can be divided into Compressor Mechanical Seals, Pump Mechanical Seals, Mixer Mechanical Seals, Turbine Mechanical Seals, and other types according to the kind of equipment; the type of seal (according to the structure and design of the form of classification) can be divided into According to seal types (categorized by structure and design form), they can be divided into Spring Seals, Split Seals, Bellow Seals, Cartridge Seals, and other types.
Mechanical seals are widely used in downstream industries: as one of the basic parts of the host, they are commonly used in Oil and Gas, Chemicals, Water Treatment, Paper and Pulp, Pharmaceuticals, and other industries. The downstream customers mainly include mechanical seal modification, spare parts sales, and seal product repair for the existing units of petrochemicals, coal chemicals, and other end customers, as well as supporting mechanical seals for the units of host plants.
Main features of the industry
①Large-scale, high-parameter, and high-reliability mechanical seal products have become the development trend. With the improvement of the globalization of the equipment manufacturing industry, large-scale petrochemical complete sets of equipment, large-scale LNG complete sets of equipment, deep-sea and deep-earth oil and gas resources extraction equipment, such as large-scale, large-scale, green, integrated, high-parameter high-end demand for mechanical seals continues to increase, especially large-scale petrochemical, aerospace, nuclear, special pumps and other high-end equipment in the industry on the mechanical seals of the technical requirements of the increasingly high. Seal products and sealing technology are expected to focus on the following three directions: according to the host production process parameters for special design, personalized design and manufacturing, research and development of new processes applicable to high-parameter, high-performance seals and sealing materials, sealing devices in extreme operating conditions and the best design conditions for long cycles of safe and stable operation.
②Stricter leakage detection standards, longer operating life. Due to the mechanical seal's customer awareness of energy saving and environmental protection, the mechanical seals from the past purely controlled the amount of liquid leakage to the current control of gas volatiles escape, the requirements to achieve a real “zero leakage”, “zero escape”, to ensure production safety, to achieve environmental protection. At the same time, to meet the host's long cycle of stable operation and improve the host's operating efficiency, the mechanical seal service life requirements are longer to extend the host's maintenance cycle and operation cycle.
③From the past to emphasize the development of a separate seal body to the importance of the entire seal system, including the seal body and sealing the auxiliary system. In fluid machinery, the mechanical seal is one of the most demanding working conditions of the components; in high temperatures, high pressure, easy to corrode, high-speed rotation of the working environment to achieve the seal is very difficult, but also difficult to seal dynamic monitoring. The reasonable use of a sealing auxiliary system improves the working environment of the seal, can greatly extend the service life of mechanical seals, enhances the reliability of mechanical seals, and expands the application range of mechanical seals.
In different industries, the working environment of the host and working conditions are characterized by different; even in the same industry, there are differences in customer requirements for the host. Therefore, the mechanical seal industry has a typical personalized customized production characteristic. The general business model is for mechanical seal manufacturers to participate in the host plant, design institute, and end customer bidding; in determining the winning enterprise, the two sides sign a technical agreement or contract; mechanical seal manufacturers according to the specific needs of different customers to carry out the technical design of the product, the organization of the production, after the factory test delivered to the customer to use. As mechanical seals are a kind of wearing parts, customers usually need to replace new seals after a certain period of use or repair the seal products of high value; in this case, the company will sign a supply contract directly with the end customer.
For the entire sealing industry, the market can be divided into the incremental market and stock market, of which the incremental market refers to the new project supporting the market. Usually, this kind of market directs customers for the host machine equipment manufacturers, such as compressor plants, pumps, mixing kettle manufacturers, etc., mechanical seals downstream of the industry's investment in fixed assets and technological transformation projects determine the incremental demand for mechanical seals in the market. Incremental business for the industry guarantees future performance growth, and its market competition is very fierce.
The stock market refers to the petrochemical plant that has entered the driving state due to normal wear and tear and the need to regularly replace the seal products of the market. Direct customers for petrochemical companies, such as SABIC, Mobil, Sinopec, PetroChina, INEOS, and so on, typically maintain a high gross margin and a more stable modest revenue growth.
Mechanical seals are worn parts, especially for high temperature, high pressure, high speed, toxic, and other media. Mechanical seals usually need to be replaced every 1-3 years, so the stock market demand for mechanical seals is more stable. Mechanical seals industry market demand and industrial investment in fixed assets are closely related to the situation, directly affected by the host equipment corresponding to the downstream industry market demand. When the fixed asset investment expansion, the mechanical seal industry, the downstream terminal sector will produce linked growth and drive the mechanical seal industry market demand expansion.
The oil and gas industry accounted for 41.32% and 41.42% of the mechanical seals market in 2022 and 2023, respectively, showing a steady growth trend. Supported by strong asset utilization, improved repair and maintenance spending by mechanical seal customers in 2023, and larger project activity and short-cycle investments that will continue to support global demand, the outlook for the oil and gas industry is highly dependent on the overall macroeconomic environment, including fuel demand, demand growth in mature markets and developing regions, and changes in the regulatory environment.
The chemical industry accounted for 23.22% and 23.19% of the mechanical seals market in 2022 and 2023, respectively. The slight share reduction is related to the current tensions and political unrest in the energy sector, with customer spending remaining resilient for the third consecutive year in 2023, following the negative impact of the 2020 pandemic on demand for chemical products. Customer repair and maintenance budgets have improved, and mechanical seal bookings have broadly returned to pre-pandemic levels in 2023 and 2022. The outlook for the chemical industry remains heavily dependent on global economic conditions. As global economic and unemployment conditions improve, consumer spending should increase in response. Increased spending will drive greater demand for basic and specialty chemicals.
Mechanical Seals are categorized based on device type into Compressor Mechanical Seals, Pump Mechanical Seals, Mixer Mechanical Seals, Turbine Mechanical Seals, etc., with Pump Mechanical Seals being the largest classification. It will account for approximately 38% of the market share in 2023, followed by Compressor Mechanical Seals at 30%. Seal type is categorized into Spring Seals, Split Seals, Bellow Seals, Cartridge Seals, etc. Cartridge Seals will account for about 42% market share in 2023, followed by Spring Seals at 22%.
The global market for Mechanical Seals was estimated to be worth USD 4,630.23 million in 2023 and is forecast to a readjusted size of USD 6,811.79 million by 2030 with a CAGR of 4.94% during the forecast period 2024-2030.
The North American market for Mechanical Seals was valued at $1,193.09 million in 2023 and will reach $1,737.97 million by 2030, at a CAGR of 4.86 % from 2024 through 2030.
The European market for Mechanical Seals was valued at $1,379.15 million in 2023 and will reach $1,984.95 million by 2030, at a CAGR of 4.58 % from 2024 through 2030.
The global Mechanical Seals market was valued at US$ million in 2026 and is projected to reach US$ million by 2032, implying a CAGR of xx% over 2026-2032.
The North America market for Mechanical Seals is projected to increase from US$ million in 2026 to US$ million by 2032, corresponding to a CAGR of % over 2026-2032.
The Europe market for Mechanical Seals is projected to increase from US$ million in 2026 to US$ million by 2032, registering a CAGR of % over 2026-2032.
The Asia Pacific market for Mechanical Seals is projected to increase from US$ million in 2026 to US$ million by 2032, at a CAGR of % over 2026-2032.
Leading global manufacturers of Mechanical Seals include John Crane, EagleBurgmann, Flowserve, AESSEAL, Garlock, Sunnyseal, Colossus, Torishima and KSB, among others. In 2025, the top three vendors together accounted for approximately % of global revenue.
Report Scope
This report provides a structured, data-driven view of the global Mechanical Seals market, combining harmonized quantitative metrics with targeted qualitative insight to support business and growth strategy, market positioning, and capital allocation.
The Mechanical Seals market size, estimates, and forecasts are presented in terms of sales volume (K Units) and revenue (US$ million), with 2025 as the base year and historical and forecast data for 2021-2032. The report segments the global Mechanical Seals market by Type, Application, region/country, and company, provides regional market sizes at the segment level, profiles the competitive landscape and key players and their market ranks, and reviews technology trends and new product developments relevant to Mechanical Seals.
Key Companies & Market Share Insights
This section analyzes the strategies and performance of leading manufacturers in the global Mechanical Seals market, including portfolio focus, innovation and product development, mergers and acquisitions, collaborations, and geographic expansion used to sustain or enhance competitive positions. It also summarizes recent corporate developments and key financial indicators and provides global revenue, price, and sales volume data by manufacturer for 2020-2025, enabling benchmarking of scale, pricing, and market share and supporting assessment of market concentration through indicators such as CR5 and CR10.
Mechanical Seals Market by Company
John Crane
EagleBurgmann
Flowserve
AESSEAL
Garlock
Sunnyseal
Colossus
Torishima
KSB
Meccanotecnica Umbra
Sulzer
Flex-A-Seal
Chesterton
Valmet
Ekato
PILLAR
Xi'an Yonghua
Fluiten
Tanken Seal
Huhnseal AB
Mechanical Seals Segment by Type
Compressor Mechanical Seals
Pump Mechanical Seals
Mixer Mechanical Seals
Turbine Mechanical Seals
Other
Mechanical Seals Segment by Application
Oil and Gas
Chemicals
Water Treatment
Paper and Pulp
Food and Beverages
Pharmaceuticals
Mining and Mineral Processing
Other
Mechanical Seals Segment by Region
North America
United States
Canada
Mexico
Europe
Germany
France
U.K.
Italy
Russia
Spain
Netherlands
Switzerland
Sweden
Poland
Asia-Pacific
China
Japan
South Korea
India
Australia
Taiwan
Southeast Asia
South America
Brazil
Argentina
Chile
Middle East & Africa
Egypt
South Africa
Israel
Türkiye
GCC Countries
Key Drivers & Barriers
High-impact rendering factors and drivers have been studied in this report to aid the readers to understand the general development. Moreover, the report includes restraints and challenges that may act as stumbling blocks on the way of the players. This will assist the users to be attentive and make informed decisions related to business. Specialists have also laid their focus on the upcoming business prospects.
Reasons to Buy This Report
1. This report will help the readers to understand the competition within the industries and strategies for the competitive environment to enhance the potential profit. The report also focuses on the competitive landscape of the global Mechanical Seals market, and introduces in detail the market share, industry ranking, competitor ecosystem, market performance, new product development, operation situation, expansion, and acquisition. etc. of the main players, which helps the readers to identify the main competitors and deeply understand the competition pattern of the market.
2. This report will help stakeholders to understand the global industry status and trends of Mechanical Seals and provides them with information on key market drivers, restraints, challenges, and opportunities.
3. This report will help stakeholders to understand competitors better and gain more insights to strengthen their position in their businesses. The competitive landscape section includes the market share and rank (in volume and value), competitor ecosystem, new product development, expansion, and acquisition.
4. This report stays updated with novel technology integration, features, and the latest developments in the market.
5. This report helps stakeholders to gain insights into which regions to target globally.
6. This report helps stakeholders to gain insights into the end-user perception concerning the adoption of Mechanical Seals.
7. This report helps stakeholders to identify some of the key players in the market and understand their valuable contribution.
Chapter Outline
Chapter 1: Introduces the study scope of this report, executive summary of market segments by type, market size segments for North America, Europe, Asia Pacific, South America, Middle East & Africa.
Chapter 2: Introduces the market dynamics, latest developments of the market, the driving factors and restrictive factors of the market, the challenges and risks faced by manufacturers in the industry, and the analysis of relevant policies in the industry.
Chapter 3: Detailed analysis of Mechanical Seals manufacturers competitive landscape, price, sales, revenue, market share and ranking, latest development plan, merger, and acquisition information, etc.
Chapter 4: Sales, revenue of Mechanical Seals in regional level. It provides a quantitative analysis of the market size and development potential of each region and introduces the future development prospects, and market space in the world.
Chapter 5: Introduces market segments by application, market size segment for North America, Europe, Asia Pacific, South America, Middle East & Africa.
Chapter 6: Provides profiles of key players, introducing the basic situation of the main companies in the market in detail, including product sales, revenue, price, gross margin, product introduction, recent development, etc.
Chapter 7, 8, 9, 10 and 11: North America, Europe, Asia Pacific, South America, Middle East & Africa, sales and revenue by country.
Chapter 12: Analysis of industrial chain, key raw materials, manufacturing cost, and market dynamics.
Chapter 13: Concluding Insights of the report.
More report detail
Tables and figures
Scope & coverage.
Types
- Compressor Mechanical Seals
- Pump Mechanical Seals
- Mixer Mechanical Seals
- Turbine Mechanical Seals
- Other
Applications
- Oil and Gas
- Chemicals
- Water Treatment
- Paper and Pulp
- Food and Beverages
- Pharmaceuticals
- Mining and Mineral Processing
- Other
Companies covered
- John Crane
- EagleBurgmann
- Flowserve
- AESSEAL
- Garlock
- Sunnyseal
- Colossus
- Torishima
- KSB
- Meccanotecnica Umbra
- Sulzer
- Flex-A-Seal
- Chesterton
- Valmet
- Ekato
- PILLAR
- Xi'an Yonghua
- Fluiten
- Tanken Seal
- Huhnseal AB
Inside the report.
1 Market Overview
- 1.1 Product Definition
- 1.2 Global Market Growth Prospects
- 1.2.1 Global Mechanical Seals Market Size Estimates and Forecasts (2021-2032)
- 1.2.2 Global Mechanical Seals Sales Estimates and Forecasts (2021-2032)
- 1.3 Mechanical Seals Market by Type
- 1.3.1 Compressor Mechanical Seals
- 1.3.2 Pump Mechanical Seals
- 1.3.3 Mixer Mechanical Seals
- 1.3.4 Turbine Mechanical Seals
- 1.3.5 Other
- 1.4 Global Mechanical Seals Market Size by Type
- 1.4.1 Global Mechanical Seals Market Size Overview by Type (2021-2032)
- 1.4.2 Global Mechanical Seals Historic Market Size Review by Type (2021-2026)
- 1.4.3 Global Mechanical Seals Forecasted Market Size by Type (2027-2032)
- 1.5 Key Regions Market Size by Type
- 1.5.1 North America Mechanical Seals Sales Breakdown by Type (2021-2026)
- 1.5.2 Europe Mechanical Seals Sales Breakdown by Type (2021-2026)
- 1.5.3 Asia-Pacific Mechanical Seals Sales Breakdown by Type (2021-2026)
- 1.5.4 South America Mechanical Seals Sales Breakdown by Type (2021-2026)
- 1.5.5 Middle East and Africa Mechanical Seals Sales Breakdown by Type (2021-2026)
2 Global Market Dynamics
- 2.1 Mechanical Seals Industry Trends
- 2.2 Mechanical Seals Industry Drivers
- 2.3 Mechanical Seals Industry Opportunities and Challenges
- 2.4 Mechanical Seals Industry Restraints
3 Market Competitive Landscape by Company
- 3.1 Global Top Players by Mechanical Seals Revenue (2021-2026)
- 3.2 Global Top Players by Mechanical Seals Sales (2021-2026)
- 3.3 Global Top Players by Mechanical Seals Price (2021-2026)
- 3.4 Global Mechanical Seals Industry Company Ranking, 2024 VS 2025 VS 2026
- 3.5 Global Mechanical Seals Major Company Production Sites & Headquarters
- 3.6 Global Mechanical Seals Company, Product Type & Application
- 3.7 Global Mechanical Seals Company Establishment Date
- 3.8 Market Competitive Analysis
- 3.8.1 Global Mechanical Seals Market CR5 and HHI
- 3.8.2 Global Top 5 and 10 Mechanical Seals Players Market Share by Revenue in 2025
- 3.8.3 2025 Mechanical Seals Tier 1, Tier 2, and Tier 3
4 Mechanical Seals Regional Status and Outlook
- 4.1 Global Mechanical Seals Market Size and CAGR by Region: 2021 VS 2025 VS 2032
- 4.2 Global Mechanical Seals Historic Market Size by Region
- 4.2.1 Global Mechanical Seals Sales in Volume by Region (2021-2026)
- 4.2.2 Global Mechanical Seals Sales in Value by Region (2021-2026)
- 4.2.3 Global Mechanical Seals Sales (Volume & Value), Price and Gross Margin (2021-2026)
- 4.3 Global Mechanical Seals Forecasted Market Size by Region
- 4.3.1 Global Mechanical Seals Sales in Volume by Region (2027-2032)
- 4.3.2 Global Mechanical Seals Sales in Value by Region (2027-2032)
- 4.3.3 Global Mechanical Seals Sales (Volume & Value), Price and Gross Margin (2027-2032)
5 Mechanical Seals by Application
- 5.1 Mechanical Seals Market by Application
- 5.1.1 Oil and Gas
- 5.1.2 Chemicals
- 5.1.3 Water Treatment
- 5.1.4 Paper and Pulp
- 5.1.5 Food and Beverages
- 5.1.6 Pharmaceuticals
- 5.1.7 Mining and Mineral Processing
- 5.1.8 Other
- 5.2 Global Mechanical Seals Market Size by Application
- 5.2.1 Global Mechanical Seals Market Size Overview by Application (2021-2032)
- 5.2.2 Global Mechanical Seals Historic Market Size Review by Application (2021-2026)
- 5.2.3 Global Mechanical Seals Forecasted Market Size by Application (2027-2032)
- 5.3 Key Regions Market Size by Application
- 5.3.1 North America Mechanical Seals Sales Breakdown by Application (2021-2026)
- 5.3.2 Europe Mechanical Seals Sales Breakdown by Application (2021-2026)
- 5.3.3 Asia-Pacific Mechanical Seals Sales Breakdown by Application (2021-2026)
- 5.3.4 South America Mechanical Seals Sales Breakdown by Application (2021-2026)
- 5.3.5 Middle East and Africa Mechanical Seals Sales Breakdown by Application (2021-2026)
6 Company Profiles
- 6.1 John Crane
- 6.1.1 John Crane Company Information
- 6.1.2 John Crane Business Overview
- 6.1.3 John Crane Mechanical Seals Sales, Revenue and Gross Margin (2021-2026)
- 6.1.4 John Crane Mechanical Seals Product Portfolio
- 6.1.5 John Crane Recent Developments
- 6.2 EagleBurgmann
- 6.2.1 EagleBurgmann Company Information
- 6.2.2 EagleBurgmann Business Overview
- 6.2.3 EagleBurgmann Mechanical Seals Sales, Revenue and Gross Margin (2021-2026)
- 6.2.4 EagleBurgmann Mechanical Seals Product Portfolio
- 6.2.5 EagleBurgmann Recent Developments
- 6.3 Flowserve
- 6.3.1 Flowserve Company Information
- 6.3.2 Flowserve Business Overview
- 6.3.3 Flowserve Mechanical Seals Sales, Revenue and Gross Margin (2021-2026)
- 6.3.4 Flowserve Mechanical Seals Product Portfolio
- 6.3.5 Flowserve Recent Developments
- 6.4 AESSEAL
- 6.4.1 AESSEAL Company Information
- 6.4.2 AESSEAL Business Overview
- 6.4.3 AESSEAL Mechanical Seals Sales, Revenue and Gross Margin (2021-2026)
- 6.4.4 AESSEAL Mechanical Seals Product Portfolio
- 6.4.5 AESSEAL Recent Developments
- 6.5 Garlock
- 6.5.1 Garlock Company Information
- 6.5.2 Garlock Business Overview
- 6.5.3 Garlock Mechanical Seals Sales, Revenue and Gross Margin (2021-2026)
- 6.5.4 Garlock Mechanical Seals Product Portfolio
- 6.5.5 Garlock Recent Developments
- 6.6 Sunnyseal
- 6.6.1 Sunnyseal Company Information
- 6.6.2 Sunnyseal Business Overview
- 6.6.3 Sunnyseal Mechanical Seals Sales, Revenue and Gross Margin (2021-2026)
- 6.6.4 Sunnyseal Mechanical Seals Product Portfolio
- 6.6.5 Sunnyseal Recent Developments
- 6.7 Colossus
- 6.7.1 Colossus Company Information
- 6.7.2 Colossus Business Overview
- 6.7.3 Colossus Mechanical Seals Sales, Revenue and Gross Margin (2021-2026)
- 6.7.4 Colossus Mechanical Seals Product Portfolio
- 6.7.5 Colossus Recent Developments
- 6.8 Torishima
- 6.8.1 Torishima Company Information
- 6.8.2 Torishima Business Overview
- 6.8.3 Torishima Mechanical Seals Sales, Revenue and Gross Margin (2021-2026)
- 6.8.4 Torishima Mechanical Seals Product Portfolio
- 6.8.5 Torishima Recent Developments
- 6.9 KSB
- 6.9.1 KSB Company Information
- 6.9.2 KSB Business Overview
- 6.9.3 KSB Mechanical Seals Sales, Revenue and Gross Margin (2021-2026)
- 6.9.4 KSB Mechanical Seals Product Portfolio
- 6.9.5 KSB Recent Developments
- 6.10 Meccanotecnica Umbra
- 6.10.1 Meccanotecnica Umbra Company Information
- 6.10.2 Meccanotecnica Umbra Business Overview
- 6.10.3 Meccanotecnica Umbra Mechanical Seals Sales, Revenue and Gross Margin (2021-2026)
- 6.10.4 Meccanotecnica Umbra Mechanical Seals Product Portfolio
- 6.10.5 Meccanotecnica Umbra Recent Developments
- 6.11 Sulzer
- 6.11.1 Sulzer Company Information
- 6.11.2 Sulzer Business Overview
- 6.11.3 Sulzer Mechanical Seals Sales, Revenue and Gross Margin (2021-2026)
- 6.11.4 Sulzer Mechanical Seals Product Portfolio
- 6.11.5 Sulzer Recent Developments
- 6.12 Flex-A-Seal
- 6.12.1 Flex-A-Seal Company Information
- 6.12.2 Flex-A-Seal Business Overview
- 6.12.3 Flex-A-Seal Mechanical Seals Sales, Revenue and Gross Margin (2021-2026)
- 6.12.4 Flex-A-Seal Mechanical Seals Product Portfolio
- 6.12.5 Flex-A-Seal Recent Developments
- 6.13 Chesterton
- 6.13.1 Chesterton Company Information
- 6.13.2 Chesterton Business Overview
- 6.13.3 Chesterton Mechanical Seals Sales, Revenue and Gross Margin (2021-2026)
- 6.13.4 Chesterton Mechanical Seals Product Portfolio
- 6.13.5 Chesterton Recent Developments
- 6.14 Valmet
- 6.14.1 Valmet Company Information
- 6.14.2 Valmet Business Overview
- 6.14.3 Valmet Mechanical Seals Sales, Revenue and Gross Margin (2021-2026)
- 6.14.4 Valmet Mechanical Seals Product Portfolio
- 6.14.5 Valmet Recent Developments
- 6.15 Ekato
- 6.15.1 Ekato Company Information
- 6.15.2 Ekato Business Overview
- 6.15.3 Ekato Mechanical Seals Sales, Revenue and Gross Margin (2021-2026)
- 6.15.4 Ekato Mechanical Seals Product Portfolio
- 6.15.5 Ekato Recent Developments
- 6.16 PILLAR
- 6.16.1 PILLAR Company Information
- 6.16.2 PILLAR Business Overview
- 6.16.3 PILLAR Mechanical Seals Sales, Revenue and Gross Margin (2021-2026)
- 6.16.4 PILLAR Mechanical Seals Product Portfolio
- 6.16.5 PILLAR Recent Developments
- 6.17 Xi'an Yonghua
- 6.17.1 Xi'an Yonghua Company Information
- 6.17.2 Xi'an Yonghua Business Overview
- 6.17.3 Xi'an Yonghua Mechanical Seals Sales, Revenue and Gross Margin (2021-2026)
- 6.17.4 Xi'an Yonghua Mechanical Seals Product Portfolio
- 6.17.5 Xi'an Yonghua Recent Developments
- 6.18 Fluiten
- 6.18.1 Fluiten Company Information
- 6.18.2 Fluiten Business Overview
- 6.18.3 Fluiten Mechanical Seals Sales, Revenue and Gross Margin (2021-2026)
- 6.18.4 Fluiten Mechanical Seals Product Portfolio
- 6.18.5 Fluiten Recent Developments
- 6.19 Tanken Seal
- 6.19.1 Tanken Seal Company Information
- 6.19.2 Tanken Seal Business Overview
- 6.19.3 Tanken Seal Mechanical Seals Sales, Revenue and Gross Margin (2021-2026)
- 6.19.4 Tanken Seal Mechanical Seals Product Portfolio
- 6.19.5 Tanken Seal Recent Developments
- 6.20 Huhnseal AB
- 6.20.1 Huhnseal AB Company Information
- 6.20.2 Huhnseal AB Business Overview
- 6.20.3 Huhnseal AB Mechanical Seals Sales, Revenue and Gross Margin (2021-2026)
- 6.20.4 Huhnseal AB Mechanical Seals Product Portfolio
- 6.20.5 Huhnseal AB Recent Developments
7 North America by Country
- 7.1 North America Mechanical Seals Sales by Country
- 7.1.1 North America Mechanical Seals Sales Growth Rate (CAGR) by Country: 2021 VS 2025 VS 2032
- 7.1.2 North America Mechanical Seals Sales by Country (2021-2026)
- 7.1.3 North America Mechanical Seals Sales Forecast by Country (2027-2032)
- 7.2 North America Mechanical Seals Market Size by Country
- 7.2.1 North America Mechanical Seals Market Size Growth Rate (CAGR) by Country: 2021 VS 2025 VS 2032
- 7.2.2 North America Mechanical Seals Market Size by Country (2021-2026)
- 7.2.3 North America Mechanical Seals Market Size Forecast by Country (2027-2032)
8 Europe by Country
- 8.1 Europe Mechanical Seals Sales by Country
- 8.1.1 Europe Mechanical Seals Sales Growth Rate (CAGR) by Country: 2021 VS 2025 VS 2032
- 8.1.2 Europe Mechanical Seals Sales by Country (2021-2026)
- 8.1.3 Europe Mechanical Seals Sales Forecast by Country (2027-2032)
- 8.2 Europe Mechanical Seals Market Size by Country
- 8.2.1 Europe Mechanical Seals Market Size Growth Rate (CAGR) by Country: 2021 VS 2025 VS 2032
- 8.2.2 Europe Mechanical Seals Market Size by Country (2021-2026)
- 8.2.3 Europe Mechanical Seals Market Size Forecast by Country (2027-2032)
9 Asia-Pacific by Country
- 9.1 Asia-Pacific Mechanical Seals Sales by Country
- 9.1.1 Asia-Pacific Mechanical Seals Sales Growth Rate (CAGR) by Country: 2021 VS 2025 VS 2032
- 9.1.2 Asia-Pacific Mechanical Seals Sales by Country (2021-2026)
- 9.1.3 Asia-Pacific Mechanical Seals Sales Forecast by Country (2027-2032)
- 9.2 Asia-Pacific Mechanical Seals Market Size by Country
- 9.2.1 Asia-Pacific Mechanical Seals Market Size Growth Rate (CAGR) by Country: 2021 VS 2025 VS 2032
- 9.2.2 Asia-Pacific Mechanical Seals Market Size by Country (2021-2026)
- 9.2.3 Asia-Pacific Mechanical Seals Market Size Forecast by Country (2027-2032)
10 South America by Country
- 10.1 South America Mechanical Seals Sales by Country
- 10.1.1 South America Mechanical Seals Sales Growth Rate (CAGR) by Country: 2021 VS 2025 VS 2032
- 10.1.2 South America Mechanical Seals Sales by Country (2021-2026)
- 10.1.3 South America Mechanical Seals Sales Forecast by Country (2027-2032)
- 10.2 South America Mechanical Seals Market Size by Country
- 10.2.1 South America Mechanical Seals Market Size Growth Rate (CAGR) by Country: 2021 VS 2025 VS 2032
- 10.2.2 South America Mechanical Seals Market Size by Country (2021-2026)
- 10.2.3 South America Mechanical Seals Market Size Forecast by Country (2027-2032)
11 Middle East and Africa by Country
- 11.1 Middle East and Africa Mechanical Seals Sales by Country
- 11.1.1 Middle East and Africa Mechanical Seals Sales Growth Rate (CAGR) by Country: 2021 VS 2025 VS 2032
- 11.1.2 Middle East and Africa Mechanical Seals Sales by Country (2021-2026)
- 11.1.3 Middle East and Africa Mechanical Seals Sales Forecast by Country (2027-2032)
- 11.2 Middle East and Africa Mechanical Seals Market Size by Country
- 11.2.1 Middle East and Africa Mechanical Seals Market Size Growth Rate (CAGR) by Country: 2021 VS 2025 VS 2032
- 11.2.2 Middle East and Africa Mechanical Seals Market Size by Country (2021-2026)
- 11.2.3 Middle East and Africa Mechanical Seals Market Size Forecast by Country (2027-2032)
12 Value Chain and Sales Channels Analysis
- 12.1 Mechanical Seals Value Chain Analysis
- 12.1.1 Mechanical Seals Key Raw Materials
- 12.1.2 Key Raw Materials Price
- 12.1.3 Raw Materials Key Suppliers
- 12.1.4 Manufacturing Cost Structure
- 12.1.5 Mechanical Seals Production Mode & Process
- 12.2 Mechanical Seals Sales Channels Analysis
- 12.2.1 Direct Comparison with Distribution Share
- 12.2.2 Mechanical Seals Distributors
- 12.2.3 Mechanical Seals Customers
13 Concluding Insights
14 Appendix
- 14.1 Reasons for Doing This Study
- 14.2 Research Methodology
- 14.3 Research Process
- 14.4 Authors List of This Report
- 14.5 Data Source
- 14.5.1 Secondary Sources
- 14.5.2 Primary Sources
- 14.6 Disclaimer
GET THE RESEARCH
Choose your license.
Choose who needs access.
All options are for this report and research series.
PDF by email within 3–5 working days after payment confirmation.
Talk to an analyst