APO RESEARCH · REPORT
Paper Cup
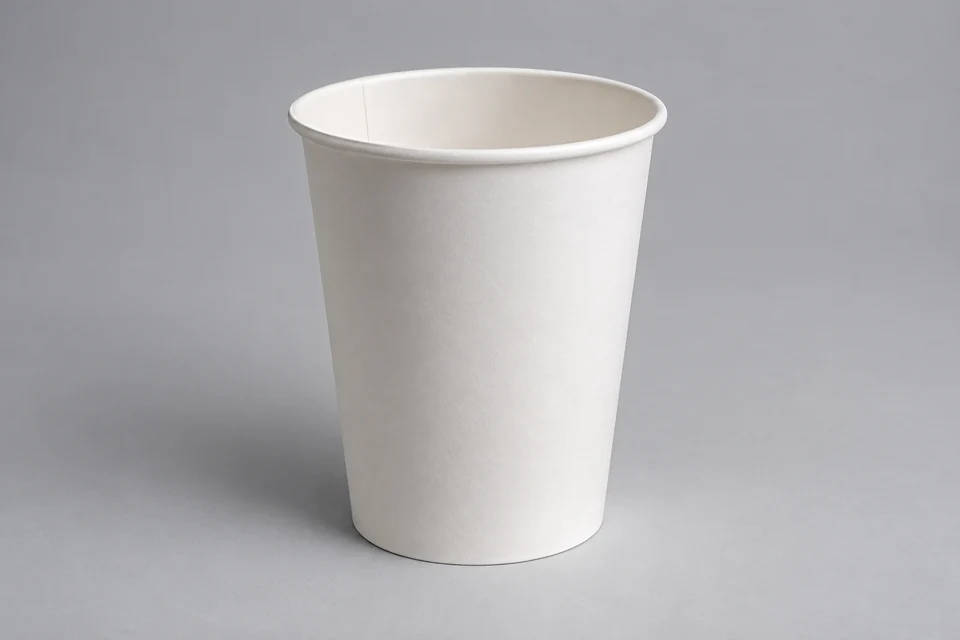
A paper cup is a disposable container made primarily from paperboard, typically coated or treated to hold liquids or food without leaking or disintegrating.
Product & engineering
Understand the product.
A paper cup is a disposable container made primarily from paperboard, typically coated or treated to hold liquids or food without leaking or disintegrating. The inner surfaces of paper cups are usually coated with materials like polyethylene (plastic) or wax to provide water resistance, oil resistance, and structural integrity. Paper cups are commonly used in the foodservice industry for both hot and cold beverages, as well as for serving certain types of food, such as ice cream, soups, and desserts.
The global paper cup industry is positioned at a critical juncture, as reflected in the trends, growth rates, and challenges observed between 2019 and 2030. Driven by both environmental and consumer demand, the industry is undergoing rapid transformations, impacting manufacturers, distributors, and end-users across the globe. The data provided offers a comprehensive insight into the evolving market dynamics, revealing a trajectory of moderate yet consistent growth that is essential for stakeholders to understand as they plan.
According to APO Research's presented, the paper cup market has experienced fluctuating growth between 2019 and 2023. In terms of sales volume, the market reached 281.70 billion units in 2023, marking a -2.92% decline from the previous year. However, this trend is expected to reverse, with a projected 2024 volume of 293.68 billion units and a steady CAGR of 2.96% for the 2024-2030 period. These figures highlight a stable, yet competitive market environment where demand for paper cups is expected to increase, albeit at a controlled pace.
The revenue analysis mirrors these trends. The industry saw a slight contraction in 2023, with a YoY revenue decrease of -0.81%, yielding total revenue of USD 13.07 billion. However, projections indicate a rebound, with the market anticipated to grow to USD 13.72 billion by 2024, and further reaching USD 18.32 billion by 2030. A 4.94% CAGR from 2024 to 2030 demonstrates the long-term potential of the sector, driven by rising global consumption and emerging markets.
The global demand for sustainable packaging solutions, stricter environmental regulations, and a shift towards greener consumer habits are among the most significant factors propelling the paper cup market forward. Increasing consumer awareness and legislative actions in various regions, such as the European Union’s ban on single-use plastics, are pushing companies to innovate in the design and production of biodegradable, recyclable, and compostable paper cups.
The market also benefits from the rising global consumption of takeaway beverages, especially in urban centers where convenience is a primary factor. With the expansion of the food service industry, particularly Quick Service Restaurants (QSR) and coffee shops, the need for disposable cups is surging. The ongoing growth of food delivery services has further enhanced demand for insulated and multi-layered paper cups that retain beverage temperatures effectively.
The data suggests that the paper cup market holds immense potential in emerging regions, particularly Latin America, the Middle East, and Africa. These regions are witnessing an increase in both urbanization and the penetration of Western food and beverage consumption habits. The rise of fast food and takeaway culture in countries such as Brazil, Turkey, and South Africa is an untapped opportunity for paper cup manufacturers. Coupled with the overall growth in disposable income, these markets are expected to become major revenue generators over the forecast period.
Asia Pacific remains a dominant force in the market, with China, Japan, and Southeast Asia leading the region in paper cup consumption. North America and Europe, while mature markets, continue to offer stable demand driven by strong QSR presence and environmental regulations that favor paper over plastic.
Despite its growth trajectory, the paper cup industry faces several challenges. One of the primary obstacles is the limited recycling infrastructure, particularly in developing regions. The traditional use of plastic or wax coatings on paper cups complicates recycling efforts, and though innovation in biodegradable coatings is underway, widespread adoption remains slow.
Additionally, fluctuating raw material prices for paperboard and specialty coatings, as well as supply chain disruptions, are affecting the cost structures of manufacturers. The reliance on paper pulp, a material subject to price volatility, poses a significant challenge, particularly in regions facing raw material shortages or export limitations.
The competition from reusable cups and alternative packaging solutions is another growing concern. As environmental awareness increases, more consumers are opting for reusable cups, especially in markets with strong regulatory frameworks promoting sustainability. Paper cup manufacturers must innovate continuously to stay relevant in the face of these challenges.
As indicated by the APO Research's data, the competitive landscape within the paper cup industry remains intense but relatively consolidated. In 2019, Tier 1 players dominated 16.21% of the market, while by 2023, their share had slightly decreased to 15.96%. This indicates that while there has been some consolidation, Tier 1 players such as Graphic Packaging, Huhtamaki, and Georgia-Pacific continue to maintain their dominance through technological innovation, economies of scale, and a strong market presence across multiple regions.
Tier 2 and Tier 3 manufacturers, making up 84.04% of the market, demonstrate a more fragmented competitive environment. These companies often serve niche markets or regional demands, and while they may not match the global scale of Tier 1 players, they provide essential flexibility and customization options, particularly in emerging markets.
The industry is undergoing a shift in product segmentation. Poly-coated paper cups continue to hold the largest market share, accounting for 42.42% of the total. However, the rise of eco-friendly alternatives like post-consumer fiber cups (23.23%) reflects the industry's gradual transition towards more sustainable practices. Air-pocket insulated cups, with a 20.41% share, are gaining popularity due to their superior insulation properties, particularly in the growing takeaway beverages segment.
The end-use applications are predominantly driven by tea and coffee, representing the largest consumption segment. However, chilled beverages and specialty products such as ice cream cups are seeing significant growth, especially in warmer climates and regions with growing quick service industries.
The production processes in the paper cup industry are becoming increasingly automated, reducing production costs and increasing output to meet rising demand. Key raw materials, including virgin paperboard, recycled paper, and biodegradable coatings, are seeing advancements that not only improve product quality but also enhance sustainability.
As manufacturers aim to increase profitability while adhering to regulatory constraints, the shift towards more eco-friendly coatings and materials will likely redefine the industry’s landscape in the coming years. Companies with the ability to innovate quickly and scale sustainably will be better positioned to lead the market.
In conclusion, the global paper cup market is poised for stable growth over the next decade, with projected recovery and expansion across various regions. Although challenges such as recycling difficulties and fluctuating raw material costs persist, opportunities in emerging markets and innovations in sustainability present avenues for continued success. The competitive landscape remains dynamic, with large global players maintaining their market leadership while smaller manufacturers tap into regional demand.
Given the importance of environmental sustainability and regulatory compliance, companies investing in biodegradable materials and advanced production technologies will likely be at the forefront of the market in the years to come. With a projected CAGR of 4.94% from 2024 to 2030, the paper cup industry offers both resilience and potential for growth, particularly for those ready to embrace the evolving demands of a greener, more convenience-oriented consumer base.
Packaging performance arises from the material, converted geometry, closure and filling or handling process. Material shipments, empty packs and filled-product sales are different objects and must be measured separately.
What turns activity into demand
Accepted filled packs create packaging demand through material per pack, converting yield and filling losses. The package, packaging material and the product it contains are different transaction objects.
The commercial boundary
For Paper Cup, distinguish the supplied product from its inputs and the complete application. Report types and applications may overlap; retain the selected edition's product definition, geography, period, unit and transaction basis when comparing estimates.
Which conditions determine usable paper cup performance?
A paper cup is a disposable container made primarily from paperboard, typically coated or treated to hold liquids or food without leaking or disintegrating. Verify barrier, sealing and mechanical requirements against the specified contents and handling duty. Relate accepted pack count to material intensity, converting yield and line loss; a material name alone does not establish pack performance.
Selected research
Market Structure
Global Paper Cup Market by Size, by Type, by Application, by Region, History and Forecast 2021-2032
Market perspective
A paper cup is a disposable container made primarily from paperboard, typically coated or treated to hold liquids or food without leaking or disintegrating. The inner surfaces of paper cups are usually coated with materials like polyethylene (plastic) or wax to provide water resistance, oil resistance, and structural integrity. Paper cups are commonly used in the foodservice industry for both hot and cold beverages, as well as for serving certain types of food, such as ice cream, soups, and desserts.
The global paper cup industry is positioned at a critical juncture, as reflected in the trends, growth rates, and challenges observed between 2019 and 2030. Driven by both environmental and consumer demand, the industry is undergoing rapid transformations, impacting manufacturers, distributors, and end-users across the globe. The data provided offers a comprehensive insight into the evolving market dynamics, revealing a trajectory of moderate yet consistent growth that is essential for stakeholders to understand as they plan.
According to APO Research's presented, the paper cup market has experienced fluctuating growth between 2019 and 2023. In terms of sales volume, the market reached 281.70 billion units in 2023, marking a -2.92% decline from the previous year. However, this trend is expected to reverse, with a projected 2024 volume of 293.68 billion units and a steady CAGR of 2.96% for the 2024-2030 period. These figures highlight a stable, yet competitive market environment where demand for paper cups is expected to increase, albeit at a controlled pace.
Read the full market overview
The revenue analysis mirrors these trends. The industry saw a slight contraction in 2023, with a YoY revenue decrease of -0.81%, yielding total revenue of USD 13.07 billion. However, projections indicate a rebound, with the market anticipated to grow to USD 13.72 billion by 2024, and further reaching USD 18.32 billion by 2030. A 4.94% CAGR from 2024 to 2030 demonstrates the long-term potential of the sector, driven by rising global consumption and emerging markets.
The global demand for sustainable packaging solutions, stricter environmental regulations, and a shift towards greener consumer habits are among the most significant factors propelling the paper cup market forward. Increasing consumer awareness and legislative actions in various regions, such as the European Union’s ban on single-use plastics, are pushing companies to innovate in the design and production of biodegradable, recyclable, and compostable paper cups.
The market also benefits from the rising global consumption of takeaway beverages, especially in urban centers where convenience is a primary factor. With the expansion of the food service industry, particularly Quick Service Restaurants (QSR) and coffee shops, the need for disposable cups is surging. The ongoing growth of food delivery services has further enhanced demand for insulated and multi-layered paper cups that retain beverage temperatures effectively.
The data suggests that the paper cup market holds immense potential in emerging regions, particularly Latin America, the Middle East, and Africa. These regions are witnessing an increase in both urbanization and the penetration of Western food and beverage consumption habits. The rise of fast food and takeaway culture in countries such as Brazil, Turkey, and South Africa is an untapped opportunity for paper cup manufacturers. Coupled with the overall growth in disposable income, these markets are expected to become major revenue generators over the forecast period.
Asia Pacific remains a dominant force in the market, with China, Japan, and Southeast Asia leading the region in paper cup consumption. North America and Europe, while mature markets, continue to offer stable demand driven by strong QSR presence and environmental regulations that favor paper over plastic.
Despite its growth trajectory, the paper cup industry faces several challenges. One of the primary obstacles is the limited recycling infrastructure, particularly in developing regions. The traditional use of plastic or wax coatings on paper cups complicates recycling efforts, and though innovation in biodegradable coatings is underway, widespread adoption remains slow.
Additionally, fluctuating raw material prices for paperboard and specialty coatings, as well as supply chain disruptions, are affecting the cost structures of manufacturers. The reliance on paper pulp, a material subject to price volatility, poses a significant challenge, particularly in regions facing raw material shortages or export limitations.
The competition from reusable cups and alternative packaging solutions is another growing concern. As environmental awareness increases, more consumers are opting for reusable cups, especially in markets with strong regulatory frameworks promoting sustainability. Paper cup manufacturers must innovate continuously to stay relevant in the face of these challenges.
As indicated by the APO Research's data, the competitive landscape within the paper cup industry remains intense but relatively consolidated. In 2019, Tier 1 players dominated 16.21% of the market, while by 2023, their share had slightly decreased to 15.96%. This indicates that while there has been some consolidation, Tier 1 players such as Graphic Packaging, Huhtamaki, and Georgia-Pacific continue to maintain their dominance through technological innovation, economies of scale, and a strong market presence across multiple regions.
Tier 2 and Tier 3 manufacturers, making up 84.04% of the market, demonstrate a more fragmented competitive environment. These companies often serve niche markets or regional demands, and while they may not match the global scale of Tier 1 players, they provide essential flexibility and customization options, particularly in emerging markets.
The industry is undergoing a shift in product segmentation. Poly-coated paper cups continue to hold the largest market share, accounting for 42.42% of the total. However, the rise of eco-friendly alternatives like post-consumer fiber cups (23.23%) reflects the industry's gradual transition towards more sustainable practices. Air-pocket insulated cups, with a 20.41% share, are gaining popularity due to their superior insulation properties, particularly in the growing takeaway beverages segment.
The end-use applications are predominantly driven by tea and coffee, representing the largest consumption segment. However, chilled beverages and specialty products such as ice cream cups are seeing significant growth, especially in warmer climates and regions with growing quick service industries.
The production processes in the paper cup industry are becoming increasingly automated, reducing production costs and increasing output to meet rising demand. Key raw materials, including virgin paperboard, recycled paper, and biodegradable coatings, are seeing advancements that not only improve product quality but also enhance sustainability.
As manufacturers aim to increase profitability while adhering to regulatory constraints, the shift towards more eco-friendly coatings and materials will likely redefine the industry’s landscape in the coming years. Companies with the ability to innovate quickly and scale sustainably will be better positioned to lead the market.
In conclusion, the global paper cup market is poised for stable growth over the next decade, with projected recovery and expansion across various regions. Although challenges such as recycling difficulties and fluctuating raw material costs persist, opportunities in emerging markets and innovations in sustainability present avenues for continued success. The competitive landscape remains dynamic, with large global players maintaining their market leadership while smaller manufacturers tap into regional demand.
Given the importance of environmental sustainability and regulatory compliance, companies investing in biodegradable materials and advanced production technologies will likely be at the forefront of the market in the years to come. With a projected CAGR of 4.94% from 2024 to 2030, the paper cup industry offers both resilience and potential for growth, particularly for those ready to embrace the evolving demands of a greener, more convenience-oriented consumer base.
The global Paper Cup market is projected to grow from US$ million in 2026 to US$ million by 2032, implying a CAGR of % over 2026-2032.
The US & Canada market for Paper Cup is projected to increase from US$ million in 2026 to US$ million by 2032, at a CAGR of % over 2026-2032.
The Europe market for Paper Cup is projected to increase from US$ million in 2026 to US$ million by 2032, at a CAGR of % over 2026-2032.
The Asia Pacific market for Paper Cup is projected to increase from US$ million in 2026 to US$ million by 2032, at a CAGR of % over 2026-2032.
The China market for Paper Cup is projected to increase from US$ million in 2026 to US$ million by 2032, at a CAGR of % over 2026-2032.
Leading global manufacturers of Paper Cup include Graphic Packaging, Dart Container, Huhtamaki, Seda Group, Pactiv Evergreen, Georgia-Pacific, Genpak LLC, CEE Schisler and Benders Paper Cups, among others. In 2025, the top three vendors together accounted for approximately % of global revenue.
This report provides an overview of the global Paper Cup market in terms of sales, revenue, and price, analyzing global market trends using historical revenue and sales data for 2021-2025, estimates for 2026, and projected CAGRs through 2032.
The study covers key producers of Paper Cup and sales in major regions and countries, assesses future market potential, and highlights priority regions and countries for segmenting the market into sub-sectors, with country-specific market value data for the U.S., Canada, Mexico, Brazil, China, Japan, South Korea, Southeast Asia, India, Germany, the U.K., Italy, the Middle East, Africa, and other countries.
The report also presents Paper Cup sales, revenue, market share, and industry ranking for the main manufacturers for 2021-2026, identifies the major stakeholders in the global market, and analyzes their competitive landscape and market positioning based on recent developments and segmental revenues.
In addition, the report analyzes segment data by Type and Application—covering sales, revenue, and price—for 2021-2032, and evaluates and forecasts the Paper Cup market size, projected growth trends, production technologies, key applications, and end-use industries.
Paper Cup Segment by Company
Graphic Packaging
Dart Container
Huhtamaki
Seda Group
Pactiv Evergreen
Georgia-Pacific
Genpak LLC
CEE Schisler
Benders Paper Cups
Go-Pak
Formacia Packaging
Duni
Fujian Nanwang Environment Protection Scien-tech
Scyphus
Jiangsu Yinwang New Material Technology
Medac S.r.l.
Paper Cup Company
Paper Cup Segment by Type
Air Pocket Insulated
Poly-Coated Paper
Post-Consumer Fiber
Wax-Coated Paper
Paper Cup Segment by Application
Tea and Coffee
Chilled Food and Beverages
Ice Cream
Others
Paper Cup Segment by Region
North America
United States
Canada
Mexico
Europe
Germany
France
U.K.
Italy
Russia
Spain
Netherlands
Switzerland
Sweden
Poland
Asia-Pacific
China
Japan
South Korea
India
Australia
Taiwan
Southeast Asia
South America
Brazil
Argentina
Chile
Middle East & Africa
Egypt
South Africa
Israel
Türkiye
GCC Countries
Study Objectives
1. To analyze and research the global status and future forecast, involving, production, value, consumption, growth rate (CAGR), market share, historical and forecast.
2. To present the key manufacturers, capacity, production, revenue, market share, and Recent Developments.
3. To split the breakdown data by regions, type, manufacturers, and Application.
4. To analyze the global and key regions market potential and advantage, opportunity and challenge, restraints, and risks.
5. To identify significant trends, drivers, influence factors in global and regions.
6. To analyze competitive developments such as expansions, agreements, new product launches, and acquisitions in the market.
Reasons to Buy This Report
1. This report will help the readers to understand the competition within the industries and strategies for the competitive environment to enhance the potential profit. The report also focuses on the competitive landscape of the global Paper Cup market, and introduces in detail the market share, industry ranking, competitor ecosystem, market performance, new product development, operation situation, expansion, and acquisition. etc. of the main players, which helps the readers to identify the main competitors and deeply understand the competition pattern of the market.
2. This report will help stakeholders to understand the global industry status and trends of Paper Cup and provides them with information on key market drivers, restraints, challenges, and opportunities.
3. This report will help stakeholders to understand competitors better and gain more insights to strengthen their position in their businesses. The competitive landscape section includes the market share and rank (in volume and value), competitor ecosystem, new product development, expansion, and acquisition.
4. This report stays updated with novel technology integration, features, and the latest developments in the market.
5. This report helps stakeholders to gain insights into which regions to target globally.
6. This report helps stakeholders to gain insights into the end-user perception concerning the adoption of Paper Cup.
7. This report helps stakeholders to identify some of the key players in the market and understand their valuable contribution.
Chapter Outline
Chapter 1: Provides an overview of the Paper Cup market, including product definition, global market growth prospects, market size, sales, and average price forecasts (2021-2032).
Chapter 2: Provides the market dynamics, latest developments of the market, the driving factors and restrictive factors of the market, the challenges and risks faced by manufacturers in the industry, and the analysis of relevant policies in the industry.
Chapter 3: Detailed analysis of Paper Cup manufacturers competitive landscape, price, sales and revenue market share, latest development plan, merger, etc.
Chapter 4: Provides the analysis of various market segments by type, covering the market size and development potential of each market segment, to help readers find the blue ocean market in different market segments.
Chapter 5: Provides the analysis of various market segments by application, covering the market size and development potential of each market segment, to help readers find the blue ocean market in different downstream markets.
Chapter 6: Sales of Paper Cup in regional level. It provides a quantitative analysis of the market size and development potential of each region and introduces the market development, future development prospects, market space of each country in the world.
Chapter 7: Revenue of Paper Cup in regional level. It provides a quantitative analysis of the market size and development potential of each region and introduces the market development, future development prospects, market space of each country in the world.
Chapter 8: Provides profiles of key players, introducing the basic situation of the main companies in the market in detail, including product sales, revenue, price, gross margin, product introduction, recent development, etc.
Chapter 9: Analysis of industrial chain, including the upstream and downstream of the industry.
Chapter 10: Concluding Insights of the report
More report detail
Tables and figures
Scope & coverage.
Types
- Air Pocket Insulated
- Poly-Coated Paper
- Post-Consumer Fiber
- Wax-Coated Paper
Applications
- Tea and Coffee
- Chilled Food and Beverages
- Ice Cream
- Others
Companies covered
- Graphic Packaging
- Dart Container
- Huhtamaki
- Seda Group
- Pactiv Evergreen
- Georgia-Pacific
- Genpak LLC
- CEE Schisler
- Benders Paper Cups
- Go-Pak
- Formacia Packaging
- Duni
- Fujian Nanwang Environment Protection Scien-tech
- Scyphus
- Jiangsu Yinwang New Material Technology
- Medac S.r.l.
- Paper Cup Company
Inside the report.
1 Market Overview
- 1.1 Product Definition
- 1.2 Global Paper Cup Market Size, 2021 VS 2025 VS 2032
- 1.3 Global Paper Cup Market Size Estimates and Forecasts (2021-2032)
- 1.4 Global Paper Cup Sales Estimates and Forecasts (2021-2032)
- 1.5 Global Paper Cup Market Average Price (2021-2032)
- 1.6 Assumptions and Limitations
- 1.7 Study Goals and Objectives
2 Global Paper Cup Market Dynamics
- 2.1 Paper Cup Industry Trends
- 2.2 Paper Cup Industry Drivers
- 2.3 Paper Cup Industry Opportunities and Challenges
- 2.4 Paper Cup Industry Restraints
3 Paper Cup Market by Manufacturers
- 3.1 Global Paper Cup Revenue by Manufacturers (2021-2026)
- 3.2 Global Paper Cup Sales by Manufacturers (2021-2026)
- 3.3 Global Paper Cup Average Sales Price by Manufacturers (2021-2026)
- 3.4 Global Paper Cup Industry Manufacturers Ranking, 2024 VS 2025 VS 2026
- 3.5 Global Paper Cup Key Manufacturers Manufacturing Sites & Headquarters
- 3.6 Global Paper Cup Manufacturers, Product Type & Application
- 3.7 Global Paper Cup Manufacturers Establishment Date
- 3.8 Market Competitive Analysis
- 3.8.1 Global Paper Cup Market CR5 and HHI
- 3.8.2 Global Top 5 and 10 Paper Cup Players Market Share by Revenue in 2025
- 3.8.3 2025 Paper Cup Tier 1, Tier 2, and Tier 3
4 Paper Cup Market by Type
- 4.1 Paper Cup Type Introduction
- 4.1.1 Air Pocket Insulated
- 4.1.2 Poly-Coated Paper
- 4.1.3 Post-Consumer Fiber
- 4.1.4 Wax-Coated Paper
- 4.2 Global Paper Cup Sales by Type
- 4.2.1 Global Paper Cup Sales by Type (2021 VS 2025 VS 2032)
- 4.2.2 Global Paper Cup Sales by Type (2021-2032)
- 4.2.3 Global Paper Cup Sales Market Share by Type (2021-2032)
- 4.3 Global Paper Cup Revenue by Type
- 4.3.1 Global Paper Cup Revenue by Type (2021 VS 2025 VS 2032)
- 4.3.2 Global Paper Cup Revenue by Type (2021-2032)
- 4.3.3 Global Paper Cup Revenue Market Share by Type (2021-2032)
5 Paper Cup Market by Application
- 5.1 Paper Cup Application Introduction
- 5.1.1 Tea and Coffee
- 5.1.2 Chilled Food and Beverages
- 5.1.3 Ice Cream
- 5.1.4 Others
- 5.2 Global Paper Cup Sales by Application
- 5.2.1 Global Paper Cup Sales by Application (2021 VS 2025 VS 2032)
- 5.2.2 Global Paper Cup Sales by Application (2021-2032)
- 5.2.3 Global Paper Cup Sales Market Share by Application (2021-2032)
- 5.3 Global Paper Cup Revenue by Application
- 5.3.1 Global Paper Cup Revenue by Application (2021 VS 2025 VS 2032)
- 5.3.2 Global Paper Cup Revenue by Application (2021-2032)
- 5.3.3 Global Paper Cup Revenue Market Share by Application (2021-2032)
6 Global Paper Cup Sales by Region
- 6.1 Global Paper Cup Sales by Region: 2021 VS 2025 VS 2032
- 6.2 Global Paper Cup Sales by Region (2021-2032)
- 6.2.1 Global Paper Cup Sales by Region (2021-2026)
- 6.2.2 Global Paper Cup Sales Forecasted by Region (2027-2032)
- 6.3 North America
- 6.3.1 North America Paper Cup Sales Growth Rate by Country: 2021 VS 2025 VS 2032
- 6.3.2 North America Paper Cup Sales by Country (2021-2032)
- 6.3.3 U.S.
- 6.3.4 Canada
- 6.3.5 Mexico
- 6.4 Europe
- 6.4.1 Europe Paper Cup Sales Growth Rate by Country: 2021 VS 2025 VS 2032
- 6.4.2 Europe Paper Cup Sales by Country (2021-2032)
- 6.4.3 Germany
- 6.4.4 France
- 6.4.5 U.K.
- 6.4.6 Italy
- 6.4.7 Netherlands
- 6.5 Asia Pacific
- 6.5.1 Asia Pacific Paper Cup Sales Growth Rate by Country: 2021 VS 2025 VS 2032
- 6.5.2 Asia Pacific Paper Cup Sales by Country (2021-2032)
- 6.5.3 China
- 6.5.4 Japan
- 6.5.5 South Korea
- 6.5.6 Southeast Asia
- 6.5.7 India
- 6.5.8 Australia
- 6.6 South America, Middle East and Africa
- 6.6.1 South America, Middle East and Africa Paper Cup Sales Growth Rate by Country: 2021 VS 2025 VS 2032
- 6.6.2 South America, Middle East and Africa Paper Cup Sales by Country (2021-2032)
- 6.6.3 Brazil
- 6.6.4 South Africa
- 6.6.5 Saudi Arabia
- 6.6.6 Turkey
- 6.6.6 Argentina
- 6.6.6 UAE
- 6.6.6 Egypt
- 6.6.6 Chile
7 Global Paper Cup Revenue by Region
- 7.1 Global Paper Cup Revenue by Region
- 7.1.1 Global Paper Cup Revenue by Region: 2021 VS 2025 VS 2032
- 7.1.2 Global Paper Cup Revenue by Region (2021-2026)
- 7.1.3 Global Paper Cup Revenue by Region (2027-2032)
- 7.1.4 Global Paper Cup Revenue Market Share by Region (2021-2032)
- 7.2 North America
- 7.2.1 North America Paper Cup Revenue (2021-2032)
- 7.2.2 North America Paper Cup Revenue Share by Country: 2021 VS 2025 VS 2032
- 7.3 Europe
- 7.3.1 Europe Paper Cup Revenue (2021-2032)
- 7.3.2 Europe Paper Cup Revenue Share by Country: 2021 VS 2025 VS 2032
- 7.4 Asia-Pacific
- 7.4.1 Asia-Pacific Paper Cup Revenue (2021-2032)
- 7.4.2 Asia-Pacific Paper Cup Revenue Share by Country: 2021 VS 2025 VS 2032
- 7.5 South America, Middle East and Africa
- 7.5.1 South America, Middle East and Africa Paper Cup Revenue (2021-2032)
- 7.5.2 South America, Middle East and Africa Paper Cup Revenue Share by Country: 2021 VS 2025 VS 2032
8 Company Profiles
- 8.1 Graphic Packaging
- 8.1.1 Graphic Packaging Company Information
- 8.1.2 Graphic Packaging Business Overview
- 8.1.3 Graphic Packaging Paper Cup Sales, Price, Revenue and Gross Margin (2021-2026)
- 8.1.4 Graphic Packaging Paper Cup Product Portfolio
- 8.1.5 Graphic Packaging Recent Developments
- 8.2 Dart Container
- 8.2.1 Dart Container Company Information
- 8.2.2 Dart Container Business Overview
- 8.2.3 Dart Container Paper Cup Sales, Price, Revenue and Gross Margin (2021-2026)
- 8.2.4 Dart Container Paper Cup Product Portfolio
- 8.2.5 Dart Container Recent Developments
- 8.3 Huhtamaki
- 8.3.1 Huhtamaki Company Information
- 8.3.2 Huhtamaki Business Overview
- 8.3.3 Huhtamaki Paper Cup Sales, Price, Revenue and Gross Margin (2021-2026)
- 8.3.4 Huhtamaki Paper Cup Product Portfolio
- 8.3.5 Huhtamaki Recent Developments
- 8.4 Seda Group
- 8.4.1 Seda Group Company Information
- 8.4.2 Seda Group Business Overview
- 8.4.3 Seda Group Paper Cup Sales, Price, Revenue and Gross Margin (2021-2026)
- 8.4.4 Seda Group Paper Cup Product Portfolio
- 8.4.5 Seda Group Recent Developments
- 8.5 Pactiv Evergreen
- 8.5.1 Pactiv Evergreen Company Information
- 8.5.2 Pactiv Evergreen Business Overview
- 8.5.3 Pactiv Evergreen Paper Cup Sales, Price, Revenue and Gross Margin (2021-2026)
- 8.5.4 Pactiv Evergreen Paper Cup Product Portfolio
- 8.5.5 Pactiv Evergreen Recent Developments
- 8.6 Georgia-Pacific
- 8.6.1 Georgia-Pacific Company Information
- 8.6.2 Georgia-Pacific Business Overview
- 8.6.3 Georgia-Pacific Paper Cup Sales, Price, Revenue and Gross Margin (2021-2026)
- 8.6.4 Georgia-Pacific Paper Cup Product Portfolio
- 8.6.5 Georgia-Pacific Recent Developments
- 8.7 Genpak LLC
- 8.7.1 Genpak LLC Company Information
- 8.7.2 Genpak LLC Business Overview
- 8.7.3 Genpak LLC Paper Cup Sales, Price, Revenue and Gross Margin (2021-2026)
- 8.7.4 Genpak LLC Paper Cup Product Portfolio
- 8.7.5 Genpak LLC Recent Developments
- 8.8 CEE Schisler
- 8.8.1 CEE Schisler Company Information
- 8.8.2 CEE Schisler Business Overview
- 8.8.3 CEE Schisler Paper Cup Sales, Price, Revenue and Gross Margin (2021-2026)
- 8.8.4 CEE Schisler Paper Cup Product Portfolio
- 8.8.5 CEE Schisler Recent Developments
- 8.9 Benders Paper Cups
- 8.9.1 Benders Paper Cups Company Information
- 8.9.2 Benders Paper Cups Business Overview
- 8.9.3 Benders Paper Cups Paper Cup Sales, Price, Revenue and Gross Margin (2021-2026)
- 8.9.4 Benders Paper Cups Paper Cup Product Portfolio
- 8.9.5 Benders Paper Cups Recent Developments
- 8.10 Go-Pak
- 8.10.1 Go-Pak Company Information
- 8.10.2 Go-Pak Business Overview
- 8.10.3 Go-Pak Paper Cup Sales, Price, Revenue and Gross Margin (2021-2026)
- 8.10.4 Go-Pak Paper Cup Product Portfolio
- 8.10.5 Go-Pak Recent Developments
- 8.11 Formacia Packaging
- 8.11.1 Formacia Packaging Company Information
- 8.11.2 Formacia Packaging Business Overview
- 8.11.3 Formacia Packaging Paper Cup Sales, Price, Revenue and Gross Margin (2021-2026)
- 8.11.4 Formacia Packaging Paper Cup Product Portfolio
- 8.11.5 Formacia Packaging Recent Developments
- 8.12 Duni
- 8.12.1 Duni Company Information
- 8.12.2 Duni Business Overview
- 8.12.3 Duni Paper Cup Sales, Price, Revenue and Gross Margin (2021-2026)
- 8.12.4 Duni Paper Cup Product Portfolio
- 8.12.5 Duni Recent Developments
- 8.13 Fujian Nanwang Environment Protection Scien-tech
- 8.13.1 Fujian Nanwang Environment Protection Scien-tech Company Information
- 8.13.2 Fujian Nanwang Environment Protection Scien-tech Business Overview
- 8.13.3 Fujian Nanwang Environment Protection Scien-tech Paper Cup Sales, Price, Revenue and Gross Margin (2021-2026)
- 8.13.4 Fujian Nanwang Environment Protection Scien-tech Paper Cup Product Portfolio
- 8.13.5 Fujian Nanwang Environment Protection Scien-tech Recent Developments
- 8.14 Scyphus
- 8.14.1 Scyphus Company Information
- 8.14.2 Scyphus Business Overview
- 8.14.3 Scyphus Paper Cup Sales, Price, Revenue and Gross Margin (2021-2026)
- 8.14.4 Scyphus Paper Cup Product Portfolio
- 8.14.5 Scyphus Recent Developments
- 8.15 Jiangsu Yinwang New Material Technology
- 8.15.1 Jiangsu Yinwang New Material Technology Company Information
- 8.15.2 Jiangsu Yinwang New Material Technology Business Overview
- 8.15.3 Jiangsu Yinwang New Material Technology Paper Cup Sales, Price, Revenue and Gross Margin (2021-2026)
- 8.15.4 Jiangsu Yinwang New Material Technology Paper Cup Product Portfolio
- 8.15.5 Jiangsu Yinwang New Material Technology Recent Developments
- 8.16 Medac S.r.l.
- 8.16.1 Medac S.r.l. Company Information
- 8.16.2 Medac S.r.l. Business Overview
- 8.16.3 Medac S.r.l. Paper Cup Sales, Price, Revenue and Gross Margin (2021-2026)
- 8.16.4 Medac S.r.l. Paper Cup Product Portfolio
- 8.16.5 Medac S.r.l. Recent Developments
- 8.17 Paper Cup Company
- 8.17.1 Paper Cup Company Company Information
- 8.17.2 Paper Cup Company Business Overview
- 8.17.3 Paper Cup Company Paper Cup Sales, Price, Revenue and Gross Margin (2021-2026)
- 8.17.4 Paper Cup Company Paper Cup Product Portfolio
- 8.17.5 Paper Cup Company Recent Developments
9 Value Chain and Sales Channels Analysis
- 9.1 Paper Cup Value Chain Analysis
- 9.1.1 Paper Cup Key Raw Materials
- 9.1.2 Raw Materials Key Suppliers
- 9.1.3 Manufacturing Cost Structure
- 9.1.4 Paper Cup Production Mode & Process
- 9.2 Paper Cup Sales Channels Analysis
- 9.2.1 Direct Comparison with Distribution Share
- 9.2.2 Paper Cup Distributors
- 9.2.3 Paper Cup Customers
10 Concluding Insights
11 Appendix
- 11.1 Reasons for Doing This Study
- 11.2 Research Methodology
- 11.3 Research Process
- 11.4 Authors List of This Report
- 11.5 Data Source
- 11.5.1 Secondary Sources
- 11.5.2 Primary Sources
- 11.6 Disclaimer
GET THE RESEARCH
Choose your license.
Choose who needs access.
All options are for this report and research series.
PDF by email within 3–5 working days after payment confirmation.
Talk to an analyst