APO RESEARCH · REPORT
L-(+)-Ergothioneine
L (+) Ergothioneine is a naturally occurring sulfur containing derivative of L histidine with the molecular formula C9H15N3O2S and a molecular mass of 229.30 g/mol.
Product & engineering
Understand the product.
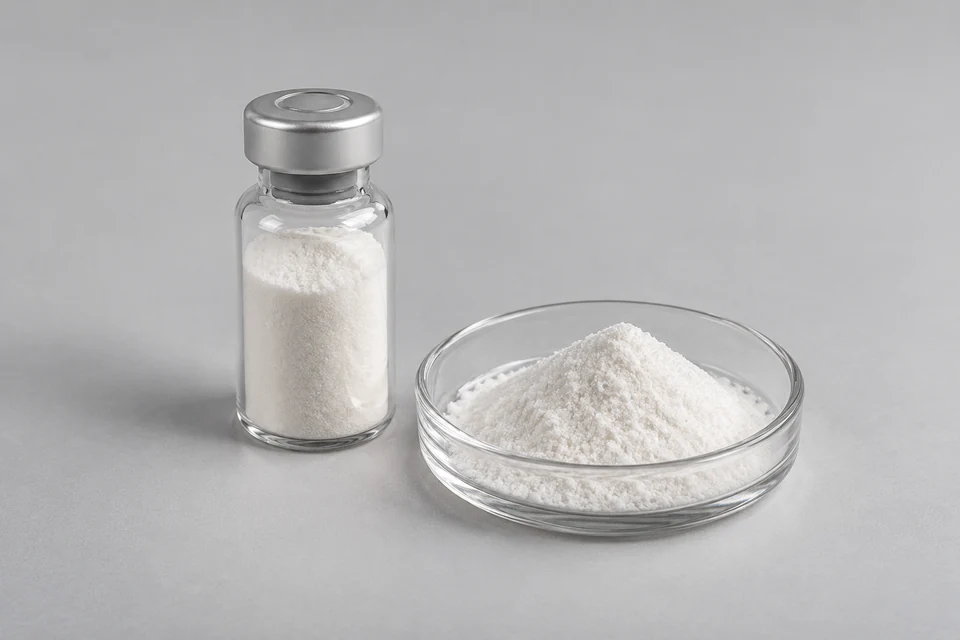
L (+) Ergothioneine is a naturally occurring sulfur containing derivative of L histidine with the molecular formula C9H15N3O2S and a molecular mass of 229.30 g/mol. Its molecular structure contains a trimethylated histidine backbone and a sulfur substituted imidazole ring, forming an amino acid betaine with a permanent zwitterionic character. The molecule exists in equilibrium between thiol and thione tautomers. At physiological pH the thione form predominates, which substantially limits spontaneous oxidation and gives ergothioneine greater chemical stability than many conventional low molecular weight thiols. This thione chemistry also permits redox reactions and transition metal coordination while retaining high aqueous solubility. High purity commercial material is typically supplied as a white crystalline powder. The synthetic material assessed by the European Food Safety Authority specifies chemical purity of at least 99.5 percent by HPLC and positive optical rotation consistent with the naturally occurring L configuration.
Natural ergothioneine biosynthesis occurs in selected fungi and bacteria through histidine derived sulfur incorporation pathways. Mushrooms contain particularly high concentrations, while lower concentrations occur in beans, cereals, animal tissues and other foods through biological uptake and food chain transfer. Humans do not possess a known endogenous biosynthetic pathway for ergothioneine and obtain it from dietary sources. Absorption and tissue retention are strongly associated with the SLC22A4 transporter, commonly termed OCTN1 or the ergothioneine transporter, which mediates intestinal uptake, cellular accumulation and renal reabsorption. Ergothioneine can consequently accumulate in erythrocytes and several tissues despite relatively low dietary concentrations. Its thione dominated chemistry gives the molecule resistance to autoxidation and enables reactions with reactive oxygen and nitrogen species and coordination with selected metal ions. These physicochemical properties underpin its use as a functional ingredient, while its precise physiological roles in humans remain an active area of biochemical research.
Industrial L (+) Ergothioneine is manufactured principally by microbial fermentation, enzyme catalyzed synthesis and chemical synthesis. Commercial fermentation routes use engineered microorganisms carrying ergothioneine biosynthetic enzymes, with current FDA GRAS records documenting production using engineered Escherichia coli strains. Chemical production has also been established commercially and was the manufacturing basis of the synthetic material evaluated by EFSA. Enzyme catalyzed routes convert histidine derived precursors through selective sulfur incorporation reactions and are currently used by commercial ingredient manufacturers. These technologies produce chemically equivalent L ergothioneine when stereochemical configuration, molecular identity, purity and impurity specifications are controlled. Commercial material is used in dietary supplements, foods and beverages, cosmetics and personal care formulations, with food use subject to jurisdiction specific regulatory requirements. The European Union currently lists L ergothioneine as an authorised novel food for specified food categories and food supplements.
The research object may be an ingredient, device, preparation or care service. These supply stages have different specifications and measurement units; an ingredient identity or device name does not establish a clinical outcome.
What turns activity into demand
Qualified use at the specified treatment or instrument boundary creates purchases through protocol, utilisation and replacement. A product, clinical service and complete care episode measure different supplied objects.
The commercial boundary
For L-(+)-Ergothioneine, distinguish the supplied product from its inputs and the complete application. Report types and applications may overlap; retain the selected edition's product definition, geography, period, unit and transaction basis when comparing estimates.
Which conditions determine usable l-(+)-ergothioneine performance?
L (+) Ergothioneine is a naturally occurring sulfur containing derivative of L histidine with the molecular formula C9H15N3O2S and a molecular mass of 229.30 g/mol. Confirm the specified composition or device function, intended use and supplied unit. Separate ingredients, finished preparations, equipment and treatment activity before comparing quantities or revenue; use the report scope rather than inferring efficacy from an illustration.
Selected research
Industry Research
L-(+)-Ergothioneine Industry Research Report 2026
Market perspective
According to APO Research, Inc, the global L (+) Ergothioneine market was valued at USD 68.53 million in 2025 and is expected to reach USD 84.17 million in 2026 and USD 191.86 million by 2032, representing a CAGR of 14.72% from 2026 to 2032. Global sales volume is estimated at 25.86 t in 2025 and 33.40 t in 2026, reaching 107.79 t in 2032, equivalent to a volume CAGR of 21.56%. The weighted ex factory net price is estimated at USD 2,650.00 per kg in 2025, USD 2,520.00 per kg in 2026 and USD 1,780.00 per kg in 2032, corresponding to an average annual price decline of 5.63% during 2026 to 2032. Effective manufacturing capacity is estimated at 72.50 t in 2025, 92.01 t in 2026 and 189.97 t in 2032, while utilization increases from 35.67% to 36.30% and 56.74%, respectively. The value expansion therefore comes primarily from higher physical consumption, rising utilization and broader downstream formulation volumes as fermentation productivity and purification economics reduce unit cost.
China is expected to contribute the largest manufacturing increment through GeneIII Biotechnology, Chuanning Biotechnology, Shanghai EGT Synbio, Readline Biotech, SIYOMICRO, Bloomage Biotech, Abiochem and other commercial producers. GeneIII reports monthly L (+) Ergothioneine capacity of 3.00 to 5.00 t, equivalent to 36.00 to 60.00 t on an annualized basis, with product purity reaching 99.99%. This disclosed capacity alone exceeds the audited 2026 global sales volume of 33.40 t and provides a direct physical explanation for the relatively low industry utilization rate. SIYOMICRO has reported stable production scale up in a 100.00 t fermenter, while Readline has commissioned two hundred tonne class shared active ingredient production lines in Zhuhai with commercial scale production of ergothioneine. Chuanning exceeded its 11.00 g/L fermentation titer objective and annual production target in 2025. Bloomage commercially produces MitoEGT through one step biosynthesis, and Shanghai EGT Synbio has established commercial biological production of Dr.Ergo. The current FDA GRAS inventory contains four ergothioneine notices. Blue California, Shanghai EGT Synbio and GeneIII have received FDA no questions letters. Abiochem remains under review.
Fermentation is expected to account for the largest incremental production volume through 2032 as strain productivity, fermentation titer, reactor scale, downstream recovery and crystallization yield improve. Enzymatic synthesis and chemical synthesis remain relevant for selected manufacturing configurations and purity specifications. Dietary supplements are expected to remain the largest application by value, followed by food and beverages and cosmetics and personal care, with pet nutrition representing a smaller commercial application. Regulatory inclusion levels provide a useful physical demand anchor. The European Union permits up to 30.00 mg per day in food supplements for the general population, 25.00 mg per kg in alcohol free beverages and milk based drinks, 40.00 mg per kg in fresh milk products, 200.00 mg per kg in cereal bars and 250.00 mg per kg in chocolate confectionery. At 30.00 mg per day, 1.00 t of L (+) Ergothioneine corresponds to approximately 33.33 million supplement consumption days. At 25.00 mg per kg, 1.00 t can theoretically supply 40,000.00 t of beverage at the permitted maximum inclusion level. These low unit dosages allow large downstream finished product volumes to absorb relatively modest ingredient tonnage, while continued price reductions materially enlarge the addressable formulation base. Commercial demand is recurrent because L (+) Ergothioneine is consumed within finished formulations and replenished with continuing supplement, food, beverage, cosmetic and pet nutrition production.
Read the full market overview
Report Scope
This report quantifies the global L-(+)-Ergothioneine market in terms of revenue (US$ million) and, where applicable, sales volume (kg), using 2025 as the base year and providing annual historical and forecast data for 2021–2032.
It standardizes definitions of Types and Applications, harmonizes vendor attribution, and presents comparable time series by company, Type, Application, and region/country, including indicative price bands (US$/kg) and concentration ratios (CR5/CR10).
The outputs are intended to support strategy development, budgeting, and performance benchmarking for brand owners, manufacturers, retailers, channel partners, and investors; data are structured with consistent units and fields to facilitate integration into internal FP&A and BI systems.
Key Companies & Market Share Insights
This section profiles leading manufacturers, combining 2021–2025 results with a 2026–2032 outlook. It reports revenue, market share, price bands, product and application mix, regional and channel mix, and key developments (M&A, capacity additions, certifications). It also provides global revenue, average price, and—where applicable—sales volume by manufacturer, and calculates CR5/CR10 and rank changes to support comparative benchmarking.
L-(+)-Ergothioneine Market by Company
Bloomage Biotech
Chuanning Biotechnology
Shanghai EGT Synbio
GeneIII Biotechnology
Readline Biotech
SIYOMICRO
Abiochem
Magic Health
Seedling Bio
Focusfreda
Nutri Force
Natural Field
GsynBio
Hechen Bioworkx
Changzhou Kaixing Biotechnology
Spec Chem Industry
Conagen
Mironova Labs
NAGASE
L-(+)-Ergothioneine Segment by Type
Fermentation
Enzymatic Synthesis
Chemical Synthesis
L-(+)-Ergothioneine Segment by Application
Dietary Supplements
Food & Beverages
Cosmetics & Personal Care
Pet Nutrition
L-(+)-Ergothioneine Segment by Region
North America
United States
Canada
Mexico
Europe
Germany
France
U.K.
Italy
Russia
Spain
Netherlands
Switzerland
Sweden
Poland
Asia-Pacific
China
Japan
South Korea
India
Australia
Taiwan
Southeast Asia
South America
Brazil
Argentina
Chile
Colombia
Middle East & Africa
Egypt
South Africa
Israel
Türkiye
GCC Countries
Key Drivers & Barriers
High-impact rendering factors and drivers have been studied in this report to aid the readers to understand the general development. Moreover, the report includes restraints and challenges that may act as stumbling blocks on the way of the players. This will assist the users to be attentive and make informed decisions related to business. Specialists have also laid their focus on the upcoming business prospects.
Reasons to Buy This Report
1. This report will help the readers to understand the competition within the industries and strategies for the competitive environment to enhance the potential profit. The report also focuses on the competitive landscape of the global L-(+)-Ergothioneine market, and introduces in detail the market share, industry ranking, competitor ecosystem, market performance, new product development, operation situation, expansion, and acquisition. etc. of the main players, which helps the readers to identify the main competitors and deeply understand the competition pattern of the market.
2. This report will help stakeholders to understand the global industry status and trends of L-(+)-Ergothioneine and provides them with information on key market drivers, restraints, challenges, and opportunities.
3. This report will help stakeholders to understand competitors better and gain more insights to strengthen their position in their businesses. The competitive landscape section includes the market share and rank (in volume and value), competitor ecosystem, new product development, expansion, and acquisition.
4. This report stays updated with novel technology integration, features, and the latest developments in the market
5. This report helps stakeholders to gain insights into which regions to target globally
6. This report helps stakeholders to gain insights into the end-user perception concerning the adoption of L-(+)-Ergothioneine.
7. This report helps stakeholders to identify some of the key players in the market and understand their valuable contribution.
Chapter Outline
Chapter 1: Research objectives, research methods, data sources, data cross-validation;
Chapter 2: Introduces the report scope of the report, executive summary of different market segments (by region, product type, application, etc.), including the market size of each market segment, future development potential, and so on. It offers a high-level view of the current state of the market and its likely evolution in the short to mid-term, and long term.
Chapter 3: Detailed analysis of L-(+)-Ergothioneine manufacturers competitive landscape, price, production and value market share, latest development plan, merger, and acquisition information, etc.
Chapter 4: Provides profiles of key players, introducing the basic situation of the main companies in the market in detail, including product production/output, value, price, gross margin, product introduction, recent development, etc.
Chapter 5: Production/output, value of L-(+)-Ergothioneine by region/country. It provides a quantitative analysis of the market size and development potential of each region in the next six years.
Chapter 6: Consumption of L-(+)-Ergothioneine in regional level and country level. It provides a quantitative analysis of the market size and development potential of each region and its main countries and introduces the market development, future development prospects, market space, and production of each country in the world.
Chapter 7: Provides the analysis of various market segments by type, covering the market size and development potential of each market segment, to help readers find the blue ocean market in different market segments.
Chapter 8: Provides the analysis of various market segments by application, covering the market size and development potential of each market segment, to help readers find the blue ocean market in different downstream markets.
Chapter 9: Analysis of industrial chain, including the upstream and downstream of the industry.
Chapter 10: Introduces the market dynamics, latest developments of the market, the driving factors and restrictive factors of the market, the challenges and risks faced by manufacturers in the industry, and the analysis of relevant policies in the industry.
Chapter 11: The main points and conclusions of the report.
More report detail
Tables and figures
Scope & coverage.
Types
- Fermentation
- Enzymatic Synthesis
- Chemical Synthesis
Applications
- Dietary Supplements
- Food & Beverages
- Cosmetics & Personal Care
- Pet Nutrition
Companies covered
- Bloomage Biotech
- Chuanning Biotechnology
- Shanghai EGT Synbio
- GeneIII Biotechnology
- Readline Biotech
- SIYOMICRO
- Abiochem
- Magic Health
- Seedling Bio
- Focusfreda
- Nutri Force
- Natural Field
- GsynBio
- Hechen Bioworkx
- Changzhou Kaixing Biotechnology
- Spec Chem Industry
- Conagen
- Mironova Labs
- NAGASE
Inside the report.
1 Preface
- 1.1 Scope of Report
- 1.2 Reasons for Doing This Study
- 1.3 Research Methodology
- 1.4 Research Process
- 1.5 Data Source
- 1.5.1 Secondary Sources
- 1.5.2 Primary Sources
2 Market Overview
- 2.1 Product Definition
- 2.2 Global Market Growth Prospects
- 2.2.1 Global L-(+)-Ergothioneine Market Size (2021-2032)
- 2.2.2 Global L-(+)-Ergothioneine Sales (2021-2032)
- 2.2.3 Global L-(+)-Ergothioneine Market Average Price (2021-2032)
- 2.3 L-(+)-Ergothioneine by Type
- 2.3.1 Market Value Comparison by Type (2021 VS 2025 VS 2032) & (US$ Million)
- 2.3.2 Fermentation
- 2.3.3 Enzymatic Synthesis
- 2.3.4 Chemical Synthesis
- 2.4 L-(+)-Ergothioneine by Application
- 2.4.1 Market Value Comparison by Application (2021 VS 2025 VS 2032)
- 2.4.2 Dietary Supplements
- 2.4.3 Food & Beverages
- 2.4.4 Cosmetics & Personal Care
- 2.4.5 Pet Nutrition
3 Market Competitive Landscape by Manufacturers
- 3.1 Global L-(+)-Ergothioneine Market Competitive Situation by Manufacturers (2021 Versus 2025)
- 3.2 Global L-(+)-Ergothioneine Sales (kg) of Manufacturers (2021-2026)
- 3.3 Global L-(+)-Ergothioneine Revenue of Manufacturers (2021-2026)
- 3.4 Global L-(+)-Ergothioneine Average Price by Manufacturers (2021-2026)
- 3.5 Global L-(+)-Ergothioneine Industry Ranking, 2024 VS 2025 VS 2026
- 3.6 Global Manufacturers of L-(+)-Ergothioneine, Manufacturing Sites & Headquarters
- 3.7 Global Manufacturers of L-(+)-Ergothioneine, Product Type & Application
- 3.8 Global Manufacturers of L-(+)-Ergothioneine, Established Date
- 3.9 Global L-(+)-Ergothioneine Market CR5 and HHI
- 3.10 Global Manufacturers Mergers & Acquisition
4 Manufacturers Profiled
- 4.1 Bloomage Biotech
- 4.1.1 Bloomage Biotech Company Information
- 4.1.2 Bloomage Biotech Business Overview
- 4.1.3 Bloomage Biotech L-(+)-Ergothioneine Sales, Revenue and Gross Margin (2021-2026)
- 4.1.4 Bloomage Biotech L-(+)-Ergothioneine Product Portfolio
- 4.1.5 Bloomage Biotech Recent Developments
- 4.2 Chuanning Biotechnology
- 4.2.1 Chuanning Biotechnology Company Information
- 4.2.2 Chuanning Biotechnology Business Overview
- 4.2.3 Chuanning Biotechnology L-(+)-Ergothioneine Sales, Revenue and Gross Margin (2021-2026)
- 4.2.4 Chuanning Biotechnology L-(+)-Ergothioneine Product Portfolio
- 4.2.5 Chuanning Biotechnology Recent Developments
- 4.3 Shanghai EGT Synbio
- 4.3.1 Shanghai EGT Synbio Company Information
- 4.3.2 Shanghai EGT Synbio Business Overview
- 4.3.3 Shanghai EGT Synbio L-(+)-Ergothioneine Sales, Revenue and Gross Margin (2021-2026)
- 4.3.4 Shanghai EGT Synbio L-(+)-Ergothioneine Product Portfolio
- 4.3.5 Shanghai EGT Synbio Recent Developments
- 4.4 GeneIII Biotechnology
- 4.4.1 GeneIII Biotechnology Company Information
- 4.4.2 GeneIII Biotechnology Business Overview
- 4.4.3 GeneIII Biotechnology L-(+)-Ergothioneine Sales, Revenue and Gross Margin (2021-2026)
- 4.4.4 GeneIII Biotechnology L-(+)-Ergothioneine Product Portfolio
- 4.4.5 GeneIII Biotechnology Recent Developments
- 4.5 Readline Biotech
- 4.5.1 Readline Biotech Company Information
- 4.5.2 Readline Biotech Business Overview
- 4.5.3 Readline Biotech L-(+)-Ergothioneine Sales, Revenue and Gross Margin (2021-2026)
- 4.5.4 Readline Biotech L-(+)-Ergothioneine Product Portfolio
- 4.5.5 Readline Biotech Recent Developments
- 4.6 SIYOMICRO
- 4.6.1 SIYOMICRO Company Information
- 4.6.2 SIYOMICRO Business Overview
- 4.6.3 SIYOMICRO L-(+)-Ergothioneine Sales, Revenue and Gross Margin (2021-2026)
- 4.6.4 SIYOMICRO L-(+)-Ergothioneine Product Portfolio
- 4.6.5 SIYOMICRO Recent Developments
- 4.7 Abiochem
- 4.7.1 Abiochem Company Information
- 4.7.2 Abiochem Business Overview
- 4.7.3 Abiochem L-(+)-Ergothioneine Sales, Revenue and Gross Margin (2021-2026)
- 4.7.4 Abiochem L-(+)-Ergothioneine Product Portfolio
- 4.7.5 Abiochem Recent Developments
- 4.8 Magic Health
- 4.8.1 Magic Health Company Information
- 4.8.2 Magic Health Business Overview
- 4.8.3 Magic Health L-(+)-Ergothioneine Sales, Revenue and Gross Margin (2021-2026)
- 4.8.4 Magic Health L-(+)-Ergothioneine Product Portfolio
- 4.8.5 Magic Health Recent Developments
- 4.9 Seedling Bio
- 4.9.1 Seedling Bio Company Information
- 4.9.2 Seedling Bio Business Overview
- 4.9.3 Seedling Bio L-(+)-Ergothioneine Sales, Revenue and Gross Margin (2021-2026)
- 4.9.4 Seedling Bio L-(+)-Ergothioneine Product Portfolio
- 4.9.5 Seedling Bio Recent Developments
- 4.10 Focusfreda
- 4.10.1 Focusfreda Company Information
- 4.10.2 Focusfreda Business Overview
- 4.10.3 Focusfreda L-(+)-Ergothioneine Sales, Revenue and Gross Margin (2021-2026)
- 4.10.4 Focusfreda L-(+)-Ergothioneine Product Portfolio
- 4.10.5 Focusfreda Recent Developments
- 4.11 Nutri Force
- 4.11.1 Nutri Force Company Information
- 4.11.2 Nutri Force Business Overview
- 4.11.3 Nutri Force L-(+)-Ergothioneine Sales, Revenue and Gross Margin (2021-2026)
- 4.11.4 Nutri Force L-(+)-Ergothioneine Product Portfolio
- 4.11.5 Nutri Force Recent Developments
- 4.12 Natural Field
- 4.12.1 Natural Field Company Information
- 4.12.2 Natural Field Business Overview
- 4.12.3 Natural Field L-(+)-Ergothioneine Sales, Revenue and Gross Margin (2021-2026)
- 4.12.4 Natural Field L-(+)-Ergothioneine Product Portfolio
- 4.12.5 Natural Field Recent Developments
- 4.13 GsynBio
- 4.13.1 GsynBio Company Information
- 4.13.2 GsynBio Business Overview
- 4.13.3 GsynBio L-(+)-Ergothioneine Sales, Revenue and Gross Margin (2021-2026)
- 4.13.4 GsynBio L-(+)-Ergothioneine Product Portfolio
- 4.13.5 GsynBio Recent Developments
- 4.14 Hechen Bioworkx
- 4.14.1 Hechen Bioworkx Company Information
- 4.14.2 Hechen Bioworkx Business Overview
- 4.14.3 Hechen Bioworkx L-(+)-Ergothioneine Sales, Revenue and Gross Margin (2021-2026)
- 4.14.4 Hechen Bioworkx L-(+)-Ergothioneine Product Portfolio
- 4.14.5 Hechen Bioworkx Recent Developments
- 4.15 Changzhou Kaixing Biotechnology
- 4.15.1 Changzhou Kaixing Biotechnology Company Information
- 4.15.2 Changzhou Kaixing Biotechnology Business Overview
- 4.15.3 Changzhou Kaixing Biotechnology L-(+)-Ergothioneine Sales, Revenue and Gross Margin (2021-2026)
- 4.15.4 Changzhou Kaixing Biotechnology L-(+)-Ergothioneine Product Portfolio
- 4.15.5 Changzhou Kaixing Biotechnology Recent Developments
- 4.16 Spec Chem Industry
- 4.16.1 Spec Chem Industry Company Information
- 4.16.2 Spec Chem Industry Business Overview
- 4.16.3 Spec Chem Industry L-(+)-Ergothioneine Sales, Revenue and Gross Margin (2021-2026)
- 4.16.4 Spec Chem Industry L-(+)-Ergothioneine Product Portfolio
- 4.16.5 Spec Chem Industry Recent Developments
- 4.17 Conagen
- 4.17.1 Conagen Company Information
- 4.17.2 Conagen Business Overview
- 4.17.3 Conagen L-(+)-Ergothioneine Sales, Revenue and Gross Margin (2021-2026)
- 4.17.4 Conagen L-(+)-Ergothioneine Product Portfolio
- 4.17.5 Conagen Recent Developments
- 4.18 Mironova Labs
- 4.18.1 Mironova Labs Company Information
- 4.18.2 Mironova Labs Business Overview
- 4.18.3 Mironova Labs L-(+)-Ergothioneine Sales, Revenue and Gross Margin (2021-2026)
- 4.18.4 Mironova Labs L-(+)-Ergothioneine Product Portfolio
- 4.18.5 Mironova Labs Recent Developments
- 4.19 NAGASE
- 4.19.1 NAGASE Company Information
- 4.19.2 NAGASE Business Overview
- 4.19.3 NAGASE L-(+)-Ergothioneine Sales, Revenue and Gross Margin (2021-2026)
- 4.19.4 NAGASE L-(+)-Ergothioneine Product Portfolio
- 4.19.5 NAGASE Recent Developments
5 Global L-(+)-Ergothioneine Market Scenario by Region
- 5.1 Global L-(+)-Ergothioneine Market Size by Region: 2021 VS 2025 VS 2032
- 5.2 Global L-(+)-Ergothioneine Sales by Region: 2021-2032
- 5.2.1 Global L-(+)-Ergothioneine Sales by Region: 2021-2026
- 5.2.2 Global L-(+)-Ergothioneine Sales by Region: 2027-2032
- 5.3 Global L-(+)-Ergothioneine Revenue by Region: 2021-2032
- 5.3.1 Global L-(+)-Ergothioneine Revenue by Region: 2021-2026
- 5.3.2 Global L-(+)-Ergothioneine Revenue by Region: 2027-2032
- 5.4 North America L-(+)-Ergothioneine Market Facts & Figures by Country
- 5.4.1 North America L-(+)-Ergothioneine Market Size by Country: 2021 VS 2025 VS 2032
- 5.4.2 North America L-(+)-Ergothioneine Sales by Country (2021-2032)
- 5.4.3 North America L-(+)-Ergothioneine Revenue by Country (2021-2032)
- 5.4.4 United States
- 5.4.5 Canada
- 5.4.6 Mexico
- 5.5 Europe L-(+)-Ergothioneine Market Facts & Figures by Country
- 5.5.1 Europe L-(+)-Ergothioneine Market Size by Country: 2021 VS 2025 VS 2032
- 5.5.2 Europe L-(+)-Ergothioneine Sales by Country (2021-2032)
- 5.5.3 Europe L-(+)-Ergothioneine Revenue by Country (2021-2032)
- 5.5.4 Germany
- 5.5.5 France
- 5.5.6 U.K.
- 5.5.7 Italy
- 5.5.8 Russia
- 5.5.9 Spain
- 5.5.10 Netherlands
- 5.5.11 Switzerland
- 5.5.12 Sweden
- 5.5.13 Poland
- 5.6 Asia Pacific L-(+)-Ergothioneine Market Facts & Figures by Country
- 5.6.1 Asia Pacific L-(+)-Ergothioneine Market Size by Country: 2021 VS 2025 VS 2032
- 5.6.2 Asia Pacific L-(+)-Ergothioneine Sales by Country (2021-2032)
- 5.6.3 Asia Pacific L-(+)-Ergothioneine Revenue by Country (2021-2032)
- 5.6.4 China
- 5.6.5 Japan
- 5.6.6 South Korea
- 5.6.7 India
- 5.6.8 Australia
- 5.6.9 Taiwan
- 5.6.10 Southeast Asia
- 5.7 South America L-(+)-Ergothioneine Market Facts & Figures by Country
- 5.7.1 South America L-(+)-Ergothioneine Market Size by Country: 2021 VS 2025 VS 2032
- 5.7.2 South America L-(+)-Ergothioneine Sales by Country (2021-2032)
- 5.7.3 South America L-(+)-Ergothioneine Revenue by Country (2021-2032)
- 5.7.4 Brazil
- 5.7.5 Argentina
- 5.7.6 Chile
- 5.7.7 Colombia
- 5.8 Middle East and Africa L-(+)-Ergothioneine Market Facts & Figures by Country
- 5.8.1 Middle East and Africa L-(+)-Ergothioneine Market Size by Country: 2021 VS 2025 VS 2032
- 5.8.2 Middle East and Africa L-(+)-Ergothioneine Sales by Country (2021-2032)
- 5.8.3 Middle East and Africa L-(+)-Ergothioneine Revenue by Country (2021-2032)
- 5.8.4 Egypt
- 5.8.5 South Africa
- 5.8.6 Israel
- 5.8.7 Türkiye
- 5.8.8 GCC Countries
6 Segment by Type
- 6.1 Global L-(+)-Ergothioneine Sales by Type (2021-2032)
- 6.1.1 Global L-(+)-Ergothioneine Sales by Type (2021-2032) & (kg)
- 6.1.2 Global L-(+)-Ergothioneine Sales Market Share by Type (2021-2032)
- 6.2 Global L-(+)-Ergothioneine Revenue by Type (2021-2032)
- 6.2.1 Global L-(+)-Ergothioneine Sales by Type (2021-2032) & (US$ Million)
- 6.2.2 Global L-(+)-Ergothioneine Revenue Market Share by Type (2021-2032)
- 6.3 Global L-(+)-Ergothioneine Price by Type (2021-2032)
7 Segment by Application
- 7.1 Global L-(+)-Ergothioneine Sales by Application (2021-2032)
- 7.1.1 Global L-(+)-Ergothioneine Sales by Application (2021-2032) & (kg)
- 7.1.2 Global L-(+)-Ergothioneine Sales Market Share by Application (2021-2032)
- 7.2 Global L-(+)-Ergothioneine Revenue by Application (2021-2032)
- 7.2.1 Global L-(+)-Ergothioneine Sales by Application (2021-2032) & (US$ Million)
- 7.2.2 Global L-(+)-Ergothioneine Revenue Market Share by Application (2021-2032)
- 7.3 Global L-(+)-Ergothioneine Price by Application (2021-2032)
8 Value Chain and Sales Channels Analysis of the Market
- 8.1 L-(+)-Ergothioneine Value Chain Analysis
- 8.1.1 L-(+)-Ergothioneine Key Raw Materials
- 8.1.2 Raw Materials Key Suppliers
- 8.1.3 L-(+)-Ergothioneine Production Mode & Process
- 8.2 L-(+)-Ergothioneine Sales Channels Analysis
- 8.2.1 Direct Comparison with Distribution Share
- 8.2.2 L-(+)-Ergothioneine Distributors
- 8.2.3 L-(+)-Ergothioneine Customers
9 Global L-(+)-Ergothioneine Analyzing Market Dynamics
- 9.1 L-(+)-Ergothioneine Industry Trends
- 9.2 L-(+)-Ergothioneine Industry Drivers
- 9.3 L-(+)-Ergothioneine Industry Opportunities and Challenges
- 9.4 L-(+)-Ergothioneine Industry Restraints
10 Report Conclusion
11 Disclaimer
GET THE RESEARCH
Choose your license.
Choose who needs access.
All options are for this report and research series.
PDF by email within 3–5 working days after payment confirmation.
Talk to an analyst