APO RESEARCH · REPORT
Foodservice Packaging
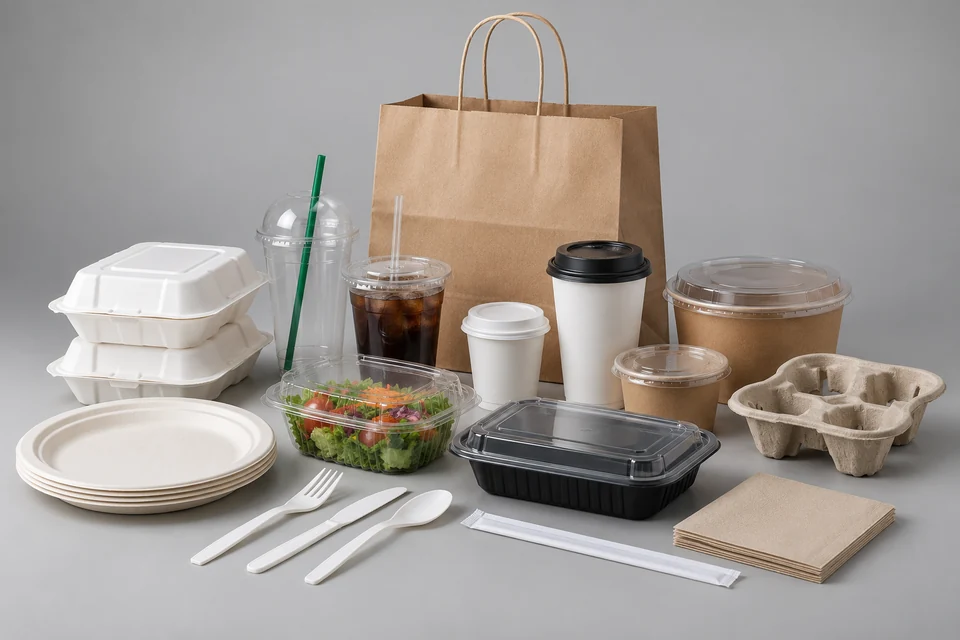
Foodservice packaging primarily includes single-use products such as cups (beverage and portion), plates, platters, bowls, trays, beverage carriers, bags (single portion and carry-out), containers, lids and domes, wraps, straws, cutlery and utensils for the service and/or packaging of prepared foods and beverages in foodservice establishments.
Product & engineering
Understand the product.
Foodservice packaging primarily includes single-use products such as cups (beverage and portion), plates, platters, bowls, trays, beverage carriers, bags (single portion and carry-out), containers, lids and domes, wraps, straws, cutlery and utensils for the service and/or packaging of prepared foods and beverages in foodservice establishments.
Today’s foodservice packaging choices include the more traditional Styrofoam and plastic options but also an array of new environmentally friendly choices including those made of paper, bagasse, cornstarch, and molded fiber. Foodservice packaging is largely, but not exclusively, made from recyclable paper, card and plastic.
The most commonly used plastics in foodservice packaging are polyethylene terephthalate (PET), recycled polyethylene terephthalate (RPET), polypropylene (PP), polystyrene (PS), expanded polystyrene (EPS) and high density [polyethylene (HDPE).
If 2023 was marked by a noticeable slowdown due to uncertainty, 2024 has been about the need for speed. The pressures weighing on the foodservice packaging industry have influenced this year's trends. Sustainability and the principles of sustainability in packaging have progressed from being a trend to a part of everyday business. The new trend appears to be the growing sense of urgency around packaging sustainability and the justification or rationalization of choices made in this space. Striving for sustainable packaging has gone beyond a "nice to have" to a required, if not now regulated, part of doing business. New legislation is creating added pressure across the industry and accelerating changes that demand careful planning and realistic timelines.
Considering the drive toward new and innovative materials and products, the pressure isn't all bad. These innovations help sustainability goals look new and fresh, all with performance attributes that help keep items at temperature and last longer. Notable changes include new coatings for fiber items that allow for reheating in the container and shifting away from color additives in favor of "natural" colored resin to help with end-of-life recyclability. The use of post-consumer recycled content also continues to grow in part due to customer commitments and the need to meet regulatory requirements. While this is a complex issue, especially regarding food contact packaging, we don't expect this trend to slow down any time soon.
Packaging materials are also receiving attention based on legislative and regulatory changes. As extended producer responsibility laws are implemented in several U.S. states, both foodservice operators and packaging manufacturers are left dealing with confusing and often conflicting approaches and targets. It may not be widespread, but we are seeing a greater focus on reusable items for dining at restaurants, event venues and school foodservice operations that may be tied to regulatory pressures and customer demand.
Adding to the pressure is the sliding scale of potential consequences around packaging decisions. Do companies switch portfolios from paper to plastics, plastics to paper, look at composability, recyclability or all of the above? Which attributes become the most important when selecting packaging that has to perform at an acceptable price point in a down market?
This year, a new standout for the industry was the number of mentions related to increased imports. From finished goods across multiple substrates to a rise in imported machinery, much of the U.S. and Canadian marketplace is thinking about this. A rise in imports has placed increased pressure on the industry to compete with both imported products and equipment. We also heard anecdotes about the rise in imported machinery leading to lower costs and shorter lead times for domestic equipment.
It's also important to mention the continued trend in mergers, acquisitions and consolidation that has led to tighter competition in the industry.
According to APO Research, the global Foodservice Packaging market was valued at US$ 62.21 billion in 2023 and is anticipated to reach US$ 93.49 billion by 2030, witnessing a CAGR of 7.36% from 2024 to 2030.
North American market for Foodservice Packaging is estimated to increase from $ 25.77 billion in 2024 to $ 41.48 billion by 2030, at a CAGR of 8.25 % from 2024 through 2030.
Asia-Pacific market for Foodservice Packaging is estimated to increase from $ 14.95 billion in 2024 to $ 22.47 million by 2030, at a CAGR of 7.03 % from 2024 through 2030.
The global market for Foodservice Packaging in Take Away/Delivery is estimated to increase from $ 23.53 billion in 2024 to $ 36.35 billion by 2030, at a CAGR of 7.52% from 2024 through 2030.
The major global companies of Foodservice Packaging include Graphic Packaging, Genpak, Sabert, Dart Container, Georgia-Pacific, Anchor Packaging, Pactiv Evergreen, D&W Fine Pack, and Berry Global. In 2023, the world's top three vendors accounted for approximately 16% of the revenue.
Packaging performance arises from the material, converted geometry, closure and filling or handling process. Material shipments, empty packs and filled-product sales are different objects and must be measured separately.
What turns activity into demand
Accepted filled packs create packaging demand through material per pack, converting yield and filling losses. The package, packaging material and the product it contains are different transaction objects.
The commercial boundary
For Foodservice Packaging, distinguish the supplied product from its inputs and the complete application. Report types and applications may overlap; retain the selected edition's product definition, geography, period, unit and transaction basis when comparing estimates.
Which conditions determine usable foodservice packaging performance?
Foodservice packaging primarily includes single-use products such as cups (beverage and portion), plates, platters, bowls, trays, beverage carriers, bags (single portion and carry-out), containers, lids and domes, wraps, straws, cutlery and utensils for the service and/or packaging of prepared foods and beverages in foodservice establishments. Verify barrier, sealing and mechanical requirements against the specified contents and handling duty. Relate accepted pack count to material intensity, converting yield and line loss; a material name alone does not establish pack performance.
Selected research
Industry Growth & Trends
Global Foodservice Packaging Industry Growth and Trends Forecast to 2032
Market perspective
Foodservice packaging primarily includes single-use products such as cups (beverage and portion), plates, platters, bowls, trays, beverage carriers, bags (single portion and carry-out), containers, lids and domes, wraps, straws, cutlery and utensils for the service and/or packaging of prepared foods and beverages in foodservice establishments.
Today’s foodservice packaging choices include the more traditional Styrofoam and plastic options but also an array of new environmentally friendly choices including those made of paper, bagasse, cornstarch, and molded fiber. Foodservice packaging is largely, but not exclusively, made from recyclable paper, card and plastic.
The most commonly used plastics in foodservice packaging are polyethylene terephthalate (PET), recycled polyethylene terephthalate (RPET), polypropylene (PP), polystyrene (PS), expanded polystyrene (EPS) and high density [polyethylene (HDPE).
Read the full market overview
If 2023 was marked by a noticeable slowdown due to uncertainty, 2024 has been about the need for speed. The pressures weighing on the foodservice packaging industry have influenced this year's trends. Sustainability and the principles of sustainability in packaging have progressed from being a trend to a part of everyday business. The new trend appears to be the growing sense of urgency around packaging sustainability and the justification or rationalization of choices made in this space. Striving for sustainable packaging has gone beyond a "nice to have" to a required, if not now regulated, part of doing business. New legislation is creating added pressure across the industry and accelerating changes that demand careful planning and realistic timelines.
Considering the drive toward new and innovative materials and products, the pressure isn't all bad. These innovations help sustainability goals look new and fresh, all with performance attributes that help keep items at temperature and last longer. Notable changes include new coatings for fiber items that allow for reheating in the container and shifting away from color additives in favor of "natural" colored resin to help with end-of-life recyclability. The use of post-consumer recycled content also continues to grow in part due to customer commitments and the need to meet regulatory requirements. While this is a complex issue, especially regarding food contact packaging, we don't expect this trend to slow down any time soon.
Packaging materials are also receiving attention based on legislative and regulatory changes. As extended producer responsibility laws are implemented in several U.S. states, both foodservice operators and packaging manufacturers are left dealing with confusing and often conflicting approaches and targets. It may not be widespread, but we are seeing a greater focus on reusable items for dining at restaurants, event venues and school foodservice operations that may be tied to regulatory pressures and customer demand.
Adding to the pressure is the sliding scale of potential consequences around packaging decisions. Do companies switch portfolios from paper to plastics, plastics to paper, look at composability, recyclability or all of the above? Which attributes become the most important when selecting packaging that has to perform at an acceptable price point in a down market?
This year, a new standout for the industry was the number of mentions related to increased imports. From finished goods across multiple substrates to a rise in imported machinery, much of the U.S. and Canadian marketplace is thinking about this. A rise in imports has placed increased pressure on the industry to compete with both imported products and equipment. We also heard anecdotes about the rise in imported machinery leading to lower costs and shorter lead times for domestic equipment.
It's also important to mention the continued trend in mergers, acquisitions and consolidation that has led to tighter competition in the industry.
According to APO Research, the global Foodservice Packaging market was valued at US$ 62.21 billion in 2023 and is anticipated to reach US$ 93.49 billion by 2030, witnessing a CAGR of 7.36% from 2024 to 2030.
North American market for Foodservice Packaging is estimated to increase from $ 25.77 billion in 2024 to $ 41.48 billion by 2030, at a CAGR of 8.25 % from 2024 through 2030.
Asia-Pacific market for Foodservice Packaging is estimated to increase from $ 14.95 billion in 2024 to $ 22.47 million by 2030, at a CAGR of 7.03 % from 2024 through 2030.
The global market for Foodservice Packaging in Take Away/Delivery is estimated to increase from $ 23.53 billion in 2024 to $ 36.35 billion by 2030, at a CAGR of 7.52% from 2024 through 2030.
The major global companies of Foodservice Packaging include Graphic Packaging, Genpak, Sabert, Dart Container, Georgia-Pacific, Anchor Packaging, Pactiv Evergreen, D&W Fine Pack, and Berry Global. In 2023, the world's top three vendors accounted for approximately 16% of the revenue.
According to APO Research, the global Foodservice Packaging market was valued at US$ million in 2026 and is projected to reach US$ million by 2032, implying a CAGR of xx% over 2026-2032.
The North America market for Foodservice Packaging is projected to increase from US$ million in 2026 to US$ million by 2032, corresponding to a CAGR of % over 2026-2032.
The Europe market for Foodservice Packaging is projected to increase from US$ million in 2026 to US$ million by 2032, registering a CAGR of % over 2026-2032.
The Asia Pacific market for Foodservice Packaging is projected to increase from US$ million in 2026 to US$ million by 2032, at a CAGR of % over 2026-2032.
Leading global companies in the Foodservice Packaging market include Novolex, Dart Container, Huhtamaki, Pactiv Evergreen, Graphic Packaging, Sabert, Klöckner Pentaplast, WinCup and Amcor, among others. In 2025, the top three vendors together accounted for approximately % of global revenue.
Report Scope
This report provides a structured, data-driven view of the global Foodservice Packaging market, combining harmonized quantitative metrics with targeted qualitative insight to support business and growth strategy, market positioning, and capital allocation.
The Foodservice Packaging market size, estimates, and forecasts are presented in terms of revenue (US$ million), with 2025 as the base year and historical and forecast data for 2021-2032. The report segments the global Foodservice Packaging market by Type, Application, region/country, and company, provides regional market sizes at the segment level, profiles the competitive landscape and key players and their market ranks, and reviews technology trends and new product developments relevant to Foodservice Packaging.
Key Companies & Market Share Insights
This section analyzes the strategies and performance of leading companies in the global Foodservice Packaging market, including portfolio focus, innovation and product development, mergers and acquisitions, collaborations, and geographic expansion used to sustain or enhance competitive positions. It also summarizes recent corporate developments and key financial indicators and provides global revenue and gross margin data by manufacturer for 2021-2026, enabling benchmarking of scale, profitability, and market share and supporting assessment of market concentration through indicators such as CR5 and CR10.
Foodservice Packaging Market by Company
Novolex
Dart Container
Huhtamaki
Pactiv Evergreen
Graphic Packaging
Sabert
Klöckner Pentaplast
WinCup
Amcor
Genpak
D&W Fine Pack
Anchor Packaging
WestRock
Coveris
Cascades
Berry Global
Georgia-Pacific
Southern Champion Tray
Fuling Technology
Hefei Hengxin Life Science
Ningbo Homelink Eco-iTech
Zhejiang Pando Ep Technology
King Yuan Fu Packaging
CP Flexible Packaging
Fujian Nanwang
Foodservice Packaging Segment by Type
Flexible Packaging
Rigid Packaging
Paper & Paperboard
Others
Foodservice Packaging Segment by Application
Take Away/Delivery
Restaurants
Institutional Catering
HMR (Hotel Motel Restaurant)
Other
Foodservice Packaging Segment by Region
North America
United States
Canada
Mexico
Europe
Germany
France
U.K.
Italy
Russia
Spain
Netherlands
Switzerland
Sweden
Poland
Asia-Pacific
China
Japan
South Korea
India
Australia
Taiwan
Southeast Asia
South America
Brazil
Argentina
Chile
Middle East & Africa
Egypt
South Africa
Israel
Türkiye
GCC Countries
Key Drivers & Barriers
High-impact rendering factors and drivers have been studied in this report to aid the readers to understand the general development. Moreover, the report includes restraints and challenges that may act as stumbling blocks on the way of the players. This will assist the users to be attentive and make informed decisions related to business. Specialists have also laid their focus on the upcoming business prospects.
Reasons to Buy This Report
1. This report will help the readers to understand the competition within the industries and strategies for the competitive environment to enhance the potential profit. The report also focuses on the competitive landscape of the global Foodservice Packaging market, and introduces in detail the market share, industry ranking, competitor ecosystem, market performance, new product development, operation situation, expansion, and acquisition. etc. of the main players, which helps the readers to identify the main competitors and deeply understand the competition pattern of the market.
2. This report will help stakeholders to understand the global industry status and trends of Foodservice Packaging and provides them with information on key market drivers, restraints, challenges, and opportunities.
3. This report will help stakeholders to understand competitors better and gain more insights to strengthen their position in their businesses. The competitive landscape section includes the market share and rank (in value), competitor ecosystem, new product development, expansion, and acquisition.
4. This report stays updated with novel technology integration, features, and the latest developments in the market
5. This report helps stakeholders to gain insights into which regions to target globally
6. This report helps stakeholders to gain insights into the end-user perception concerning the adoption of Foodservice Packaging.
7. This report helps stakeholders to identify some of the key players in the market and understand their valuable contribution.
Chapter Outline
Chapter 1: Introduces the report scope of the report, executive summary of global and regional market size and CAGR for the history and forecast period (2021-2025, 2026-2031). It offers a high-level view of the current state of the market and its likely evolution in the short to mid-term, and long term.
Chapter 2: Provides the analysis of various market segments by type, covering the market size and development potential of each market segment, to help readers find the blue ocean market in different market segments.
Chapter 3: Provides the analysis of various market segments by application, covering the market size and development potential of each market segment, to help readers find the blue ocean market in different downstream markets.
Chapter 4: Introduces the market dynamics, latest developments of the market, the driving factors and restrictive factors of the market, the challenges and risks faced by manufacturers in the industry, and the analysis of relevant policies in the industry.
Chapter 5: Detailed analysis of Foodservice Packaging companies' competitive landscape, revenue, market share and ranking, latest development plan, merger, and acquisition information, etc.
Chapter 6: Provides profiles of key players, introducing the basic situation of the main companies in the market in detail, including product introduction, revenue, recent development, etc.
Chapter 7, 8, 9, 10 and 11: North America, Europe, Asia Pacific, South America, Middle East & Africa, revenue by country.
Chapter 12: Concluding Insights of the report
More report detail
Tables and figures
Scope & coverage.
Types
- Flexible Packaging
- Rigid Packaging
- Paper & Paperboard
- Others
Applications
- Take Away/Delivery
- Restaurants
- Institutional Catering
- HMR (Hotel Motel Restaurant)
- Other
Companies covered
- Novolex
- Dart Container
- Huhtamaki
- Pactiv Evergreen
- Graphic Packaging
- Sabert
- Klöckner Pentaplast
- WinCup
- Amcor
- Genpak
- D&W Fine Pack
- Anchor Packaging
- WestRock
- Coveris
- Cascades
- Berry Global
- Georgia-Pacific
- Southern Champion Tray
- Fuling Technology
- Hefei Hengxin Life Science
- Ningbo Homelink Eco-iTech
- Zhejiang Pando Ep Technology
- King Yuan Fu Packaging
- CP Flexible Packaging
- Fujian Nanwang
Inside the report.
1 Market Overview
- 1.1 Product Definition
- 1.2 Global Market Growth Prospects
- 1.3 Global Foodservice Packaging Market Size Overview by Region 2021 VS 2025 VS 2032
- 1.4 Global Foodservice Packaging Market Size by Region (2021-2032)
- 1.4.1 Global Foodservice Packaging Market Size by Region (2021-2026)
- 1.4.2 Global Foodservice Packaging Market Size by Region (2027-2032)
- 1.5 Key Regions Foodservice Packaging Market Size (2021-2032)
- 1.5.1 North America Foodservice Packaging Market Size Growth Rate (2021-2032)
- 1.5.2 Europe Foodservice Packaging Market Size Growth Rate (2021-2032)
- 1.5.3 Asia-Pacific Foodservice Packaging Market Size Growth Rate (2021-2032)
- 1.5.4 South America Foodservice Packaging Market Size Growth Rate (2021-2032)
- 1.5.5 Middle East & Africa Foodservice Packaging Market Size Growth Rate (2021-2032)
2 Foodservice Packaging Market by Type
- 2.1 Type Introduction
- 2.1.1 Flexible Packaging
- 2.1.2 Rigid Packaging
- 2.1.3 Paper & Paperboard
- 2.1.4 Others
- 2.2 Global Foodservice Packaging Market Size by Type
- 2.2.1 Global Foodservice Packaging Market Size Overview by Type (2021-2032)
- 2.2.2 Global Foodservice Packaging Historic Market Size Review by Type (2021-2026)
- 2.2.3 Global Foodservice Packaging Market Size Forecasted by Type (2027-2032)
- 2.3 Global Foodservice Packaging Market Size by Regions
- 2.3.1 North America Foodservice Packaging Market Size Breakdown by Type (2021-2026)
- 2.3.2 Europe Foodservice Packaging Market Size Breakdown by Type (2021-2026)
- 2.3.3 Asia-Pacific Foodservice Packaging Market Size Breakdown by Type (2021-2026)
- 2.3.4 South America Foodservice Packaging Market Size Breakdown by Type (2021-2026)
- 2.3.5 Middle East and Africa Foodservice Packaging Market Size Breakdown by Type (2021-2026)
3 Foodservice Packaging Market by Application
- 3.1 Type Introduction
- 3.1.1 Take Away/Delivery
- 3.1.2 Restaurants
- 3.1.3 Institutional Catering
- 3.1.4 HMR (Hotel Motel Restaurant)
- 3.1.5 Other
- 3.2 Global Foodservice Packaging Market Size by Application
- 3.2.1 Global Foodservice Packaging Market Size Overview by Application (2021-2032)
- 3.2.2 Global Foodservice Packaging Historic Market Size Review by Application (2021-2026)
- 3.2.3 Global Foodservice Packaging Market Size Forecasted by Application (2027-2032)
- 3.3 Global Foodservice Packaging Market Size by Regions
- 3.3.1 North America Foodservice Packaging Market Size Breakdown by Application (2021-2026)
- 3.3.2 Europe Foodservice Packaging Market Size Breakdown by Application (2021-2026)
- 3.3.3 Asia-Pacific Foodservice Packaging Market Size Breakdown by Application (2021-2026)
- 3.3.4 South America Foodservice Packaging Market Size Breakdown by Application (2021-2026)
- 3.3.5 Middle East and Africa Foodservice Packaging Market Size Breakdown by Application (2021-2026)
4 Global Market Dynamics
- 4.1 Foodservice Packaging Industry Trends
- 4.2 Foodservice Packaging Industry Drivers
- 4.3 Foodservice Packaging Industry Opportunities and Challenges
- 4.4 Foodservice Packaging Industry Restraints
5 Competitive Insights by Company
- 5.1 Global Top Players by Foodservice Packaging Revenue (2021-2026)
- 5.2 Global Foodservice Packaging Industry Company Ranking, 2024 VS 2025 VS 2026
- 5.3 Global Foodservice Packaging Key Company Headquarters & Area Served
- 5.4 Global Foodservice Packaging Company, Product Type & Application
- 5.5 Global Foodservice Packaging Company Commercialization Time
- 5.6 Market Competitive Analysis
- 5.6.1 Global Foodservice Packaging Market CR5 and HHI
- 5.6.2 Global Top 5 and 10 Foodservice Packaging Players Market Share by Revenue in 2025
- 5.6.3 2025 Foodservice Packaging Tier 1, Tier 2, and Tier 3
6 Company Profiles
- 6.1 Novolex
- 6.1.1 Novolex Company Information
- 6.1.2 Novolex Business Overview
- 6.1.3 Novolex Foodservice Packaging Revenue, Global Share and Gross Margin (2021-2026)
- 6.1.4 Novolex Foodservice Packaging Product Portfolio
- 6.1.5 Novolex Recent Developments
- 6.2 Dart Container
- 6.2.1 Dart Container Company Information
- 6.2.2 Dart Container Business Overview
- 6.2.3 Dart Container Foodservice Packaging Revenue, Global Share and Gross Margin (2021-2026)
- 6.2.4 Dart Container Foodservice Packaging Product Portfolio
- 6.2.5 Dart Container Recent Developments
- 6.3 Huhtamaki
- 6.3.1 Huhtamaki Company Information
- 6.3.2 Huhtamaki Business Overview
- 6.3.3 Huhtamaki Foodservice Packaging Revenue, Global Share and Gross Margin (2021-2026)
- 6.3.4 Huhtamaki Foodservice Packaging Product Portfolio
- 6.3.5 Huhtamaki Recent Developments
- 6.4 Pactiv Evergreen
- 6.4.1 Pactiv Evergreen Company Information
- 6.4.2 Pactiv Evergreen Business Overview
- 6.4.3 Pactiv Evergreen Foodservice Packaging Revenue, Global Share and Gross Margin (2021-2026)
- 6.4.4 Pactiv Evergreen Foodservice Packaging Product Portfolio
- 6.4.5 Pactiv Evergreen Recent Developments
- 6.5 Graphic Packaging
- 6.5.1 Graphic Packaging Company Information
- 6.5.2 Graphic Packaging Business Overview
- 6.5.3 Graphic Packaging Foodservice Packaging Revenue, Global Share and Gross Margin (2021-2026)
- 6.5.4 Graphic Packaging Foodservice Packaging Product Portfolio
- 6.5.5 Graphic Packaging Recent Developments
- 6.6 Sabert
- 6.6.1 Sabert Company Information
- 6.6.2 Sabert Business Overview
- 6.6.3 Sabert Foodservice Packaging Revenue, Global Share and Gross Margin (2021-2026)
- 6.6.4 Sabert Foodservice Packaging Product Portfolio
- 6.6.5 Sabert Recent Developments
- 6.7 Klöckner Pentaplast
- 6.7.1 Klöckner Pentaplast Company Information
- 6.7.2 Klöckner Pentaplast Business Overview
- 6.7.3 Klöckner Pentaplast Foodservice Packaging Revenue, Global Share and Gross Margin (2021-2026)
- 6.7.4 Klöckner Pentaplast Foodservice Packaging Product Portfolio
- 6.7.5 Klöckner Pentaplast Recent Developments
- 6.8 WinCup
- 6.8.1 WinCup Company Information
- 6.8.2 WinCup Business Overview
- 6.8.3 WinCup Foodservice Packaging Revenue, Global Share and Gross Margin (2021-2026)
- 6.8.4 WinCup Foodservice Packaging Product Portfolio
- 6.8.5 WinCup Recent Developments
- 6.9 Amcor
- 6.9.1 Amcor Company Information
- 6.9.2 Amcor Business Overview
- 6.9.3 Amcor Foodservice Packaging Revenue, Global Share and Gross Margin (2021-2026)
- 6.9.4 Amcor Foodservice Packaging Product Portfolio
- 6.9.5 Amcor Recent Developments
- 6.10 Genpak
- 6.10.1 Genpak Company Information
- 6.10.2 Genpak Business Overview
- 6.10.3 Genpak Foodservice Packaging Revenue, Global Share and Gross Margin (2021-2026)
- 6.10.4 Genpak Foodservice Packaging Product Portfolio
- 6.10.5 Genpak Recent Developments
- 6.11 D&W Fine Pack
- 6.11.1 D&W Fine Pack Company Information
- 6.11.2 D&W Fine Pack Business Overview
- 6.11.3 D&W Fine Pack Foodservice Packaging Revenue, Global Share and Gross Margin (2021-2026)
- 6.11.4 D&W Fine Pack Foodservice Packaging Product Portfolio
- 6.11.5 D&W Fine Pack Recent Developments
- 6.12 Anchor Packaging
- 6.12.1 Anchor Packaging Company Information
- 6.12.2 Anchor Packaging Business Overview
- 6.12.3 Anchor Packaging Foodservice Packaging Revenue, Global Share and Gross Margin (2021-2026)
- 6.12.4 Anchor Packaging Foodservice Packaging Product Portfolio
- 6.12.5 Anchor Packaging Recent Developments
- 6.13 WestRock
- 6.13.1 WestRock Company Information
- 6.13.2 WestRock Business Overview
- 6.13.3 WestRock Foodservice Packaging Revenue, Global Share and Gross Margin (2021-2026)
- 6.13.4 WestRock Foodservice Packaging Product Portfolio
- 6.13.5 WestRock Recent Developments
- 6.14 Coveris
- 6.14.1 Coveris Company Information
- 6.14.2 Coveris Business Overview
- 6.14.3 Coveris Foodservice Packaging Revenue, Global Share and Gross Margin (2021-2026)
- 6.14.4 Coveris Foodservice Packaging Product Portfolio
- 6.14.5 Coveris Recent Developments
- 6.15 Cascades
- 6.15.1 Cascades Company Information
- 6.15.2 Cascades Business Overview
- 6.15.3 Cascades Foodservice Packaging Revenue, Global Share and Gross Margin (2021-2026)
- 6.15.4 Cascades Foodservice Packaging Product Portfolio
- 6.15.5 Cascades Recent Developments
- 6.16 Berry Global
- 6.16.1 Berry Global Company Information
- 6.16.2 Berry Global Business Overview
- 6.16.3 Berry Global Foodservice Packaging Revenue, Global Share and Gross Margin (2021-2026)
- 6.16.4 Berry Global Foodservice Packaging Product Portfolio
- 6.16.5 Berry Global Recent Developments
- 6.17 Georgia-Pacific
- 6.17.1 Georgia-Pacific Company Information
- 6.17.2 Georgia-Pacific Business Overview
- 6.17.3 Georgia-Pacific Foodservice Packaging Revenue, Global Share and Gross Margin (2021-2026)
- 6.17.4 Georgia-Pacific Foodservice Packaging Product Portfolio
- 6.17.5 Georgia-Pacific Recent Developments
- 6.18 Southern Champion Tray
- 6.18.1 Southern Champion Tray Company Information
- 6.18.2 Southern Champion Tray Business Overview
- 6.18.3 Southern Champion Tray Foodservice Packaging Revenue, Global Share and Gross Margin (2021-2026)
- 6.18.4 Southern Champion Tray Foodservice Packaging Product Portfolio
- 6.18.5 Southern Champion Tray Recent Developments
- 6.19 Fuling Technology
- 6.19.1 Fuling Technology Company Information
- 6.19.2 Fuling Technology Business Overview
- 6.19.3 Fuling Technology Foodservice Packaging Revenue, Global Share and Gross Margin (2021-2026)
- 6.19.4 Fuling Technology Foodservice Packaging Product Portfolio
- 6.19.5 Fuling Technology Recent Developments
- 6.20 Hefei Hengxin Life Science
- 6.20.1 Hefei Hengxin Life Science Company Information
- 6.20.2 Hefei Hengxin Life Science Business Overview
- 6.20.3 Hefei Hengxin Life Science Foodservice Packaging Revenue, Global Share and Gross Margin (2021-2026)
- 6.20.4 Hefei Hengxin Life Science Foodservice Packaging Product Portfolio
- 6.20.5 Hefei Hengxin Life Science Recent Developments
- 6.21 Ningbo Homelink Eco-iTech
- 6.21.1 Ningbo Homelink Eco-iTech Company Information
- 6.21.2 Ningbo Homelink Eco-iTech Business Overview
- 6.21.3 Ningbo Homelink Eco-iTech Foodservice Packaging Revenue, Global Share and Gross Margin (2021-2026)
- 6.21.4 Ningbo Homelink Eco-iTech Foodservice Packaging Product Portfolio
- 6.21.5 Ningbo Homelink Eco-iTech Recent Developments
- 6.22 Zhejiang Pando Ep Technology
- 6.22.1 Zhejiang Pando Ep Technology Company Information
- 6.22.2 Zhejiang Pando Ep Technology Business Overview
- 6.22.3 Zhejiang Pando Ep Technology Foodservice Packaging Revenue, Global Share and Gross Margin (2021-2026)
- 6.22.4 Zhejiang Pando Ep Technology Foodservice Packaging Product Portfolio
- 6.22.5 Zhejiang Pando Ep Technology Recent Developments
- 6.23 King Yuan Fu Packaging
- 6.23.1 King Yuan Fu Packaging Company Information
- 6.23.2 King Yuan Fu Packaging Business Overview
- 6.23.3 King Yuan Fu Packaging Foodservice Packaging Revenue, Global Share and Gross Margin (2021-2026)
- 6.23.4 King Yuan Fu Packaging Foodservice Packaging Product Portfolio
- 6.23.5 King Yuan Fu Packaging Recent Developments
- 6.24 CP Flexible Packaging
- 6.24.1 CP Flexible Packaging Company Information
- 6.24.2 CP Flexible Packaging Business Overview
- 6.24.3 CP Flexible Packaging Foodservice Packaging Revenue, Global Share and Gross Margin (2021-2026)
- 6.24.4 CP Flexible Packaging Foodservice Packaging Product Portfolio
- 6.24.5 CP Flexible Packaging Recent Developments
- 6.25 Fujian Nanwang
- 6.25.1 Fujian Nanwang Company Information
- 6.25.2 Fujian Nanwang Business Overview
- 6.25.3 Fujian Nanwang Foodservice Packaging Revenue, Global Share and Gross Margin (2021-2026)
- 6.25.4 Fujian Nanwang Foodservice Packaging Product Portfolio
- 6.25.5 Fujian Nanwang Recent Developments
7 North America
- 7.1 North America Foodservice Packaging Market Size Growth Rate (CAGR) by Country: 2021 VS 2025 VS 2032
- 7.2 North America Foodservice Packaging Market Size by Country (2021-2026)
- 7.3 North America Foodservice Packaging Market Size Forecast by Country (2027-2032)
8 Europe
- 8.1 Europe Foodservice Packaging Market Size Growth Rate (CAGR) by Country: 2021 VS 2025 VS 2032
- 8.2 Europe Foodservice Packaging Market Size by Country (2021-2026)
- 8.3 Europe Foodservice Packaging Market Size Forecast by Country (2027-2032)
9 Asia-Pacific
- 9.1 Asia-Pacific Foodservice Packaging Market Size Growth Rate (CAGR) by Country: 2021 VS 2025 VS 2032
- 9.2 Asia-Pacific Foodservice Packaging Market Size by Country (2021-2026)
- 9.3 Asia-Pacific Foodservice Packaging Market Size Forecast by Country (2027-2032)
10 South America
- 10.1 South America Foodservice Packaging Market Size Growth Rate (CAGR) by Country: 2021 VS 2025 VS 2032
- 10.2 South America Foodservice Packaging Market Size by Country (2021-2026)
- 10.3 South America Foodservice Packaging Market Size Forecast by Country (2027-2032)
11 Middle East & Africa
- 11.1 Middle East & Africa Foodservice Packaging Market Size Growth Rate (CAGR) by Country: 2021 VS 2025 VS 2032
- 11.2 Middle East & Africa Foodservice Packaging Market Size by Country (2021-2026)
- 11.3 Middle East & Africa Foodservice Packaging Market Size Forecast by Country (2027-2032)
12 Concluding Insights
13 Appendix
- 13.1 Reasons for Doing This Study
- 13.2 Research Methodology
- 13.3 Research Process
- 13.4 Authors List of This Report
- 13.5 Data Source
- 13.5.1 Secondary Sources
- 13.5.2 Primary Sources
GET THE RESEARCH
Choose your license.
Choose who needs access.
All options are for this report and research series.
PDF by email within 3–5 working days after payment confirmation.
Talk to an analyst