APO RESEARCH · REPORT
Fructooligosaccharide (FOS)
Fructooligosaccharides (FOS) are short-chain fructans used as prebiotic carbohydrates in foods, beverages, and dietary supplements. In industrial practice, “FOS” typically refers to a defined mixture of low–degree-of-polymerization fructose oligomers that resist hydrolysis by human small-intestinal enzymes and reach the colon largely intact, where they serve as fermentable substrates for selected gut microbes.
Product & engineering
Understand the product.
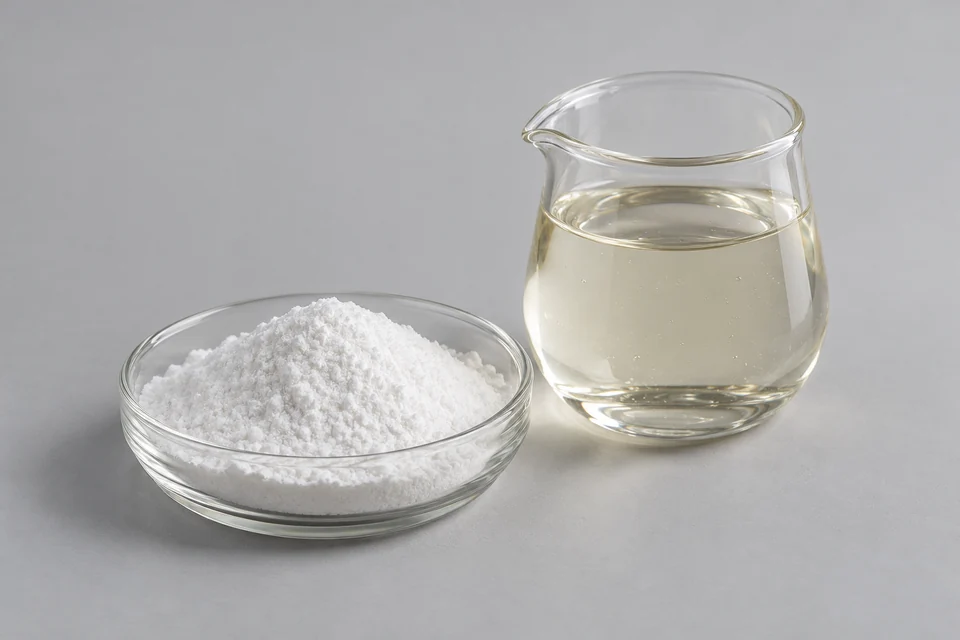
Fructooligosaccharides (FOS) are short-chain fructans used as prebiotic carbohydrates in foods, beverages, and dietary supplements. In industrial practice, “FOS” typically refers to a defined mixture of low–degree-of-polymerization fructose oligomers that resist hydrolysis by human small-intestinal enzymes and reach the colon largely intact, where they serve as fermentable substrates for selected gut microbes. Commercial FOS are commonly supplied as syrups (FOS-enriched solids dissolved in water) or as high-purity powders standardized by FOS content and oligomer distribution.
Structurally, FOS are built from fructofuranosyl units linked primarily by β-(2→1) glycosidic bonds, usually terminating in a sucrose-derived glucose at the reducing end. The dominant species in many commercial FOS streams are “GFn” molecules (glucose plus n fructose units), such as 1-kestose (GF2), nystose (GF3), and 1F-fructofuranosylnystose (GF4). Depending on enzyme system and reaction conditions, minor β-(2→6) linkages or branched structures can appear, but short-chain linear β-(2→1) fructans typically define the product. This structural motif is the basis for FOS’ selective fermentability and its physicochemical behavior in aqueous systems.
FOS occur naturally at low levels in various plants (as part of broader fructan metabolism), but the modern supply chain is predominantly microbial- and enzyme-driven rather than plant-extracted. The core biocatalysts are fructosyltransferase and related β-fructofuranosidase activities that catalyze transfructosylation from sucrose to acceptor molecules, building β-(2→1)-linked fructosyl chains. These enzyme activities are commonly produced by microorganisms in fermentation (for enzyme manufacture) and then applied as isolated enzymes, or generated in situ by production strains. Industrially relevant microbial sources for fructosyltransferase activity include filamentous fungi and yeasts (frequently used for high enzyme titers) as well as selected bacteria; the choice is driven by enzyme specificity (transfer versus hydrolysis), thermostability, pH profile, and the resulting FOS oligomer distribution.
Functionally, FOS are classified as prebiotic carbohydrates because they are preferentially utilized by subsets of colonic microbiota, supporting shifts in community structure and metabolic output. Their fermentation produces short-chain fatty acids (notably acetate, with variable propionate and butyrate depending on cross-feeding), which contribute to luminal pH reduction and can influence gut barrier function and colonic physiology. Clinically relevant benefits most consistently associated with FOS intake include improved bowel habits through increased fermentation and osmotic water retention, support of beneficial taxa (often described as bifidogenic effects), and enhanced mineral absorption under certain dietary contexts via acidification and changes in solubility in the distal gut. As a carbohydrate ingredient, FOS also provide reduced caloric contribution relative to digestible sugars, attenuated postprandial glycemic response compared with sucrose or glucose, and low cariogenic potential because oral bacteria generally metabolize FOS less efficiently than simple sugars and because FOS is often used to partially replace fermentable mono- and disaccharides.
The predominant production technology is enzymatic conversion of sucrose via transfructosylation. A concentrated sucrose solution is reacted with fructosyltransferase-active preparations under controlled temperature and pH to maximize fructosyl transfer (formation of FOS) while minimizing competing hydrolysis (formation of free glucose and fructose). Process control focuses on substrate concentration, water activity, residence time, and enzyme selection, which jointly define yield and the DP profile (the distribution of GF2, GF3, GF4, and higher oligomers). Industrial configurations range from batch reactors to continuous stirred systems, packed beds with immobilized enzymes, and membrane-assisted reactors designed to manage product inhibition and steer chain-length distribution by selectively removing low-molecular-weight sugars. Alternative routes include fermentation-based in situ conversion where microorganisms expressing the relevant enzymes transform sucrose directly; however, even in such systems the chemistry remains an enzyme-catalyzed transfructosylation, and downstream purification requirements are similar.
The crude reaction mixture is a multi-sugar matrix: target FOS oligomers plus residual sucrose and byproduct monosaccharides (glucose and fructose), along with salts, color bodies, and trace proteins depending on enzyme preparation and processing aids. Recovery begins with clarification to remove suspended solids and, where relevant, biomass or enzyme carrier fines, typically using filtration and/or centrifugation. Decolorization and removal of hydrophobic impurities are commonly achieved with activated carbon or equivalent adsorption steps. Demineralization and removal of ionic contaminants are performed via ion-exchange resins, which also improve color stability and taste neutrality in finished food-grade ingredients.
Purification strategy depends on the required specification. For FOS syrups positioned as functional sweeteners or fiber ingredients, manufacturers often accept an “FOS-enriched” composition and focus on controlling residual mono- and disaccharides to meet sweetness and labeling targets. For high-purity FOS powders, separation becomes the central unit operation: chromatographic fractionation (including continuous approaches such as simulated moving bed chromatography) is widely used to separate FOS from glucose, fructose, and residual sucrose based on subtle differences in molecular size and interaction profiles. Membrane processes (ultrafiltration for macromolecule removal, nanofiltration for partial sugar fractionation) can be used as upstream concentration and cleanup tools, but they generally do not replace chromatography when very high FOS purity or tight DP control is required. Final concentration is achieved by vacuum evaporation to manage thermal load, followed by drying—often spray drying—to produce a free-flowing powder, with attention to glass transition behavior, hygroscopicity, and caking control through solids content, inlet/outlet temperatures, and optional carrier selection.
FOS’ functional properties in formulations derive from both its oligomeric nature and its residual sugar composition. FOS provides mild sweetness (lower than sucrose) with a clean taste profile, high water solubility, and generally low viscosity at typical use levels, enabling sugar reduction without the mouthfeel penalties associated with some higher-molecular-weight fibers. It acts as a humectant and can reduce water activity, supporting texture retention in baked goods, bars, and confections. Thermal stability is generally adequate for many food processes, but stability decreases under strong acid and high-temperature conditions where glycosidic bonds can hydrolyze; therefore, low pH hot-fill or extended high-heat treatment can shift the profile toward shorter sugars, increasing sweetness and fermentability while reducing labeled fiber contribution. Residual reducing sugars (glucose/fructose) can participate in Maillard reactions, which may be beneficial (browning) or detrimental (color drift, off-flavors) depending on the application; this is one reason high-purity grades are preferred for clear beverages, delicately flavored products, or systems requiring tight color control.
From a production and quality standpoint, specification control centers on FOS content, DP distribution, residual mono- and disaccharides, moisture, ash, color, and microbiological limits. Analytical control typically relies on chromatographic methods capable of resolving GF2–GF4 and quantifying residual sucrose and monosaccharides, because these parameters determine both physiological positioning (fiber and prebiotic function) and formulation performance (sweetness, water activity, browning tendency). In well-controlled manufacturing, the process is essentially a conversion-and-separation platform: enzyme specificity and reaction engineering set the oligomer map, while downstream fractionation and polishing steps define the commercial grade—syrup versus powder, fiber-focused versus sweetness-focused, and broad-mixture versus high-purity FOS.
The supplied food or ingredient must be defined by composition, processing and storage form. Product labels such as natural, reduced sugar or high protein do not by themselves establish a uniform formulation, nutritional result or market boundary.
What turns activity into demand
Accepted recipes and sold servings create ingredient or finished-food purchases through inclusion, yield and storage loss. Ingredient mass, finished-product sales and food-service revenue are different measurement bases.
The commercial boundary
For Fructooligosaccharide (FOS), distinguish the supplied product from its inputs and the complete application. Report types and applications may overlap; retain the selected edition's product definition, geography, period, unit and transaction basis when comparing estimates.
What defines the supplied fructooligosaccharide (fos) offering?
Fructooligosaccharides (FOS) are short-chain fructans used as prebiotic carbohydrates in foods, beverages, and dietary supplements. In industrial practice, “FOS” typically refers to a defined mixture of low–degree-of-polymerization fructose oligomers that resist hydrolysis by human small-intestinal enzymes and reach the colon largely intact, where they serve as fermentable substrates for selected gut microbes. Compare moisture or solids, ingredient content, packaging and shelf-life conditions on the same basis. Separate ingredient deliveries from finished-food sales and retain the relevant manufacturing yield; retail value cannot substitute for ingredient volume.
Selected research
Industry Growth & Trends
Global Fructooligosaccharide (FOS) Industry Growth and Trends Forecast to 2032
Market perspective
Fructooligosaccharides (FOS) are short-chain fructans used as prebiotic carbohydrates in foods, beverages, and dietary supplements. In industrial practice, “FOS” typically refers to a defined mixture of low–degree-of-polymerization fructose oligomers that resist hydrolysis by human small-intestinal enzymes and reach the colon largely intact, where they serve as fermentable substrates for selected gut microbes. Commercial FOS are commonly supplied as syrups (FOS-enriched solids dissolved in water) or as high-purity powders standardized by FOS content and oligomer distribution.
Structurally, FOS are built from fructofuranosyl units linked primarily by β-(2→1) glycosidic bonds, usually terminating in a sucrose-derived glucose at the reducing end. The dominant species in many commercial FOS streams are “GFn” molecules (glucose plus n fructose units), such as 1-kestose (GF2), nystose (GF3), and 1F-fructofuranosylnystose (GF4). Depending on enzyme system and reaction conditions, minor β-(2→6) linkages or branched structures can appear, but short-chain linear β-(2→1) fructans typically define the product. This structural motif is the basis for FOS’ selective fermentability and its physicochemical behavior in aqueous systems.
FOS occur naturally at low levels in various plants (as part of broader fructan metabolism), but the modern supply chain is predominantly microbial- and enzyme-driven rather than plant-extracted. The core biocatalysts are fructosyltransferase and related β-fructofuranosidase activities that catalyze transfructosylation from sucrose to acceptor molecules, building β-(2→1)-linked fructosyl chains. These enzyme activities are commonly produced by microorganisms in fermentation (for enzyme manufacture) and then applied as isolated enzymes, or generated in situ by production strains. Industrially relevant microbial sources for fructosyltransferase activity include filamentous fungi and yeasts (frequently used for high enzyme titers) as well as selected bacteria; the choice is driven by enzyme specificity (transfer versus hydrolysis), thermostability, pH profile, and the resulting FOS oligomer distribution.
Read the full market overview
Functionally, FOS are classified as prebiotic carbohydrates because they are preferentially utilized by subsets of colonic microbiota, supporting shifts in community structure and metabolic output. Their fermentation produces short-chain fatty acids (notably acetate, with variable propionate and butyrate depending on cross-feeding), which contribute to luminal pH reduction and can influence gut barrier function and colonic physiology. Clinically relevant benefits most consistently associated with FOS intake include improved bowel habits through increased fermentation and osmotic water retention, support of beneficial taxa (often described as bifidogenic effects), and enhanced mineral absorption under certain dietary contexts via acidification and changes in solubility in the distal gut. As a carbohydrate ingredient, FOS also provide reduced caloric contribution relative to digestible sugars, attenuated postprandial glycemic response compared with sucrose or glucose, and low cariogenic potential because oral bacteria generally metabolize FOS less efficiently than simple sugars and because FOS is often used to partially replace fermentable mono- and disaccharides.
The predominant production technology is enzymatic conversion of sucrose via transfructosylation. A concentrated sucrose solution is reacted with fructosyltransferase-active preparations under controlled temperature and pH to maximize fructosyl transfer (formation of FOS) while minimizing competing hydrolysis (formation of free glucose and fructose). Process control focuses on substrate concentration, water activity, residence time, and enzyme selection, which jointly define yield and the DP profile (the distribution of GF2, GF3, GF4, and higher oligomers). Industrial configurations range from batch reactors to continuous stirred systems, packed beds with immobilized enzymes, and membrane-assisted reactors designed to manage product inhibition and steer chain-length distribution by selectively removing low-molecular-weight sugars. Alternative routes include fermentation-based in situ conversion where microorganisms expressing the relevant enzymes transform sucrose directly; however, even in such systems the chemistry remains an enzyme-catalyzed transfructosylation, and downstream purification requirements are similar.
The crude reaction mixture is a multi-sugar matrix: target FOS oligomers plus residual sucrose and byproduct monosaccharides (glucose and fructose), along with salts, color bodies, and trace proteins depending on enzyme preparation and processing aids. Recovery begins with clarification to remove suspended solids and, where relevant, biomass or enzyme carrier fines, typically using filtration and/or centrifugation. Decolorization and removal of hydrophobic impurities are commonly achieved with activated carbon or equivalent adsorption steps. Demineralization and removal of ionic contaminants are performed via ion-exchange resins, which also improve color stability and taste neutrality in finished food-grade ingredients.
Purification strategy depends on the required specification. For FOS syrups positioned as functional sweeteners or fiber ingredients, manufacturers often accept an “FOS-enriched” composition and focus on controlling residual mono- and disaccharides to meet sweetness and labeling targets. For high-purity FOS powders, separation becomes the central unit operation: chromatographic fractionation (including continuous approaches such as simulated moving bed chromatography) is widely used to separate FOS from glucose, fructose, and residual sucrose based on subtle differences in molecular size and interaction profiles. Membrane processes (ultrafiltration for macromolecule removal, nanofiltration for partial sugar fractionation) can be used as upstream concentration and cleanup tools, but they generally do not replace chromatography when very high FOS purity or tight DP control is required. Final concentration is achieved by vacuum evaporation to manage thermal load, followed by drying—often spray drying—to produce a free-flowing powder, with attention to glass transition behavior, hygroscopicity, and caking control through solids content, inlet/outlet temperatures, and optional carrier selection.
FOS’ functional properties in formulations derive from both its oligomeric nature and its residual sugar composition. FOS provides mild sweetness (lower than sucrose) with a clean taste profile, high water solubility, and generally low viscosity at typical use levels, enabling sugar reduction without the mouthfeel penalties associated with some higher-molecular-weight fibers. It acts as a humectant and can reduce water activity, supporting texture retention in baked goods, bars, and confections. Thermal stability is generally adequate for many food processes, but stability decreases under strong acid and high-temperature conditions where glycosidic bonds can hydrolyze; therefore, low pH hot-fill or extended high-heat treatment can shift the profile toward shorter sugars, increasing sweetness and fermentability while reducing labeled fiber contribution. Residual reducing sugars (glucose/fructose) can participate in Maillard reactions, which may be beneficial (browning) or detrimental (color drift, off-flavors) depending on the application; this is one reason high-purity grades are preferred for clear beverages, delicately flavored products, or systems requiring tight color control.
From a production and quality standpoint, specification control centers on FOS content, DP distribution, residual mono- and disaccharides, moisture, ash, color, and microbiological limits. Analytical control typically relies on chromatographic methods capable of resolving GF2–GF4 and quantifying residual sucrose and monosaccharides, because these parameters determine both physiological positioning (fiber and prebiotic function) and formulation performance (sweetness, water activity, browning tendency). In well-controlled manufacturing, the process is essentially a conversion-and-separation platform: enzyme specificity and reaction engineering set the oligomer map, while downstream fractionation and polishing steps define the commercial grade—syrup versus powder, fiber-focused versus sweetness-focused, and broad-mixture versus high-purity FOS.
The global Fructooligosaccharide (FOS) market was valued at US$ million in 2026 and is projected to reach US$ million by 2032, implying a CAGR of xx% over 2026-2032.
The North America market for Fructooligosaccharide (FOS) is projected to increase from US$ million in 2026 to US$ million by 2032, corresponding to a CAGR of % over 2026-2032.
The Europe market for Fructooligosaccharide (FOS) is projected to increase from US$ million in 2026 to US$ million by 2032, registering a CAGR of % over 2026-2032.
The Asia Pacific market for Fructooligosaccharide (FOS) is projected to increase from US$ million in 2026 to US$ million by 2032, at a CAGR of % over 2026-2032.
Leading global manufacturers of Fructooligosaccharide (FOS) include Meiji Food Materia, Beneo-Orafti, Sensus, QHT (Quantum Hi-Tech), Cosucra, Baolingbao Biology, Bailong Chuangyuan, Ingredion and Tate & Lyle, among others. In 2025, the top three vendors together accounted for approximately % of global revenue.
Report Scope
This report provides a structured, data-driven view of the global Fructooligosaccharide (FOS) market, combining harmonized quantitative metrics with targeted qualitative insight to support business and growth strategy, market positioning, and capital allocation.
The Fructooligosaccharide (FOS) market size, estimates, and forecasts are presented in terms of sales volume (t) and revenue (US$ million), with 2025 as the base year and historical and forecast data for 2021-2032. The report segments the global Fructooligosaccharide (FOS) market by Type, Application, region/country, and company, provides regional market sizes at the segment level, profiles the competitive landscape and key players and their market ranks, and reviews technology trends and new product developments relevant to Fructooligosaccharide (FOS).
Key Companies & Market Share Insights
This section analyzes the strategies and performance of leading manufacturers in the global Fructooligosaccharide (FOS) market, including portfolio focus, innovation and product development, mergers and acquisitions, collaborations, and geographic expansion used to sustain or enhance competitive positions. It also summarizes recent corporate developments and key financial indicators and provides global revenue, price, and sales volume data by manufacturer for 2020-2025, enabling benchmarking of scale, pricing, and market share and supporting assessment of market concentration through indicators such as CR5 and CR10.
Fructooligosaccharide (FOS) Market by Company
Meiji Food Materia
Beneo-Orafti
Sensus
QHT (Quantum Hi-Tech)
Cosucra
Baolingbao Biology
Bailong Chuangyuan
Ingredion
Tate & Lyle
Shandong Starlight
Galam
Tatanq
Tereos
Samyang Corp
Fructooligosaccharide (FOS) Segment by Type
Liquid FOS
Solid FOS
Fructooligosaccharide (FOS) Segment by Application
Food Industry
Baby Nutrition Products
Health Products
Others
Fructooligosaccharide (FOS) Segment by Region
North America
United States
Canada
Mexico
Europe
Germany
France
U.K.
Italy
Russia
Spain
Netherlands
Switzerland
Sweden
Poland
Asia-Pacific
China
Japan
South Korea
India
Australia
Taiwan
Southeast Asia
South America
Brazil
Argentina
Chile
Colombia
Middle East & Africa
Egypt
South Africa
Israel
Türkiye
GCC Countries
Key Drivers & Barriers
High-impact rendering factors and drivers have been studied in this report to aid the readers to understand the general development. Moreover, the report includes restraints and challenges that may act as stumbling blocks on the way of the players. This will assist the users to be attentive and make informed decisions related to business. Specialists have also laid their focus on the upcoming business prospects.
Reasons to Buy This Report
1. This report will help the readers to understand the competition within the industries and strategies for the competitive environment to enhance the potential profit. The report also focuses on the competitive landscape of the global Fructooligosaccharide (FOS) market, and introduces in detail the market share, industry ranking, competitor ecosystem, market performance, new product development, operation situation, expansion, and acquisition. etc. of the main players, which helps the readers to identify the main competitors and deeply understand the competition pattern of the market.
2. This report will help stakeholders to understand the global industry status and trends of Fructooligosaccharide (FOS) and provides them with information on key market drivers, restraints, challenges, and opportunities.
3. This report will help stakeholders to understand competitors better and gain more insights to strengthen their position in their businesses. The competitive landscape section includes the market share and rank (in volume and value), competitor ecosystem, new product development, expansion, and acquisition.
4. This report stays updated with novel technology integration, features, and the latest developments in the market.
5. This report helps stakeholders to gain insights into which regions to target globally.
6. This report helps stakeholders to gain insights into the end-user perception concerning the adoption of Fructooligosaccharide (FOS).
7. This report helps stakeholders to identify some of the key players in the market and understand their valuable contribution.
Chapter Outline
Chapter 1: Introduces the study scope of this report, executive summary of market segments by type, market size segments for North America, Europe, Asia Pacific, South America, Middle East & Africa.
Chapter 2: Introduces the market dynamics, latest developments of the market, the driving factors and restrictive factors of the market, the challenges and risks faced by manufacturers in the industry, and the analysis of relevant policies in the industry.
Chapter 3: Detailed analysis of Fructooligosaccharide (FOS) manufacturers competitive landscape, price, sales, revenue, market share and ranking, latest development plan, merger, and acquisition information, etc.
Chapter 4: Sales, revenue of Fructooligosaccharide (FOS) in regional level. It provides a quantitative analysis of the market size and development potential of each region and introduces the future development prospects, and market space in the world.
Chapter 5: Introduces market segments by application, market size segment for North America, Europe, Asia Pacific, South America, Middle East & Africa.
Chapter 6: Provides profiles of key players, introducing the basic situation of the main companies in the market in detail, including product sales, revenue, price, gross margin, product introduction, recent development, etc.
Chapter 7, 8, 9, 10 and 11: North America, Europe, Asia Pacific, South America, Middle East & Africa, sales and revenue by country.
Chapter 12: Analysis of industrial chain, key raw materials, manufacturing cost, and market dynamics.
Chapter 13: Concluding Insights of the report.
More report detail
Tables and figures
Scope & coverage.
Types
- Liquid FOS
- Solid FOS
Applications
- Food Industry
- Baby Nutrition Products
- Health Products
- Others
Companies covered
- Meiji Food Materia
- Beneo-Orafti
- Sensus
- QHT (Quantum Hi-Tech)
- Cosucra
- Baolingbao Biology
- Bailong Chuangyuan
- Ingredion
- Tate & Lyle
- Shandong Starlight
- Galam
- Tatanq
- Tereos
- Samyang Corp
Inside the report.
1 Market Overview
- 1.1 Product Definition
- 1.2 Global Market Growth Prospects
- 1.2.1 Global Fructooligosaccharide (FOS) Market Size Estimates and Forecasts (2021-2032)
- 1.2.2 Global Fructooligosaccharide (FOS) Sales Estimates and Forecasts (2021-2032)
- 1.3 Fructooligosaccharide (FOS) Market by Type
- 1.3.1 Liquid FOS
- 1.3.2 Solid FOS
- 1.4 Global Fructooligosaccharide (FOS) Market Size by Type
- 1.4.1 Global Fructooligosaccharide (FOS) Market Size Overview by Type (2021-2032)
- 1.4.2 Global Fructooligosaccharide (FOS) Historic Market Size Review by Type (2021-2026)
- 1.4.3 Global Fructooligosaccharide (FOS) Forecasted Market Size by Type (2027-2032)
- 1.5 Key Regions Market Size by Type
- 1.5.1 North America Fructooligosaccharide (FOS) Sales Breakdown by Type (2021-2026)
- 1.5.2 Europe Fructooligosaccharide (FOS) Sales Breakdown by Type (2021-2026)
- 1.5.3 Asia-Pacific Fructooligosaccharide (FOS) Sales Breakdown by Type (2021-2026)
- 1.5.4 South America Fructooligosaccharide (FOS) Sales Breakdown by Type (2021-2026)
- 1.5.5 Middle East and Africa Fructooligosaccharide (FOS) Sales Breakdown by Type (2021-2026)
2 Global Market Dynamics
- 2.1 Fructooligosaccharide (FOS) Industry Trends
- 2.2 Fructooligosaccharide (FOS) Industry Drivers
- 2.3 Fructooligosaccharide (FOS) Industry Opportunities and Challenges
- 2.4 Fructooligosaccharide (FOS) Industry Restraints
3 Market Competitive Landscape by Company
- 3.1 Global Top Players by Fructooligosaccharide (FOS) Revenue (2021-2026)
- 3.2 Global Top Players by Fructooligosaccharide (FOS) Sales (2021-2026)
- 3.3 Global Top Players by Fructooligosaccharide (FOS) Price (2021-2026)
- 3.4 Global Fructooligosaccharide (FOS) Industry Company Ranking, 2024 VS 2025 VS 2026
- 3.5 Global Fructooligosaccharide (FOS) Major Company Production Sites & Headquarters
- 3.6 Global Fructooligosaccharide (FOS) Company, Product Type & Application
- 3.7 Global Fructooligosaccharide (FOS) Company Establishment Date
- 3.8 Market Competitive Analysis
- 3.8.1 Global Fructooligosaccharide (FOS) Market CR5 and HHI
- 3.8.2 Global Top 5 and 10 Fructooligosaccharide (FOS) Players Market Share by Revenue in 2025
- 3.8.3 2025 Fructooligosaccharide (FOS) Tier 1, Tier 2, and Tier 3
4 Fructooligosaccharide (FOS) Regional Status and Outlook
- 4.1 Global Fructooligosaccharide (FOS) Market Size and CAGR by Region: 2021 VS 2025 VS 2032
- 4.2 Global Fructooligosaccharide (FOS) Historic Market Size by Region
- 4.2.1 Global Fructooligosaccharide (FOS) Sales in Volume by Region (2021-2026)
- 4.2.2 Global Fructooligosaccharide (FOS) Sales in Value by Region (2021-2026)
- 4.2.3 Global Fructooligosaccharide (FOS) Sales (Volume & Value), Price and Gross Margin (2021-2026)
- 4.3 Global Fructooligosaccharide (FOS) Forecasted Market Size by Region
- 4.3.1 Global Fructooligosaccharide (FOS) Sales in Volume by Region (2027-2032)
- 4.3.2 Global Fructooligosaccharide (FOS) Sales in Value by Region (2027-2032)
- 4.3.3 Global Fructooligosaccharide (FOS) Sales (Volume & Value), Price and Gross Margin (2027-2032)
5 Fructooligosaccharide (FOS) by Application
- 5.1 Fructooligosaccharide (FOS) Market by Application
- 5.1.1 Food Industry
- 5.1.2 Baby Nutrition Products
- 5.1.3 Health Products
- 5.1.4 Others
- 5.2 Global Fructooligosaccharide (FOS) Market Size by Application
- 5.2.1 Global Fructooligosaccharide (FOS) Market Size Overview by Application (2021-2032)
- 5.2.2 Global Fructooligosaccharide (FOS) Historic Market Size Review by Application (2021-2026)
- 5.2.3 Global Fructooligosaccharide (FOS) Forecasted Market Size by Application (2027-2032)
- 5.3 Key Regions Market Size by Application
- 5.3.1 North America Fructooligosaccharide (FOS) Sales Breakdown by Application (2021-2026)
- 5.3.2 Europe Fructooligosaccharide (FOS) Sales Breakdown by Application (2021-2026)
- 5.3.3 Asia-Pacific Fructooligosaccharide (FOS) Sales Breakdown by Application (2021-2026)
- 5.3.4 South America Fructooligosaccharide (FOS) Sales Breakdown by Application (2021-2026)
- 5.3.5 Middle East and Africa Fructooligosaccharide (FOS) Sales Breakdown by Application (2021-2026)
6 Company Profiles
- 6.1 Meiji Food Materia
- 6.1.1 Meiji Food Materia Company Information
- 6.1.2 Meiji Food Materia Business Overview
- 6.1.3 Meiji Food Materia Fructooligosaccharide (FOS) Sales, Revenue and Gross Margin (2021-2026)
- 6.1.4 Meiji Food Materia Fructooligosaccharide (FOS) Product Portfolio
- 6.1.5 Meiji Food Materia Recent Developments
- 6.2 Beneo-Orafti
- 6.2.1 Beneo-Orafti Company Information
- 6.2.2 Beneo-Orafti Business Overview
- 6.2.3 Beneo-Orafti Fructooligosaccharide (FOS) Sales, Revenue and Gross Margin (2021-2026)
- 6.2.4 Beneo-Orafti Fructooligosaccharide (FOS) Product Portfolio
- 6.2.5 Beneo-Orafti Recent Developments
- 6.3 Sensus
- 6.3.1 Sensus Company Information
- 6.3.2 Sensus Business Overview
- 6.3.3 Sensus Fructooligosaccharide (FOS) Sales, Revenue and Gross Margin (2021-2026)
- 6.3.4 Sensus Fructooligosaccharide (FOS) Product Portfolio
- 6.3.5 Sensus Recent Developments
- 6.4 QHT (Quantum Hi-Tech)
- 6.4.1 QHT (Quantum Hi-Tech) Company Information
- 6.4.2 QHT (Quantum Hi-Tech) Business Overview
- 6.4.3 QHT (Quantum Hi-Tech) Fructooligosaccharide (FOS) Sales, Revenue and Gross Margin (2021-2026)
- 6.4.4 QHT (Quantum Hi-Tech) Fructooligosaccharide (FOS) Product Portfolio
- 6.4.5 QHT (Quantum Hi-Tech) Recent Developments
- 6.5 Cosucra
- 6.5.1 Cosucra Company Information
- 6.5.2 Cosucra Business Overview
- 6.5.3 Cosucra Fructooligosaccharide (FOS) Sales, Revenue and Gross Margin (2021-2026)
- 6.5.4 Cosucra Fructooligosaccharide (FOS) Product Portfolio
- 6.5.5 Cosucra Recent Developments
- 6.6 Baolingbao Biology
- 6.6.1 Baolingbao Biology Company Information
- 6.6.2 Baolingbao Biology Business Overview
- 6.6.3 Baolingbao Biology Fructooligosaccharide (FOS) Sales, Revenue and Gross Margin (2021-2026)
- 6.6.4 Baolingbao Biology Fructooligosaccharide (FOS) Product Portfolio
- 6.6.5 Baolingbao Biology Recent Developments
- 6.7 Bailong Chuangyuan
- 6.7.1 Bailong Chuangyuan Company Information
- 6.7.2 Bailong Chuangyuan Business Overview
- 6.7.3 Bailong Chuangyuan Fructooligosaccharide (FOS) Sales, Revenue and Gross Margin (2021-2026)
- 6.7.4 Bailong Chuangyuan Fructooligosaccharide (FOS) Product Portfolio
- 6.7.5 Bailong Chuangyuan Recent Developments
- 6.8 Ingredion
- 6.8.1 Ingredion Company Information
- 6.8.2 Ingredion Business Overview
- 6.8.3 Ingredion Fructooligosaccharide (FOS) Sales, Revenue and Gross Margin (2021-2026)
- 6.8.4 Ingredion Fructooligosaccharide (FOS) Product Portfolio
- 6.8.5 Ingredion Recent Developments
- 6.9 Tate & Lyle
- 6.9.1 Tate & Lyle Company Information
- 6.9.2 Tate & Lyle Business Overview
- 6.9.3 Tate & Lyle Fructooligosaccharide (FOS) Sales, Revenue and Gross Margin (2021-2026)
- 6.9.4 Tate & Lyle Fructooligosaccharide (FOS) Product Portfolio
- 6.9.5 Tate & Lyle Recent Developments
- 6.10 Shandong Starlight
- 6.10.1 Shandong Starlight Company Information
- 6.10.2 Shandong Starlight Business Overview
- 6.10.3 Shandong Starlight Fructooligosaccharide (FOS) Sales, Revenue and Gross Margin (2021-2026)
- 6.10.4 Shandong Starlight Fructooligosaccharide (FOS) Product Portfolio
- 6.10.5 Shandong Starlight Recent Developments
- 6.11 Galam
- 6.11.1 Galam Company Information
- 6.11.2 Galam Business Overview
- 6.11.3 Galam Fructooligosaccharide (FOS) Sales, Revenue and Gross Margin (2021-2026)
- 6.11.4 Galam Fructooligosaccharide (FOS) Product Portfolio
- 6.11.5 Galam Recent Developments
- 6.12 Tatanq
- 6.12.1 Tatanq Company Information
- 6.12.2 Tatanq Business Overview
- 6.12.3 Tatanq Fructooligosaccharide (FOS) Sales, Revenue and Gross Margin (2021-2026)
- 6.12.4 Tatanq Fructooligosaccharide (FOS) Product Portfolio
- 6.12.5 Tatanq Recent Developments
- 6.13 Tereos
- 6.13.1 Tereos Company Information
- 6.13.2 Tereos Business Overview
- 6.13.3 Tereos Fructooligosaccharide (FOS) Sales, Revenue and Gross Margin (2021-2026)
- 6.13.4 Tereos Fructooligosaccharide (FOS) Product Portfolio
- 6.13.5 Tereos Recent Developments
- 6.14 Samyang Corp
- 6.14.1 Samyang Corp Company Information
- 6.14.2 Samyang Corp Business Overview
- 6.14.3 Samyang Corp Fructooligosaccharide (FOS) Sales, Revenue and Gross Margin (2021-2026)
- 6.14.4 Samyang Corp Fructooligosaccharide (FOS) Product Portfolio
- 6.14.5 Samyang Corp Recent Developments
7 North America by Country
- 7.1 North America Fructooligosaccharide (FOS) Sales by Country
- 7.1.1 North America Fructooligosaccharide (FOS) Sales Growth Rate (CAGR) by Country: 2021 VS 2025 VS 2032
- 7.1.2 North America Fructooligosaccharide (FOS) Sales by Country (2021-2026)
- 7.1.3 North America Fructooligosaccharide (FOS) Sales Forecast by Country (2027-2032)
- 7.2 North America Fructooligosaccharide (FOS) Market Size by Country
- 7.2.1 North America Fructooligosaccharide (FOS) Market Size Growth Rate (CAGR) by Country: 2021 VS 2025 VS 2032
- 7.2.2 North America Fructooligosaccharide (FOS) Market Size by Country (2021-2026)
- 7.2.3 North America Fructooligosaccharide (FOS) Market Size Forecast by Country (2027-2032)
8 Europe by Country
- 8.1 Europe Fructooligosaccharide (FOS) Sales by Country
- 8.1.1 Europe Fructooligosaccharide (FOS) Sales Growth Rate (CAGR) by Country: 2021 VS 2025 VS 2032
- 8.1.2 Europe Fructooligosaccharide (FOS) Sales by Country (2021-2026)
- 8.1.3 Europe Fructooligosaccharide (FOS) Sales Forecast by Country (2027-2032)
- 8.2 Europe Fructooligosaccharide (FOS) Market Size by Country
- 8.2.1 Europe Fructooligosaccharide (FOS) Market Size Growth Rate (CAGR) by Country: 2021 VS 2025 VS 2032
- 8.2.2 Europe Fructooligosaccharide (FOS) Market Size by Country (2021-2026)
- 8.2.3 Europe Fructooligosaccharide (FOS) Market Size Forecast by Country (2027-2032)
9 Asia-Pacific by Country
- 9.1 Asia-Pacific Fructooligosaccharide (FOS) Sales by Country
- 9.1.1 Asia-Pacific Fructooligosaccharide (FOS) Sales Growth Rate (CAGR) by Country: 2021 VS 2025 VS 2032
- 9.1.2 Asia-Pacific Fructooligosaccharide (FOS) Sales by Country (2021-2026)
- 9.1.3 Asia-Pacific Fructooligosaccharide (FOS) Sales Forecast by Country (2027-2032)
- 9.2 Asia-Pacific Fructooligosaccharide (FOS) Market Size by Country
- 9.2.1 Asia-Pacific Fructooligosaccharide (FOS) Market Size Growth Rate (CAGR) by Country: 2021 VS 2025 VS 2032
- 9.2.2 Asia-Pacific Fructooligosaccharide (FOS) Market Size by Country (2021-2026)
- 9.2.3 Asia-Pacific Fructooligosaccharide (FOS) Market Size Forecast by Country (2027-2032)
10 South America by Country
- 10.1 South America Fructooligosaccharide (FOS) Sales by Country
- 10.1.1 South America Fructooligosaccharide (FOS) Sales Growth Rate (CAGR) by Country: 2021 VS 2025 VS 2032
- 10.1.2 South America Fructooligosaccharide (FOS) Sales by Country (2021-2026)
- 10.1.3 South America Fructooligosaccharide (FOS) Sales Forecast by Country (2027-2032)
- 10.2 South America Fructooligosaccharide (FOS) Market Size by Country
- 10.2.1 South America Fructooligosaccharide (FOS) Market Size Growth Rate (CAGR) by Country: 2021 VS 2025 VS 2032
- 10.2.2 South America Fructooligosaccharide (FOS) Market Size by Country (2021-2026)
- 10.2.3 South America Fructooligosaccharide (FOS) Market Size Forecast by Country (2027-2032)
11 Middle East and Africa by Country
- 11.1 Middle East and Africa Fructooligosaccharide (FOS) Sales by Country
- 11.1.1 Middle East and Africa Fructooligosaccharide (FOS) Sales Growth Rate (CAGR) by Country: 2021 VS 2025 VS 2032
- 11.1.2 Middle East and Africa Fructooligosaccharide (FOS) Sales by Country (2021-2026)
- 11.1.3 Middle East and Africa Fructooligosaccharide (FOS) Sales Forecast by Country (2027-2032)
- 11.2 Middle East and Africa Fructooligosaccharide (FOS) Market Size by Country
- 11.2.1 Middle East and Africa Fructooligosaccharide (FOS) Market Size Growth Rate (CAGR) by Country: 2021 VS 2025 VS 2032
- 11.2.2 Middle East and Africa Fructooligosaccharide (FOS) Market Size by Country (2021-2026)
- 11.2.3 Middle East and Africa Fructooligosaccharide (FOS) Market Size Forecast by Country (2027-2032)
12 Value Chain and Sales Channels Analysis
- 12.1 Fructooligosaccharide (FOS) Value Chain Analysis
- 12.1.1 Fructooligosaccharide (FOS) Key Raw Materials
- 12.1.2 Key Raw Materials Price
- 12.1.3 Raw Materials Key Suppliers
- 12.1.4 Manufacturing Cost Structure
- 12.1.5 Fructooligosaccharide (FOS) Production Mode & Process
- 12.2 Fructooligosaccharide (FOS) Sales Channels Analysis
- 12.2.1 Direct Comparison with Distribution Share
- 12.2.2 Fructooligosaccharide (FOS) Distributors
- 12.2.3 Fructooligosaccharide (FOS) Customers
13 Concluding Insights
14 Appendix
- 14.1 Reasons for Doing This Study
- 14.2 Research Methodology
- 14.3 Research Process
- 14.4 Authors List of This Report
- 14.5 Data Source
- 14.5.1 Secondary Sources
- 14.5.2 Primary Sources
- 14.6 Disclaimer
GET THE RESEARCH
Choose your license.
Choose who needs access.
All options are for this report and research series.
PDF by email within 3–5 working days after payment confirmation.
Talk to an analyst