
APO RESEARCH · REPORT
Patient Monitor
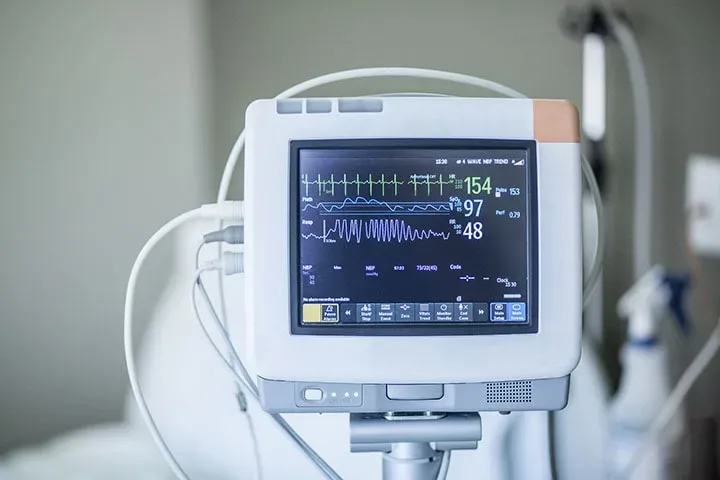
Patient Monitor refers to a medical electronic device or integrated monitoring system used to measure, display, record, and evaluate physiological parameters associated with a patient's cardiovascular, respiratory, neurological, circulatory, and other vital functions. Patient monitors provide continuous, intermittent, or event triggered physiological measurements to support clinical observation, assessment of changes in patient condition, evaluation of therapeutic interventions, and identification of potentially significant physiological abnormalities. Depending on their intended use and measurement configuration, these devices monitor electrocardiogram (ECG), heart rate (HR), peripheral oxygen saturation (SpO₂), noninvasive blood pressure (NIBP), invasive blood pressure (IBP), respiratory rate (RR), body temperature, end tidal carbon dioxide (EtCO₂), cardiac output, and other physiological parameters. Specialized monitoring systems may additionally incorporate electroencephalography (EEG), anesthetic gas concentrations, cerebral oxygenation, neuromuscular transmission, hemodynamic indices, and advanced cardiac rhythm analysis.
Product & engineering
Understand the product.
Patient Monitor refers to a medical electronic device or integrated monitoring system used to measure, display, record, and evaluate physiological parameters associated with a patient's cardiovascular, respiratory, neurological, circulatory, and other vital functions. Patient monitors provide continuous, intermittent, or event triggered physiological measurements to support clinical observation, assessment of changes in patient condition, evaluation of therapeutic interventions, and identification of potentially significant physiological abnormalities. Depending on their intended use and measurement configuration, these devices monitor electrocardiogram (ECG), heart rate (HR), peripheral oxygen saturation (SpO₂), noninvasive blood pressure (NIBP), invasive blood pressure (IBP), respiratory rate (RR), body temperature, end tidal carbon dioxide (EtCO₂), cardiac output, and other physiological parameters. Specialized monitoring systems may additionally incorporate electroencephalography (EEG), anesthetic gas concentrations, cerebral oxygenation, neuromuscular transmission, hemodynamic indices, and advanced cardiac rhythm analysis.
Patient monitoring equipment encompasses multiparameter bedside monitors, modular patient monitoring systems, vital signs monitors, portable and transport monitors, dedicated physiological monitors, and certain medical grade wearable or ambulatory monitoring devices. Multiparameter monitors simultaneously acquire and display several physiological measurements within a common monitoring system and are widely used in intensive care units, operating rooms, emergency departments, recovery units, and general hospital wards. Modular systems accommodate interchangeable measurement modules and specialized parameter extensions according to clinical requirements. Vital signs monitors provide periodic or continuous measurement of selected physiological parameters, particularly blood pressure, pulse rate, oxygen saturation, and temperature. Portable and transport monitors incorporate compact electronic architectures, battery operation, and compatible mounting arrangements to maintain physiological surveillance during patient movement. Dedicated monitoring equipment includes cardiac rhythm monitors, pulse oximetry monitors, respiratory monitoring systems, hemodynamic monitors, and neurological monitoring devices. Medical wearable monitoring systems may provide continuous physiological data acquisition during patient mobility, ambulatory care, or authorized remote monitoring applications.
A patient monitor typically incorporates physiological signal acquisition circuitry, sensor interfaces, analog and digital signal processing components, embedded computing hardware, measurement algorithms, display or communication functions, data storage, and alarm management capabilities. Depending on the measurement technology, patient connections include ECG electrodes, optical oxygen saturation sensors, blood pressure cuffs, invasive pressure transducers, temperature probes, respiratory gas sampling accessories, and other physiological sensing components. Acquired signals are processed to calculate physiological measurements and identify relevant events, with results presented as numerical readings, waveforms, physiological trends, and event records. Continuous monitoring systems commonly provide configurable measurement intervals, alarm thresholds, signal quality indicators, physiological and technical alarms, trend storage, and event review functions. Some devices incorporate arrhythmia detection, ST segment analysis, respiratory event identification, cardiac output calculation, or other parameter specific analytical functions. Measurement accuracy and clinical interpretation depend on sensor characteristics, acquisition methods, signal processing algorithms, physiological conditions, and the manufacturer's validated operating specifications.
Patient monitoring systems employ different measurement technologies according to the physiological variables being assessed. Electrocardiographic monitoring measures cardiac electrical activity through surface electrodes and compatible acquisition channels. Pulse oximetry uses optical absorption characteristics to estimate functional arterial oxygen saturation and derive pulse rate. Automated noninvasive blood pressure monitors commonly employ oscillometric measurement, while invasive pressure monitoring systems acquire pressure waveforms through catheter connected transducers. Respiratory monitoring may use thoracic impedance, capnography, respiratory flow measurements, or other validated sensing methods. Temperature monitoring employs compatible contact or other clinically validated temperature sensors. Advanced hemodynamic monitoring systems may calculate cardiac output, stroke volume, and related circulatory parameters using invasive or minimally invasive measurement methods. Neurological monitoring equipment may acquire cerebral electrical activity or other neurological indicators for use in anesthesia, intensive care, and specialized clinical procedures. The selection and combination of these technologies determine the monitoring capabilities and intended clinical applications of individual devices.
Patient monitors are deployed across healthcare environments with different requirements for physiological surveillance, monitoring intensity, patient mobility, and clinical intervention. Critical care and perioperative environments typically require continuous waveform acquisition, advanced hemodynamic measurements, comprehensive alarm functions, and integration with other medical equipment. Emergency departments and patient transport environments require rapid parameter acquisition, portable operation, and reliable monitoring during movement or changes in care location. General hospital wards and intermediate care units use continuous or intermittent monitoring according to patient condition and clinical protocols. Outpatient facilities, ambulatory treatment centers, and specialized diagnostic environments employ selected physiological monitoring technologies appropriate to their clinical procedures. Home and remote monitoring applications use equipment specifically indicated for those environments, including compatible wearable sensors, portable measurement units, and remote data transmission systems. Monitoring equipment may be configured for adult, pediatric, and neonatal patients according to the intended patient population, sensor specifications, measurement validation, and applicable regulatory authorization.
Modern patient monitoring systems increasingly incorporate network connectivity, centralized monitoring functions, and digital clinical information exchange. Compatible monitoring devices can transmit physiological measurements, waveforms, alarm information, and historical trends to central monitoring stations, clinical information systems, and electronic medical records. Wired and wireless communication capabilities permit selected monitoring systems to maintain data exchange across bedside, transport, and remote monitoring environments. Certain devices support continuous data collection during patient transfers, while compatible software applications enable retrospective trend review, event analysis, and physiological data visualization. Remote monitoring configurations may combine wearable sensors, mobile communication devices, and clinical monitoring software to provide authorized healthcare personnel with access to patient measurements outside conventional bedside environments. Communication functionality, alarm distribution, data retention, and interoperability depend on the specific equipment architecture, supported protocols, and approved clinical configuration.
Patient monitors are regulated medical devices subject to applicable requirements for electrical safety, electromagnetic compatibility, measurement accuracy, alarm performance, software reliability, and essential clinical performance. Relevant technical frameworks include the IEC 60601 series for medical electrical equipment, IEC 60601 2 49 for multifunction patient monitoring equipment, and applicable particular standards governing electrocardiographic monitoring, pulse oximetry, automated blood pressure measurement, invasive blood pressure monitoring, and respiratory gas monitoring. Product requirements vary with the measurement technologies, intended clinical environment, patient population, and applicable national regulatory framework. Device specifications typically address physiological measurement ranges, measurement accuracy, waveform characteristics, alarm behavior, electrical isolation, power supply, battery operation, environmental operating conditions, and compatibility with approved sensors and accessories. Appropriate sensor placement, signal quality assessment, alarm configuration, and clinical interpretation remain essential to the effective use of patient monitoring information. Continuous and intermittent physiological measurements provide a documented basis for assessing patient condition and identifying changes that may require clinical attention, with diagnostic conclusions and therapeutic decisions determined through professional medical evaluation.
Selected research
Market Outlook & Growth Opportunities
Global Patient Monitor Market Outlook and Growth Opportunities 2026
MARKET AT A GLANCE
Scale & outlook
- 2025
- 5,841.32USD million
- 2032
- 9,334.72USD million
Select a bar to inspect its value.
Source: APO Research, Inc.
Market perspective
According to APO Research, Inc, the global Patient Monitor market was valued at an estimated USD 5,841.32 million in 2025 and is projected to reach USD 6,251.60 million in 2026 and USD 9,334.72 million by 2032, representing a compound annual growth rate (CAGR) of 6.91% from 2026 to 2032. The projected revenue increase of USD 3,083.12 million reflects additional equipment installations, replacement of existing clinical monitoring systems, and increased deployment of specialized and wearable physiological monitoring devices. Global sales are estimated at 6,776,000 units in 2025, rising to 7,298,000 units in 2026 and 10,861,000 units by 2032, equivalent to a volume CAGR of 6.85% during the forecast period. The weighted ex factory net price is estimated at USD 862.06 per unit in 2025, USD 856.62 in 2026, and USD 859.47 in 2032. The relatively stable aggregate price reflects the growing contribution of lower priced vital signs and wearable monitors to total equipment shipments, alongside continued procurement of higher value multiparameter and specialty monitoring systems.
Multiparameter monitors remain the largest revenue category, with estimated market value increasing from USD 3,628.20 million in 2026 to USD 5,005.56 million in 2032, contributing approximately 44.67% of the total projected market revenue increase. Demand is associated with intensive care equipment replacement, expansion of intermediate care monitoring, and wider installation of continuous physiological surveillance in general hospital wards. High acuity monitoring systems incorporate invasive blood pressure measurement, capnography, advanced cardiac monitoring, hemodynamic assessment, and modular parameter expansion, resulting in substantially higher equipment values than standard ward monitors. Mid acuity and low acuity systems address postoperative recovery, emergency treatment, general inpatient monitoring, and routine clinical observation. Specialty monitors contribute additional revenue from dedicated cardiac, respiratory, neurological, and hemodynamic monitoring applications, where measurement technology, validated algorithms, and specialized sensors influence equipment configuration and pricing. Spot check vital signs monitors serve hospital wards, outpatient clinics, and ambulatory treatment facilities, with blood pressure, oxygen saturation, pulse rate, and temperature measurement forming the principal functions. Wearable monitors extend continuous physiological surveillance to ambulatory patients and authorized home monitoring environments, increasing equipment demand for compact ECG sensing, respiratory monitoring, wireless transmission, and battery operated data acquisition. Hardware revenue is accounted for separately from monitoring services, software subscriptions, disposable consumables, and maintenance contracts.
North America and Europe represent established equipment replacement markets, where hospital purchasing is influenced by the age of installed monitoring systems, intensive care modernization, clinical network interoperability, and compatibility with existing central monitoring infrastructure. In the United States, critical care, perioperative monitoring, cardiac care, and specialized hemodynamic monitoring sustain demand for higher specification systems, while outpatient facilities and decentralized clinical services purchase standardized vital signs equipment. European hospitals face similar replacement requirements, with procurement additionally shaped by medical device regulatory compliance, public healthcare capital expenditure, and equipment lifecycle management. China contributes demand from regional hospital equipment renewal, intensive care and intermediate care capacity development, and broader continuous monitoring coverage in inpatient departments. India and Southeast Asia provide additional unit growth through hospital equipment procurement, expansion of outpatient treatment capacity, and adoption of competitively priced conventional monitoring devices. Middle Eastern and Latin American markets generate demand associated with hospital infrastructure investment, emergency medical equipment procurement, and replacement of aging bedside systems. Hospitals remain the largest application segment by revenue, while clinics and ambulatory care, emergency medical services, and home healthcare contribute distinct equipment requirements and replacement patterns.
Full market overview
Patient monitor manufacturing incorporates physiological signal acquisition electronics, ECG analog front ends, optical oxygen saturation sensing components, noninvasive blood pressure assemblies, medical displays, embedded processors, power management systems, and specialized measurement modules. Product performance depends on measurement accuracy, signal processing algorithms, electrical isolation, alarm reliability, sensor compatibility, and integration with clinical information systems. Advanced multiparameter equipment requires additional physiological measurement interfaces, modular electronics, and extensive functional calibration, while conventional vital signs equipment uses comparatively standardized measurement architectures. Wearable systems place greater emphasis on sensor miniaturization, energy consumption, wireless communication stability, and physiological signal quality during patient movement. Global production is estimated at 6,820,000 units in 2025, increasing to 7,348,000 units in 2026 and 10,938,000 units by 2032. Estimated effective manufacturing capacity increases from 12,800,000 units in 2025 to 13,600,000 units in 2026 and 18,700,000 units in 2032, corresponding to utilization rates of 53.28%, 54.03%, and 58.49%, respectively. Philips, GE HealthCare, Mindray, Nihon Kohden, Dräger, Masimo, and Spacelabs Healthcare maintain established positions in hospital monitoring, while BD, Medtronic, IRadimed, Nonin Medical, and other specialized manufacturers participate in distinct physiological monitoring categories. Chinese, Korean, Indian, and Brazilian manufacturers contribute additional production capacity and competition in conventional bedside and vital signs equipment. The projected market expansion reflects rising equipment volumes across clinical settings, increasing specialized monitoring requirements, and a product mix that keeps the aggregate average selling price relatively stable despite differences in individual device specifications.
This report provides an overview of the global Patient Monitor market in terms of sales, revenue, and price, analyzing global market trends using historical revenue and sales data for 2021-2025, estimates for 2026, and projected CAGRs through 2032.
The study covers key producers of Patient Monitor and sales in major regions and countries, assesses future market potential, and highlights priority regions and countries for segmenting the market into sub-sectors, with country-specific market value data for the U.S., Canada, Mexico, Brazil, China, Japan, South Korea, Southeast Asia, India, Germany, the U.K., Italy, the Middle East, Africa, and other countries.
The report also presents Patient Monitor sales, revenue, market share, and industry ranking for the main manufacturers for 2021-2026, identifies the major stakeholders in the global market, and analyzes their competitive landscape and market positioning based on recent developments and segmental revenues.
In addition, the report analyzes segment data by Type and Application—covering sales, revenue, and price—for 2021-2032, and evaluates and forecasts the Patient Monitor market size, projected growth trends, production technologies, key applications, and end-use industries.
Patient Monitor Segment by Company
- Philips
- GE HealthCare
- Mindray
- Nihon Kohden
- Dräger
- Masimo (Danaher)
- Spacelabs Healthcare (OSI Systems)
- Fukuda Denshi
- SCHILLER
- ZOLL Medical
- Baxter (Welch Allyn)
- Medtronic
- Stryker (Physio-Control)
- BD (Advanced Patient Monitoring)
- Getinge
- ICU Medical
- Radiometer (Danaher)
- Nonin Medical
- Sentec
- corpuls
- IRadimed
- MIPM
- Innomed Medical
- EMTEL
- Mennen Medical
- UTAS
- Infinium Medical
- Criticare Technologies
- Clarity Medical
- EDAN Instruments
- Shenzhen Comen Medical Instruments
- Guangdong Biolight Meditech
- Contec Medical Systems
- Shenzhen Biocare Bio-Medical Equipment
- Wuhan Zoncare Bio-medical Electronics
- Lepu Medical (Creative Industry, Viatom)
- Shenzhen Hexin Zondan Medical Equipment
- Heal Force
- Shenzhen Wisonic Medical Technology
- Jiangsu Konsung Bio-Medical Science and Technology
- Beijing M&B Electronic Instruments
- Beijing Choice Electronic Technology (ChoiceMMed)
- Bionet
- Mediana
- Bistos
- MEKICS
- Skanray Technologies
- BPL Medical Technologies
- Recorders & Medicare Systems
- Trivitron Healthcare
- Allengers Global Healthcare
- ProLife Equipamentos Médicos
- CMOS Drake
- Lifemed
- Alfa Med Sistemas Médicos
- Instramed
- Huntleigh Healthcare (Arjo)
- iRhythm (VitalConnect)
- BioIntelliSense
- Murata Manufacturing (Vios)
Patient Monitor Segment by Type
- Multi Parameter Monitors
- Spot Check Vital Signs Monitors
- Specialty Monitors
- Wearable Monitors
Patient Monitor Segment by Application
- Hospitals
- Clinics and Ambulatory Care
- Emergency Medical Services
- Home Healthcare
- Others
Patient Monitor Segment by Region
- North America
- United States
- Canada
- Mexico
- Europe
- Germany
- France
- U.K.
- Italy
- Russia
- Spain
- Netherlands
- Switzerland
- Sweden
- Poland
- Asia-Pacific
- China
- Japan
- South Korea
- India
- Australia
- Taiwan
- Southeast Asia
- South America
- Brazil
- Argentina
- Chile
- Colombia
- Middle East & Africa
- Egypt
- South Africa
- Israel
- Türkiye
- GCC Countries
Study Objectives
- To analyze and research the global Patient Monitor status and future forecast, involving, sales, revenue, growth rate (CAGR), market share, historical and forecast.
- To present the key manufacturers, sales, revenue, market share, and Recent Developments.
- To split the breakdown data by regions, type, manufacturers, and Application.
- To analyze the global and key regions Patient Monitor market potential and advantage, opportunity and challenge, restraints, and risks.
- To identify Patient Monitor significant trends, drivers, influence factors in global and regions.
- To analyze Patient Monitor competitive developments such as expansions, agreements, new product launches, and acquisitions in the market.
Reasons to Buy This Report
- This report will help the readers to understand the competition within the industries and strategies for the competitive environment to enhance the potential profit. The report also focuses on the competitive landscape of the global Patient Monitor market, and introduces in detail the market share, industry ranking, competitor ecosystem, market performance, new product development, operation situation, expansion, and acquisition. etc. of the main players, which helps the readers to identify the main competitors and deeply understand the competition pattern of the market.
- This report will help stakeholders to understand the global industry status and trends of Patient Monitor and provides them with information on key market drivers, restraints, challenges, and opportunities.
- This report will help stakeholders to understand competitors better and gain more insights to strengthen their position in their businesses. The competitive landscape section includes the market share and rank (in sales and value), competitor ecosystem, new product development, expansion, and acquisition.
- This report stays updated with novel technology integration, features, and the latest developments in the market.
- This report helps stakeholders to gain insights into which regions to target globally.
- This report helps stakeholders to gain insights into the end-user perception concerning the adoption of Patient Monitor.
- This report helps stakeholders to identify some of the key players in the market and understand their valuable contribution.
Chapter Outline
- Chapter 1: Provides an overview of the Patient Monitor market, including product definition, global market growth prospects, sales value, sales volume, and average price forecasts (2021-2032).
- Chapter 2: Analysis key trends, drivers, challenges, and opportunities within the global Patient Monitor industry.
- Chapter 3: Detailed analysis of Patient Monitor manufacturers competitive landscape, price, sales and revenue market share, latest development plan, merger, and acquisition information, etc.
- Chapter 4: Provides the analysis of various market segments by type, covering the market size and development potential of each market segment, to help readers find the blue ocean market in different market segments.
- Chapter 5: Provides the analysis of various market segments by application, covering the market size and development potential of each market segment, to help readers find the blue ocean market in different downstream markets.
- Chapter 6: Sales and value of Patient Monitor in regional level. It provides a quantitative analysis of the market size and development potential of each region and introduces the market development, future development prospects, market space, and market size of each country in the world.
- Chapter 7: Sales and value of Patient Monitor in country level. It provides sigmate data by type, and by application for each country/region.
- Chapter 8: Provides profiles of key players, introducing the basic situation of the main companies in the market in detail, including product sales, revenue, price, gross margin, product introduction, recent development, etc.
- Chapter 9: Analysis of industrial chain, including the upstream and downstream of the industry.
- Chapter 10: Concluding Insights.
More report detail
Tables and figures
List of Tables
- Table 1. Patient Monitor Industry Trends
- Table 2. Patient Monitor Industry Drivers
- Table 3. Patient Monitor Industry Opportunities and Challenges
- Table 4. Patient Monitor Industry Restraints
- Table 5. Global Patient Monitor Revenue by Company (US$ Million) & (2021-2026)
- Table 6. Global Patient Monitor Revenue Share by Company (2021-2026)
- Table 7. Global Patient Monitor Sales Volume by Company (units) & (2021-2026)
- Table 8. Global Patient Monitor Sales Volume Share by Company (2021-2026)
- Table 9. Global Patient Monitor Average Price (USD/unit) of Company (2021-2026)
- Table 10. Global Patient Monitor Company Ranking, (2024-2026) & (USD Million)
- Table 11. Global Patient Monitor Key Company Manufacturing Base & Headquarters
- Table 12. Global Patient Monitor Company, Product Type & Application
- Table 13. Global Patient Monitor Company Establishment Date
- Table 14. Global Company Market Concentration Ratio (CR5 and HHI)
- Table 15. Global Patient Monitor by Company Type (Tier 1, Tier 2, and Tier 3) & (Based on Revenue of 2025)
- Table 16. Mergers & Acquisitions, Expansion
- Table 17. Significant Companies of Multi Parameter Monitors
- Table 18. Significant Companies of Spot Check Vital Signs Monitors
- Table 19. Significant Companies of Specialty Monitors
- Table 20. Significant Companies of Wearable Monitors
- Table 21. Global Patient Monitor Sales Volume by Type 2021 VS 2025 VS 2032 (units)
- Table 22. Global Patient Monitor Sales Volume by Type (2021-2026) & (units)
- Table 23. Global Patient Monitor Sales Volume by Type (2027-2032) & (units)
- Table 24. Global Patient Monitor Sales Volume Share by Type (2021-2026)
- Table 25. Global Patient Monitor Sales Volume Share by Type (2027-2032)
- Table 26. Global Patient Monitor Sales Value by Type 2021 VS 2025 VS 2032 (US$ Million)
- Table 27. Global Patient Monitor Sales Value by Type (2021-2026) & (US$ Million)
- Table 28. Global Patient Monitor Sales Value by Type (2027-2032) & (US$ Million)
- Table 29. Global Patient Monitor Sales Value Share by Type (2021-2026)
- Table 30. Global Patient Monitor Sales Value Share by Type (2027-2032)
- Table 31. Significant Companies of Hospitals
- Table 32. Significant Companies of Clinics and Ambulatory Care
- Table 33. Significant Companies of Emergency Medical Services
- Table 34. Significant Companies of Home Healthcare
- Table 35. Significant Companies of Others
- Table 36. Global Patient Monitor Sales Volume by Application 2021 VS 2025 VS 2032 (units)
- Table 37. Global Patient Monitor Sales Volume by Application (2021-2026) & (units)
- Table 38. Global Patient Monitor Sales Volume by Application (2027-2032) & (units)
- Table 39. Global Patient Monitor Sales Volume Share by Application (2021-2026)
- Table 40. Global Patient Monitor Sales Volume Share by Application (2027-2032)
- Table 41. Global Patient Monitor Sales Value by Application 2021 VS 2025 VS 2032 (US$ Million)
- Table 42. Global Patient Monitor Sales Value by Application (2021-2026) & (US$ Million)
- Table 43. Global Patient Monitor Sales Value by Application (2027-2032) & (US$ Million)
- Table 44. Global Patient Monitor Sales Value Share by Application (2021-2026)
- Table 45. Global Patient Monitor Sales Value Share by Application (2027-2032)
- Table 46. Global Patient Monitor Sales by Region: 2021 VS 2025 VS 2032 (units)
- Table 47. Global Patient Monitor Sales by Region (2021-2026) & (units)
- Table 48. Global Patient Monitor Sales Market Share by Region (2021-2026)
- Table 49. Global Patient Monitor Sales by Region (2027-2032) & (units)
- Table 50. Global Patient Monitor Sales Market Share by Region (2027-2032)
- Table 51. Global Patient Monitor Sales Value Comparison by Region: 2021 VS 2025 VS 2032 (US$ Million)
- Table 52. Global Patient Monitor Sales Value by Region (2021-2026) & (US$ Million)
- Table 53. Global Patient Monitor Sales Value Share by Region (2021-2026)
- Table 54. Global Patient Monitor Sales Value by Region (2027-2032) & (US$ Million)
- Table 55. Global Patient Monitor Sales Value Share by Region (2027-2032)
- Table 56. Global Patient Monitor Market Average Price (USD/unit) by Region (2021-2026)
- Table 57. Global Patient Monitor Market Average Price (USD/unit) by Region (2027-2032)
- Table 58. Global Patient Monitor Sales by Country: 2021 VS 2025 VS 2032 (units)
- Table 59. Global Patient Monitor Sales Value by Country: 2021 VS 2025 VS 2032 (US$ Million)
- Table 60. Global Patient Monitor Sales by Country (2021-2026) & (units)
- Table 61. Global Patient Monitor Sales Market Share by Country (2021-2026)
- Table 62. Global Patient Monitor Sales by Country (2027-2032) & (units)
- Table 63. Global Patient Monitor Sales Market Share by Country (2027-2032)
- Table 64. Global Patient Monitor Sales Value by Country (2021-2026) & (US$ Million)
- Table 65. Global Patient Monitor Sales Value Market Share by Country (2021-2026)
- Table 66. Global Patient Monitor Sales Value by Country (2027-2032) & (US$ Million)
- Table 67. Global Patient Monitor Sales Value Market Share by Country (2027-2032)
- Table 68. Philips Company Information
- Table 69. Philips Business Overview
- Table 70. Philips Patient Monitor Sales (units), Value (US$ Million), Price (USD/unit) and Gross Margin (2021-2026)
- Table 71. Philips Patient Monitor Product Portfolio
- Table 72. Philips Recent Development
- Table 73. GE HealthCare Company Information
- Table 74. GE HealthCare Business Overview
- Table 75. GE HealthCare Patient Monitor Sales (units), Value (US$ Million), Price (USD/unit) and Gross Margin (2021-2026)
- Table 76. GE HealthCare Patient Monitor Product Portfolio
- Table 77. GE HealthCare Recent Development
- Table 78. Mindray Company Information
- Table 79. Mindray Business Overview
- Table 80. Mindray Patient Monitor Sales (units), Value (US$ Million), Price (USD/unit) and Gross Margin (2021-2026)
- Table 81. Mindray Patient Monitor Product Portfolio
- Table 82. Mindray Recent Development
- Table 83. Nihon Kohden Company Information
- Table 84. Nihon Kohden Business Overview
- Table 85. Nihon Kohden Patient Monitor Sales (units), Value (US$ Million), Price (USD/unit) and Gross Margin (2021-2026)
- Table 86. Nihon Kohden Patient Monitor Product Portfolio
- Table 87. Nihon Kohden Recent Development
- Table 88. Dräger Company Information
- Table 89. Dräger Business Overview
- Table 90. Dräger Patient Monitor Sales (units), Value (US$ Million), Price (USD/unit) and Gross Margin (2021-2026)
- Table 91. Dräger Patient Monitor Product Portfolio
- Table 92. Dräger Recent Development
- Table 93. Masimo (Danaher) Company Information
- Table 94. Masimo (Danaher) Business Overview
- Table 95. Masimo (Danaher) Patient Monitor Sales (units), Value (US$ Million), Price (USD/unit) and Gross Margin (2021-2026)
- Table 96. Masimo (Danaher) Patient Monitor Product Portfolio
- Table 97. Masimo (Danaher) Recent Development
- Table 98. Spacelabs Healthcare (OSI Systems) Company Information
- Table 99. Spacelabs Healthcare (OSI Systems) Business Overview
- Table 100. Spacelabs Healthcare (OSI Systems) Patient Monitor Sales (units), Value (US$ Million), Price (USD/unit) and Gross Margin (2021-2026)
- Table 101. Spacelabs Healthcare (OSI Systems) Patient Monitor Product Portfolio
- Table 102. Spacelabs Healthcare (OSI Systems) Recent Development
- Table 103. Fukuda Denshi Company Information
- Table 104. Fukuda Denshi Business Overview
- Table 105. Fukuda Denshi Patient Monitor Sales (units), Value (US$ Million), Price (USD/unit) and Gross Margin (2021-2026)
- Table 106. Fukuda Denshi Patient Monitor Product Portfolio
- Table 107. Fukuda Denshi Recent Development
- Table 108. SCHILLER Company Information
- Table 109. SCHILLER Business Overview
- Table 110. SCHILLER Patient Monitor Sales (units), Value (US$ Million), Price (USD/unit) and Gross Margin (2021-2026)
- Table 111. SCHILLER Patient Monitor Product Portfolio
- Table 112. SCHILLER Recent Development
- Table 113. ZOLL Medical Company Information
- Table 114. ZOLL Medical Business Overview
- Table 115. ZOLL Medical Patient Monitor Sales (units), Value (US$ Million), Price (USD/unit) and Gross Margin (2021-2026)
- Table 116. ZOLL Medical Patient Monitor Product Portfolio
- Table 117. ZOLL Medical Recent Development
- Table 118. Baxter (Welch Allyn) Company Information
- Table 119. Baxter (Welch Allyn) Business Overview
- Table 120. Baxter (Welch Allyn) Patient Monitor Sales (units), Value (US$ Million), Price (USD/unit) and Gross Margin (2021-2026)
- Table 121. Baxter (Welch Allyn) Patient Monitor Product Portfolio
- Table 122. Baxter (Welch Allyn) Recent Development
- Table 123. Medtronic Company Information
- Table 124. Medtronic Business Overview
- Table 125. Medtronic Patient Monitor Sales (units), Value (US$ Million), Price (USD/unit) and Gross Margin (2021-2026)
- Table 126. Medtronic Patient Monitor Product Portfolio
- Table 127. Medtronic Recent Development
- Table 128. Stryker (Physio-Control) Company Information
- Table 129. Stryker (Physio-Control) Business Overview
- Table 130. Stryker (Physio-Control) Patient Monitor Sales (units), Value (US$ Million), Price (USD/unit) and Gross Margin (2021-2026)
- Table 131. Stryker (Physio-Control) Patient Monitor Product Portfolio
- Table 132. Stryker (Physio-Control) Recent Development
- Table 133. BD (Advanced Patient Monitoring) Company Information
- Table 134. BD (Advanced Patient Monitoring) Business Overview
- Table 135. BD (Advanced Patient Monitoring) Patient Monitor Sales (units), Value (US$ Million), Price (USD/unit) and Gross Margin (2021-2026)
- Table 136. BD (Advanced Patient Monitoring) Patient Monitor Product Portfolio
- Table 137. BD (Advanced Patient Monitoring) Recent Development
- Table 138. Getinge Company Information
- Table 139. Getinge Business Overview
- Table 140. Getinge Patient Monitor Sales (units), Value (US$ Million), Price (USD/unit) and Gross Margin (2021-2026)
- Table 141. Getinge Patient Monitor Product Portfolio
- Table 142. Getinge Recent Development
- Table 143. ICU Medical Company Information
- Table 144. ICU Medical Business Overview
- Table 145. ICU Medical Patient Monitor Sales (units), Value (US$ Million), Price (USD/unit) and Gross Margin (2021-2026)
- Table 146. ICU Medical Patient Monitor Product Portfolio
- Table 147. ICU Medical Recent Development
- Table 148. Radiometer (Danaher) Company Information
- Table 149. Radiometer (Danaher) Business Overview
- Table 150. Radiometer (Danaher) Patient Monitor Sales (units), Value (US$ Million), Price (USD/unit) and Gross Margin (2021-2026)
- Table 151. Radiometer (Danaher) Patient Monitor Product Portfolio
- Table 152. Radiometer (Danaher) Recent Development
- Table 153. Nonin Medical Company Information
- Table 154. Nonin Medical Business Overview
- Table 155. Nonin Medical Patient Monitor Sales (units), Value (US$ Million), Price (USD/unit) and Gross Margin (2021-2026)
- Table 156. Nonin Medical Patient Monitor Product Portfolio
- Table 157. Nonin Medical Recent Development
- Table 158. Sentec Company Information
- Table 159. Sentec Business Overview
- Table 160. Sentec Patient Monitor Sales (units), Value (US$ Million), Price (USD/unit) and Gross Margin (2021-2026)
- Table 161. Sentec Patient Monitor Product Portfolio
- Table 162. Sentec Recent Development
- Table 163. corpuls Company Information
- Table 164. corpuls Business Overview
- Table 165. corpuls Patient Monitor Sales (units), Value (US$ Million), Price (USD/unit) and Gross Margin (2021-2026)
- Table 166. corpuls Patient Monitor Product Portfolio
- Table 167. corpuls Recent Development
- Table 168. IRadimed Company Information
- Table 169. IRadimed Business Overview
- Table 170. IRadimed Patient Monitor Sales (units), Value (US$ Million), Price (USD/unit) and Gross Margin (2021-2026)
- Table 171. IRadimed Patient Monitor Product Portfolio
- Table 172. IRadimed Recent Development
- Table 173. MIPM Company Information
- Table 174. MIPM Business Overview
- Table 175. MIPM Patient Monitor Sales (units), Value (US$ Million), Price (USD/unit) and Gross Margin (2021-2026)
- Table 176. MIPM Patient Monitor Product Portfolio
- Table 177. MIPM Recent Development
- Table 178. Innomed Medical Company Information
- Table 179. Innomed Medical Business Overview
- Table 180. Innomed Medical Patient Monitor Sales (units), Value (US$ Million), Price (USD/unit) and Gross Margin (2021-2026)
- Table 181. Innomed Medical Patient Monitor Product Portfolio
- Table 182. Innomed Medical Recent Development
- Table 183. EMTEL Company Information
- Table 184. EMTEL Business Overview
- Table 185. EMTEL Patient Monitor Sales (units), Value (US$ Million), Price (USD/unit) and Gross Margin (2021-2026)
- Table 186. EMTEL Patient Monitor Product Portfolio
- Table 187. EMTEL Recent Development
- Table 188. Mennen Medical Company Information
- Table 189. Mennen Medical Business Overview
- Table 190. Mennen Medical Patient Monitor Sales (units), Value (US$ Million), Price (USD/unit) and Gross Margin (2021-2026)
- Table 191. Mennen Medical Patient Monitor Product Portfolio
- Table 192. Mennen Medical Recent Development
- Table 193. UTAS Company Information
- Table 194. UTAS Business Overview
- Table 195. UTAS Patient Monitor Sales (units), Value (US$ Million), Price (USD/unit) and Gross Margin (2021-2026)
- Table 196. UTAS Patient Monitor Product Portfolio
- Table 197. UTAS Recent Development
- Table 198. Infinium Medical Company Information
- Table 199. Infinium Medical Business Overview
- Table 200. Infinium Medical Patient Monitor Sales (units), Value (US$ Million), Price (USD/unit) and Gross Margin (2021-2026)
- Table 201. Infinium Medical Patient Monitor Product Portfolio
- Table 202. Infinium Medical Recent Development
- Table 203. Criticare Technologies Company Information
- Table 204. Criticare Technologies Business Overview
- Table 205. Criticare Technologies Patient Monitor Sales (units), Value (US$ Million), Price (USD/unit) and Gross Margin (2021-2026)
- Table 206. Criticare Technologies Patient Monitor Product Portfolio
- Table 207. Criticare Technologies Recent Development
- Table 208. Clarity Medical Company Information
- Table 209. Clarity Medical Business Overview
- Table 210. Clarity Medical Patient Monitor Sales (units), Value (US$ Million), Price (USD/unit) and Gross Margin (2021-2026)
- Table 211. Clarity Medical Patient Monitor Product Portfolio
- Table 212. Clarity Medical Recent Development
- Table 213. EDAN Instruments Company Information
- Table 214. EDAN Instruments Business Overview
- Table 215. EDAN Instruments Patient Monitor Sales (units), Value (US$ Million), Price (USD/unit) and Gross Margin (2021-2026)
- Table 216. EDAN Instruments Patient Monitor Product Portfolio
- Table 217. EDAN Instruments Recent Development
- Table 218. Shenzhen Comen Medical Instruments Company Information
- Table 219. Shenzhen Comen Medical Instruments Business Overview
- Table 220. Shenzhen Comen Medical Instruments Patient Monitor Sales (units), Value (US$ Million), Price (USD/unit) and Gross Margin (2021-2026)
- Table 221. Shenzhen Comen Medical Instruments Patient Monitor Product Portfolio
- Table 222. Shenzhen Comen Medical Instruments Recent Development
- Table 223. Guangdong Biolight Meditech Company Information
- Table 224. Guangdong Biolight Meditech Business Overview
- Table 225. Guangdong Biolight Meditech Patient Monitor Sales (units), Value (US$ Million), Price (USD/unit) and Gross Margin (2021-2026)
- Table 226. Guangdong Biolight Meditech Patient Monitor Product Portfolio
- Table 227. Guangdong Biolight Meditech Recent Development
- Table 228. Contec Medical Systems Company Information
- Table 229. Contec Medical Systems Business Overview
- Table 230. Contec Medical Systems Patient Monitor Sales (units), Value (US$ Million), Price (USD/unit) and Gross Margin (2021-2026)
- Table 231. Contec Medical Systems Patient Monitor Product Portfolio
- Table 232. Contec Medical Systems Recent Development
- Table 233. Shenzhen Biocare Bio-Medical Equipment Company Information
- Table 234. Shenzhen Biocare Bio-Medical Equipment Business Overview
- Table 235. Shenzhen Biocare Bio-Medical Equipment Patient Monitor Sales (units), Value (US$ Million), Price (USD/unit) and Gross Margin (2021-2026)
- Table 236. Shenzhen Biocare Bio-Medical Equipment Patient Monitor Product Portfolio
- Table 237. Shenzhen Biocare Bio-Medical Equipment Recent Development
- Table 238. Wuhan Zoncare Bio-medical Electronics Company Information
- Table 239. Wuhan Zoncare Bio-medical Electronics Business Overview
- Table 240. Wuhan Zoncare Bio-medical Electronics Patient Monitor Sales (units), Value (US$ Million), Price (USD/unit) and Gross Margin (2021-2026)
- Table 241. Wuhan Zoncare Bio-medical Electronics Patient Monitor Product Portfolio
- Table 242. Wuhan Zoncare Bio-medical Electronics Recent Development
- Table 243. Lepu Medical (Creative Industry, Viatom) Company Information
- Table 244. Lepu Medical (Creative Industry, Viatom) Business Overview
- Table 245. Lepu Medical (Creative Industry, Viatom) Patient Monitor Sales (units), Value (US$ Million), Price (USD/unit) and Gross Margin (2021-2026)
- Table 246. Lepu Medical (Creative Industry, Viatom) Patient Monitor Product Portfolio
- Table 247. Lepu Medical (Creative Industry, Viatom) Recent Development
- Table 248. Shenzhen Hexin Zondan Medical Equipment Company Information
- Table 249. Shenzhen Hexin Zondan Medical Equipment Business Overview
- Table 250. Shenzhen Hexin Zondan Medical Equipment Patient Monitor Sales (units), Value (US$ Million), Price (USD/unit) and Gross Margin (2021-2026)
- Table 251. Shenzhen Hexin Zondan Medical Equipment Patient Monitor Product Portfolio
- Table 252. Shenzhen Hexin Zondan Medical Equipment Recent Development
- Table 253. Heal Force Company Information
- Table 254. Heal Force Business Overview
- Table 255. Heal Force Patient Monitor Sales (units), Value (US$ Million), Price (USD/unit) and Gross Margin (2021-2026)
- Table 256. Heal Force Patient Monitor Product Portfolio
- Table 257. Heal Force Recent Development
- Table 258. Shenzhen Wisonic Medical Technology Company Information
- Table 259. Shenzhen Wisonic Medical Technology Business Overview
- Table 260. Shenzhen Wisonic Medical Technology Patient Monitor Sales (units), Value (US$ Million), Price (USD/unit) and Gross Margin (2021-2026)
- Table 261. Shenzhen Wisonic Medical Technology Patient Monitor Product Portfolio
- Table 262. Shenzhen Wisonic Medical Technology Recent Development
- Table 263. Jiangsu Konsung Bio-Medical Science and Technology Company Information
- Table 264. Jiangsu Konsung Bio-Medical Science and Technology Business Overview
- Table 265. Jiangsu Konsung Bio-Medical Science and Technology Patient Monitor Sales (units), Value (US$ Million), Price (USD/unit) and Gross Margin (2021-2026)
- Table 266. Jiangsu Konsung Bio-Medical Science and Technology Patient Monitor Product Portfolio
- Table 267. Jiangsu Konsung Bio-Medical Science and Technology Recent Development
- Table 268. Beijing M&B Electronic Instruments Company Information
- Table 269. Beijing M&B Electronic Instruments Business Overview
- Table 270. Beijing M&B Electronic Instruments Patient Monitor Sales (units), Value (US$ Million), Price (USD/unit) and Gross Margin (2021-2026)
- Table 271. Beijing M&B Electronic Instruments Patient Monitor Product Portfolio
- Table 272. Beijing M&B Electronic Instruments Recent Development
- Table 273. Beijing Choice Electronic Technology (ChoiceMMed) Company Information
- Table 274. Beijing Choice Electronic Technology (ChoiceMMed) Business Overview
- Table 275. Beijing Choice Electronic Technology (ChoiceMMed) Patient Monitor Sales (units), Value (US$ Million), Price (USD/unit) and Gross Margin (2021-2026)
- Table 276. Beijing Choice Electronic Technology (ChoiceMMed) Patient Monitor Product Portfolio
- Table 277. Beijing Choice Electronic Technology (ChoiceMMed) Recent Development
- Table 278. Bionet Company Information
- Table 279. Bionet Business Overview
- Table 280. Bionet Patient Monitor Sales (units), Value (US$ Million), Price (USD/unit) and Gross Margin (2021-2026)
- Table 281. Bionet Patient Monitor Product Portfolio
- Table 282. Bionet Recent Development
- Table 283. Mediana Company Information
- Table 284. Mediana Business Overview
- Table 285. Mediana Patient Monitor Sales (units), Value (US$ Million), Price (USD/unit) and Gross Margin (2021-2026)
- Table 286. Mediana Patient Monitor Product Portfolio
- Table 287. Mediana Recent Development
- Table 288. Bistos Company Information
- Table 289. Bistos Business Overview
- Table 290. Bistos Patient Monitor Sales (units), Value (US$ Million), Price (USD/unit) and Gross Margin (2021-2026)
- Table 291. Bistos Patient Monitor Product Portfolio
- Table 292. Bistos Recent Development
- Table 293. MEKICS Company Information
- Table 294. MEKICS Business Overview
- Table 295. MEKICS Patient Monitor Sales (units), Value (US$ Million), Price (USD/unit) and Gross Margin (2021-2026)
- Table 296. MEKICS Patient Monitor Product Portfolio
- Table 297. MEKICS Recent Development
- Table 298. Skanray Technologies Company Information
- Table 299. Skanray Technologies Business Overview
- Table 300. Skanray Technologies Patient Monitor Sales (units), Value (US$ Million), Price (USD/unit) and Gross Margin (2021-2026)
- Table 301. Skanray Technologies Patient Monitor Product Portfolio
- Table 302. Skanray Technologies Recent Development
- Table 303. BPL Medical Technologies Company Information
- Table 304. BPL Medical Technologies Business Overview
- Table 305. BPL Medical Technologies Patient Monitor Sales (units), Value (US$ Million), Price (USD/unit) and Gross Margin (2021-2026)
- Table 306. BPL Medical Technologies Patient Monitor Product Portfolio
- Table 307. BPL Medical Technologies Recent Development
- Table 308. Recorders & Medicare Systems Company Information
- Table 309. Recorders & Medicare Systems Business Overview
- Table 310. Recorders & Medicare Systems Patient Monitor Sales (units), Value (US$ Million), Price (USD/unit) and Gross Margin (2021-2026)
- Table 311. Recorders & Medicare Systems Patient Monitor Product Portfolio
- Table 312. Recorders & Medicare Systems Recent Development
- Table 313. Trivitron Healthcare Company Information
- Table 314. Trivitron Healthcare Business Overview
- Table 315. Trivitron Healthcare Patient Monitor Sales (units), Value (US$ Million), Price (USD/unit) and Gross Margin (2021-2026)
- Table 316. Trivitron Healthcare Patient Monitor Product Portfolio
- Table 317. Trivitron Healthcare Recent Development
- Table 318. Allengers Global Healthcare Company Information
- Table 319. Allengers Global Healthcare Business Overview
- Table 320. Allengers Global Healthcare Patient Monitor Sales (units), Value (US$ Million), Price (USD/unit) and Gross Margin (2021-2026)
- Table 321. Allengers Global Healthcare Patient Monitor Product Portfolio
- Table 322. Allengers Global Healthcare Recent Development
- Table 323. ProLife Equipamentos Médicos Company Information
- Table 324. ProLife Equipamentos Médicos Business Overview
- Table 325. ProLife Equipamentos Médicos Patient Monitor Sales (units), Value (US$ Million), Price (USD/unit) and Gross Margin (2021-2026)
- Table 326. ProLife Equipamentos Médicos Patient Monitor Product Portfolio
- Table 327. ProLife Equipamentos Médicos Recent Development
- Table 328. CMOS Drake Company Information
- Table 329. CMOS Drake Business Overview
- Table 330. CMOS Drake Patient Monitor Sales (units), Value (US$ Million), Price (USD/unit) and Gross Margin (2021-2026)
- Table 331. CMOS Drake Patient Monitor Product Portfolio
- Table 332. CMOS Drake Recent Development
- Table 333. Lifemed Company Information
- Table 334. Lifemed Business Overview
- Table 335. Lifemed Patient Monitor Sales (units), Value (US$ Million), Price (USD/unit) and Gross Margin (2021-2026)
- Table 336. Lifemed Patient Monitor Product Portfolio
- Table 337. Lifemed Recent Development
- Table 338. Alfa Med Sistemas Médicos Company Information
- Table 339. Alfa Med Sistemas Médicos Business Overview
- Table 340. Alfa Med Sistemas Médicos Patient Monitor Sales (units), Value (US$ Million), Price (USD/unit) and Gross Margin (2021-2026)
- Table 341. Alfa Med Sistemas Médicos Patient Monitor Product Portfolio
- Table 342. Alfa Med Sistemas Médicos Recent Development
- Table 343. Instramed Company Information
- Table 344. Instramed Business Overview
- Table 345. Instramed Patient Monitor Sales (units), Value (US$ Million), Price (USD/unit) and Gross Margin (2021-2026)
- Table 346. Instramed Patient Monitor Product Portfolio
- Table 347. Instramed Recent Development
- Table 348. Huntleigh Healthcare (Arjo) Company Information
- Table 349. Huntleigh Healthcare (Arjo) Business Overview
- Table 350. Huntleigh Healthcare (Arjo) Patient Monitor Sales (units), Value (US$ Million), Price (USD/unit) and Gross Margin (2021-2026)
- Table 351. Huntleigh Healthcare (Arjo) Patient Monitor Product Portfolio
- Table 352. Huntleigh Healthcare (Arjo) Recent Development
- Table 353. iRhythm (VitalConnect) Company Information
- Table 354. iRhythm (VitalConnect) Business Overview
- Table 355. iRhythm (VitalConnect) Patient Monitor Sales (units), Value (US$ Million), Price (USD/unit) and Gross Margin (2021-2026)
- Table 356. iRhythm (VitalConnect) Patient Monitor Product Portfolio
- Table 357. iRhythm (VitalConnect) Recent Development
- Table 358. BioIntelliSense Company Information
- Table 359. BioIntelliSense Business Overview
- Table 360. BioIntelliSense Patient Monitor Sales (units), Value (US$ Million), Price (USD/unit) and Gross Margin (2021-2026)
- Table 361. BioIntelliSense Patient Monitor Product Portfolio
- Table 362. BioIntelliSense Recent Development
- Table 363. Murata Manufacturing (Vios) Company Information
- Table 364. Murata Manufacturing (Vios) Business Overview
- Table 365. Murata Manufacturing (Vios) Patient Monitor Sales (units), Value (US$ Million), Price (USD/unit) and Gross Margin (2021-2026)
- Table 366. Murata Manufacturing (Vios) Patient Monitor Product Portfolio
- Table 367. Murata Manufacturing (Vios) Recent Development
- Table 368. Key Raw Materials
- Table 369. Raw Materials Key Suppliers
- Table 370. Patient Monitor Distributors List
- Table 371. Patient Monitor Customers List
- Table 372. Research Programs/Design for This Report
- Table 373. Authors List of This Report
- Table 374. Secondary Sources
- Table 375. Primary Sources
List of Figures
- Figure 1. Patient Monitor Product Image
- Figure 2. Global Patient Monitor Sales Value (US$ Million), 2021 VS 2025 VS 2032
- Figure 3. Global Patient Monitor Sales Value (2021-2032) & (US$ Million)
- Figure 4. Global Patient Monitor Sales (2021-2032) & (units)
- Figure 5. Global Patient Monitor Sales Average Price (USD/unit) & (2021-2032)
- Figure 6. Global Patient Monitor Company Revenue Ranking in 2025 (US$ Million)
- Figure 7. Global Top 5 and 10 Company Market Share by Revenue in 2025 (US$ Million)
- Figure 8. Company Type (Tier 1, Tier 2, and Tier 3): 2021 VS 2025
- Figure 9. Multi Parameter Monitors Image
- Figure 10. Spot Check Vital Signs Monitors Image
- Figure 11. Specialty Monitors Image
- Figure 12. Wearable Monitors Image
- Figure 13. Global Patient Monitor Sales Volume by Type (2021 VS 2025 VS 2032) & (units)
- Figure 14. Global Patient Monitor Sales Volume Share 2021 VS 2025 VS 2032
- Figure 15. Global Patient Monitor Sales Volume Share by Type (2021-2032)
- Figure 16. Global Patient Monitor Sales Value by Type (2021 VS 2025 VS 2032) & (US$ Million)
- Figure 17. Global Patient Monitor Sales Value Share 2021 VS 2025 VS 2032
- Figure 18. Global Patient Monitor Sales Value Share by Type (2021-2032)
- Figure 19. Hospitals Image
- Figure 20. Clinics and Ambulatory Care Image
- Figure 21. Emergency Medical Services Image
- Figure 22. Home Healthcare Image
- Figure 23. Others Image
- Figure 24. Global Patient Monitor Sales Volume by Application (2021 VS 2025 VS 2032) & (units)
- Figure 25. Global Patient Monitor Sales Volume Share 2021 VS 2025 VS 2032
- Figure 26. Global Patient Monitor Sales Volume Share by Application (2021-2032)
- Figure 27. Global Patient Monitor Sales Value by Application (2021 VS 2025 VS 2032) & (US$ Million)
- Figure 28. Global Patient Monitor Sales Value Share 2021 VS 2025 VS 2032
- Figure 29. Global Patient Monitor Sales Value Share by Application (2021-2032)
- Figure 30. Global Patient Monitor Sales by Region: 2021 VS 2025 VS 2032 (units)
- Figure 31. Global Patient Monitor Sales Market Share by Region: 2021 VS 2025 VS 2032
- Figure 32. Global Patient Monitor Sales Value Comparison by Region: 2021 VS 2025 VS 2032 (US$ Million)
- Figure 33. Global Patient Monitor Sales Value Share by Region: 2021 VS 2025 VS 2032
- Figure 34. North America Patient Monitor Sales Value (2021-2032) & (US$ Million)
- Figure 35. North America Patient Monitor Sales Value Share by Country (%), 2025 VS 2032
- Figure 36. Europe Patient Monitor Sales Value (2021-2032) & (US$ Million)
- Figure 37. Europe Patient Monitor Sales Value Share by Country (%), 2025 VS 2032
- Figure 38. Asia-Pacific Patient Monitor Sales Value (2021-2032) & (US$ Million)
- Figure 39. Asia-Pacific Patient Monitor Sales Value Share by Country (%), 2025 VS 2032
- Figure 40. South America Patient Monitor Sales Value (2021-2032) & (US$ Million)
- Figure 41. South America Patient Monitor Sales Value Share by Country (%), 2025 VS 2032
- Figure 42. Middle East & Africa Patient Monitor Sales Value (2021-2032) & (US$ Million)
- Figure 43. Middle East & Africa Patient Monitor Sales Value Share by Country (%), 2025 VS 2032
- Figure 44. USA Patient Monitor Sales Value Growth Rate (2021-2032) & (US$ Million)
- Figure 45. USA Patient Monitor Sales Value Share by Type, 2025 VS 2032 & (%)
- Figure 46. USA Patient Monitor Sales Value Share by Application, 2025 VS 2032 & (%)
- Figure 47. Canada Patient Monitor Sales Value Growth Rate (2021-2032) & (US$ Million)
- Figure 48. Canada Patient Monitor Sales Value Share by Type, 2025 VS 2032 & (%)
- Figure 49. Canada Patient Monitor Sales Value Share by Application, 2025 VS 2032 & (%)
- Figure 50. Mexico Patient Monitor Sales Value Growth Rate (2021-2032) & (US$ Million)
- Figure 51. Mexico Patient Monitor Sales Value Share by Type, 2025 VS 2032 & (%)
- Figure 52. Mexico Patient Monitor Sales Value Share by Application, 2025 VS 2032 & (%)
- Figure 53. Germany Patient Monitor Sales Value Growth Rate (2021-2032) & (US$ Million)
- Figure 54. Germany Patient Monitor Sales Value Share by Type, 2025 VS 2032 & (%)
- Figure 55. Germany Patient Monitor Sales Value Share by Application, 2025 VS 2032 & (%)
- Figure 56. France Patient Monitor Sales Value Growth Rate (2021-2032) & (US$ Million)
- Figure 57. France Patient Monitor Sales Value Share by Type, 2025 VS 2032 & (%)
- Figure 58. France Patient Monitor Sales Value Share by Application, 2025 VS 2032 & (%)
- Figure 59. U.K. Patient Monitor Sales Value Growth Rate (2021-2032) & (US$ Million)
- Figure 60. U.K. Patient Monitor Sales Value Share by Type, 2025 VS 2032 & (%)
- Figure 61. U.K. Patient Monitor Sales Value Share by Application, 2025 VS 2032 & (%)
- Figure 62. Italy Patient Monitor Sales Value Growth Rate (2021-2032) & (US$ Million)
- Figure 63. Italy Patient Monitor Sales Value Share by Type, 2025 VS 2032 & (%)
- Figure 64. Italy Patient Monitor Sales Value Share by Application, 2025 VS 2032 & (%)
- Figure 65. Spain Patient Monitor Sales Value Growth Rate (2021-2032) & (US$ Million)
- Figure 66. Spain Patient Monitor Sales Value Share by Type, 2025 VS 2032 & (%)
- Figure 67. Spain Patient Monitor Sales Value Share by Application, 2025 VS 2032 & (%)
- Figure 68. Russia Patient Monitor Sales Value Growth Rate (2021-2032) & (US$ Million)
- Figure 69. Russia Patient Monitor Sales Value Share by Type, 2025 VS 2032 & (%)
- Figure 70. Russia Patient Monitor Sales Value Share by Application, 2025 VS 2032 & (%)
- Figure 71. Netherlands Patient Monitor Sales Value Growth Rate (2021-2032) & (US$ Million)
- Figure 72. Netherlands Patient Monitor Sales Value Share by Type, 2025 VS 2032 & (%)
- Figure 73. Netherlands Patient Monitor Sales Value Share by Application, 2025 VS 2032 & (%)
- Figure 74. Nordic Countries Patient Monitor Sales Value Growth Rate (2021-2032) & (US$ Million)
- Figure 75. Nordic Countries Patient Monitor Sales Value Share by Type, 2025 VS 2032 & (%)
- Figure 76. Nordic Countries Patient Monitor Sales Value Share by Application, 2025 VS 2032 & (%)
- Figure 77. China Patient Monitor Sales Value Growth Rate (2021-2032) & (US$ Million)
- Figure 78. China Patient Monitor Sales Value Share by Type, 2025 VS 2032 & (%)
- Figure 79. China Patient Monitor Sales Value Share by Application, 2025 VS 2032 & (%)
- Figure 80. Japan Patient Monitor Sales Value Growth Rate (2021-2032) & (US$ Million)
- Figure 81. Japan Patient Monitor Sales Value Share by Type, 2025 VS 2032 & (%)
- Figure 82. Japan Patient Monitor Sales Value Share by Application, 2025 VS 2032 & (%)
- Figure 83. South Korea Patient Monitor Sales Value Growth Rate (2021-2032) & (US$ Million)
- Figure 84. South Korea Patient Monitor Sales Value Share by Type, 2025 VS 2032 & (%)
- Figure 85. South Korea Patient Monitor Sales Value Share by Application, 2025 VS 2032 & (%)
- Figure 86. India Patient Monitor Sales Value Growth Rate (2021-2032) & (US$ Million)
- Figure 87. India Patient Monitor Sales Value Share by Type, 2025 VS 2032 & (%)
- Figure 88. India Patient Monitor Sales Value Share by Application, 2025 VS 2032 & (%)
- Figure 89. Australia Patient Monitor Sales Value Growth Rate (2021-2032) & (US$ Million)
- Figure 90. Australia Patient Monitor Sales Value Share by Type, 2025 VS 2032 & (%)
- Figure 91. Australia Patient Monitor Sales Value Share by Application, 2025 VS 2032 & (%)
- Figure 92. Southeast Asia Patient Monitor Sales Value Growth Rate (2021-2032) & (US$ Million)
- Figure 93. Southeast Asia Patient Monitor Sales Value Share by Type, 2025 VS 2032 & (%)
- Figure 94. Southeast Asia Patient Monitor Sales Value Share by Application, 2025 VS 2032 & (%)
- Figure 95. Brazil Patient Monitor Sales Value Growth Rate (2021-2032) & (US$ Million)
- Figure 96. Brazil Patient Monitor Sales Value Share by Type, 2025 VS 2032 & (%)
- Figure 97. Brazil Patient Monitor Sales Value Share by Application, 2025 VS 2032 & (%)
- Figure 98. Argentina Patient Monitor Sales Value Growth Rate (2021-2032) & (US$ Million)
- Figure 99. Argentina Patient Monitor Sales Value Share by Type, 2025 VS 2032 & (%)
- Figure 100. Argentina Patient Monitor Sales Value Share by Application, 2025 VS 2032 & (%)
- Figure 101. Chile Patient Monitor Sales Value Growth Rate (2021-2032) & (US$ Million)
- Figure 102. Chile Patient Monitor Sales Value Share by Type, 2025 VS 2032 & (%)
- Figure 103. Chile Patient Monitor Sales Value Share by Application, 2025 VS 2032 & (%)
- Figure 104. Colombia Patient Monitor Sales Value Growth Rate (2021-2032) & (US$ Million)
- Figure 105. Colombia Patient Monitor Sales Value Share by Type, 2025 VS 2032 & (%)
- Figure 106. Colombia Patient Monitor Sales Value Share by Application, 2025 VS 2032 & (%)
- Figure 107. Peru Patient Monitor Sales Value Growth Rate (2021-2032) & (US$ Million)
- Figure 108. Peru Patient Monitor Sales Value Share by Type, 2025 VS 2032 & (%)
- Figure 109. Peru Patient Monitor Sales Value Share by Application, 2025 VS 2032 & (%)
- Figure 110. Saudi Arabia Patient Monitor Sales Value Growth Rate (2021-2032) & (US$ Million)
- Figure 111. Saudi Arabia Patient Monitor Sales Value Share by Type, 2025 VS 2032 & (%)
- Figure 112. Saudi Arabia Patient Monitor Sales Value Share by Application, 2025 VS 2032 & (%)
- Figure 113. Israel Patient Monitor Sales Value Growth Rate (2021-2032) & (US$ Million)
- Figure 114. Israel Arabia Patient Monitor Sales Value Share by Type, 2025 VS 2032 & (%)
- Figure 115. Israel Arabia Patient Monitor Sales Value Share by Application, 2025 VS 2032 & (%)
- Figure 116. UAE Patient Monitor Sales Value Growth Rate (2021-2032) & (US$ Million)
- Figure 117. UAE Patient Monitor Sales Value Share by Type, 2025 VS 2032 & (%)
- Figure 118. UAE Patient Monitor Sales Value Share by Application, 2025 VS 2032 & (%)
- Figure 119. Turkey Patient Monitor Sales Value Growth Rate (2021-2032) & (US$ Million)
- Figure 120. Turkey Patient Monitor Sales Value Share by Type, 2025 VS 2032 & (%)
- Figure 121. Turkey Patient Monitor Sales Value Share by Application, 2025 VS 2032 & (%)
- Figure 122. Iran Patient Monitor Sales Value Growth Rate (2021-2032) & (US$ Million)
- Figure 123. Iran Patient Monitor Sales Value Share by Type, 2025 VS 2032 & (%)
- Figure 124. Iran Patient Monitor Sales Value Share by Application, 2025 VS 2032 & (%)
- Figure 125. Egypt Patient Monitor Sales Value Growth Rate (2021-2032) & (US$ Million)
- Figure 126. Egypt Patient Monitor Sales Value Share by Type, 2025 VS 2032 & (%)
- Figure 127. Egypt Patient Monitor Sales Value Share by Application, 2025 VS 2032 & (%)
- Figure 128. Patient Monitor Value Chain
- Figure 129. Manufacturing Cost Structure
- Figure 130. Patient Monitor Sales Mode & Process
- Figure 131. Direct Comparison with Distribution Share
- Figure 132. Distributors Profiles
- Figure 133. Years Considered
- Figure 134. Research Process
- Figure 135. Key Executives Interviewed
Scope & coverage.
Types
- Multi Parameter Monitors
- Spot Check Vital Signs Monitors
- Specialty Monitors
- Wearable Monitors
Applications
- Hospitals
- Clinics and Ambulatory Care
- Emergency Medical Services
- Home Healthcare
- Others
Companies covered
- Philips
- GE HealthCare
- Mindray
- Nihon Kohden
- Dräger
- Masimo (Danaher)
- Spacelabs Healthcare (OSI Systems)
- Fukuda Denshi
- SCHILLER
- ZOLL Medical
- Baxter (Welch Allyn)
- Medtronic
- Stryker (Physio-Control)
- BD (Advanced Patient Monitoring)
- Getinge
- ICU Medical
- Radiometer (Danaher)
- Nonin Medical
- Sentec
- corpuls
- IRadimed
- MIPM
- Innomed Medical
- EMTEL
- Mennen Medical
- UTAS
- Infinium Medical
- Criticare Technologies
- Clarity Medical
- EDAN Instruments
- Shenzhen Comen Medical Instruments
- Guangdong Biolight Meditech
- Contec Medical Systems
- Shenzhen Biocare Bio-Medical Equipment
- Wuhan Zoncare Bio-medical Electronics
- Lepu Medical (Creative Industry, Viatom)
- Shenzhen Hexin Zondan Medical Equipment
- Heal Force
- Shenzhen Wisonic Medical Technology
- Jiangsu Konsung Bio-Medical Science and Technology
- Beijing M&B Electronic Instruments
- Beijing Choice Electronic Technology (ChoiceMMed)
- Bionet
- Mediana
- Bistos
- MEKICS
- Skanray Technologies
- BPL Medical Technologies
- Recorders & Medicare Systems
- Trivitron Healthcare
- Allengers Global Healthcare
- ProLife Equipamentos Médicos
- CMOS Drake
- Lifemed
- Alfa Med Sistemas Médicos
- Instramed
- Huntleigh Healthcare (Arjo)
- iRhythm (VitalConnect)
- BioIntelliSense
- Murata Manufacturing (Vios)
Inside the report.
1 Market Overview
- 1.1 Product Definition
- 1.2 Global Market Growth Prospects
- 1.2.1 Global Patient Monitor Sales Value (2021-2032)
- 1.2.2 Global Patient Monitor Sales Volume (2021-2032)
- 1.2.3 Global Patient Monitor Sales Average Price (2021-2032)
- 1.3 Assumptions and Limitations
- 1.4 Study Goals and Objectives
2 Patient Monitor Market Dynamics
- 2.1 Patient Monitor Industry Trends
- 2.2 Patient Monitor Industry Drivers
- 2.3 Patient Monitor Industry Opportunities and Challenges
- 2.4 Patient Monitor Industry Restraints
3 Patient Monitor Market by Company
- 3.1 Global Patient Monitor Company Revenue Ranking in 2025
- 3.2 Global Patient Monitor Revenue by Company (2021-2026)
- 3.3 Global Patient Monitor Sales Volume by Company (2021-2026)
- 3.4 Global Patient Monitor Average Price by Company (2021-2026)
- 3.5 Global Patient Monitor Company Ranking (2024-2026)
- 3.6 Global Patient Monitor Company Manufacturing Base and Headquarters
- 3.7 Global Patient Monitor Company Product Type and Application
- 3.8 Global Patient Monitor Company Establishment Date
- 3.9 Market Competitive Analysis
- 3.9.1 Global Patient Monitor Market Concentration Ratio (CR5 and HHI)
- 3.9.2 Global Top 5 and 10 Company Market Share by Revenue in 2025
- 3.9.3 2025 Patient Monitor Tier 1, Tier 2, and Tier 3 Companies
- 3.10 Mergers and Acquisitions Expansion
4 Patient Monitor Market by Type
- 4.1 Patient Monitor Type Introduction
- 4.1.1 Multi Parameter Monitors
- 4.1.2 Spot Check Vital Signs Monitors
- 4.1.3 Specialty Monitors
- 4.1.4 Wearable Monitors
- 4.2 Global Patient Monitor Sales Volume by Type
- 4.2.1 Global Patient Monitor Sales Volume by Type (2021 VS 2025 VS 2032)
- 4.2.2 Global Patient Monitor Sales Volume by Type (2021-2032)
- 4.2.3 Global Patient Monitor Sales Volume Share by Type (2021-2032)
- 4.3 Global Patient Monitor Sales Value by Type
- 4.3.1 Global Patient Monitor Sales Value by Type (2021 VS 2025 VS 2032)
- 4.3.2 Global Patient Monitor Sales Value by Type (2021-2032)
- 4.3.3 Global Patient Monitor Sales Value Share by Type (2021-2032)
5 Patient Monitor Market by Application
- 5.1 Patient Monitor Application Introduction
- 5.1.1 Hospitals
- 5.1.2 Clinics and Ambulatory Care
- 5.1.3 Emergency Medical Services
- 5.1.4 Home Healthcare
- 5.1.5 Others
- 5.2 Global Patient Monitor Sales Volume by Application
- 5.2.1 Global Patient Monitor Sales Volume by Application (2021 VS 2025 VS 2032)
- 5.2.2 Global Patient Monitor Sales Volume by Application (2021-2032)
- 5.2.3 Global Patient Monitor Sales Volume Share by Application (2021-2032)
- 5.3 Global Patient Monitor Sales Value by Application
- 5.3.1 Global Patient Monitor Sales Value by Application (2021 VS 2025 VS 2032)
- 5.3.2 Global Patient Monitor Sales Value by Application (2021-2032)
- 5.3.3 Global Patient Monitor Sales Value Share by Application (2021-2032)
6 Patient Monitor Regional Sales and Value Analysis
- 6.1 Global Patient Monitor Sales by Region: 2021 VS 2025 VS 2032
- 6.2 Global Patient Monitor Sales by Region (2021-2032)
- 6.2.1 Global Patient Monitor Sales by Region: 2021-2026
- 6.2.2 Global Patient Monitor Sales by Region (2027-2032)
- 6.3 Global Patient Monitor Sales Value by Region: 2021 VS 2025 VS 2032
- 6.4 Global Patient Monitor Sales Value by Region (2021-2032)
- 6.4.1 Global Patient Monitor Sales Value by Region: 2021-2026
- 6.4.2 Global Patient Monitor Sales Value by Region (2027-2032)
- 6.5 Global Patient Monitor Market Price Analysis by Region (2021-2026)
- 6.6 North America
- 6.6.1 North America Patient Monitor Sales Value (2021-2032)
- 6.6.2 North America Patient Monitor Sales Value Share by Country, 2025 VS 2032
- 6.7 Europe
- 6.7.1 Europe Patient Monitor Sales Value (2021-2032)
- 6.7.2 Europe Patient Monitor Sales Value Share by Country, 2025 VS 2032
- 6.8 Asia-Pacific
- 6.8.1 Asia-Pacific Patient Monitor Sales Value (2021-2032)
- 6.8.2 Asia-Pacific Patient Monitor Sales Value Share by Country, 2025 VS 2032
- 6.9 South America
- 6.9.1 South America Patient Monitor Sales Value (2021-2032)
- 6.9.2 South America Patient Monitor Sales Value Share by Country, 2025 VS 2032
- 6.10 Middle East & Africa
- 6.10.1 Middle East & Africa Patient Monitor Sales Value (2021-2032)
- 6.10.2 Middle East & Africa Patient Monitor Sales Value Share by Country, 2025 VS 2032
7 Patient Monitor Country-level Sales and Value Analysis
- 7.1 Global Patient Monitor Sales by Country: 2021 VS 2025 VS 2032
- 7.2 Global Patient Monitor Sales Value by Country: 2021 VS 2025 VS 2032
- 7.3 Global Patient Monitor Sales by Country (2021-2032)
- 7.3.1 Global Patient Monitor Sales by Country (2021-2026)
- 7.3.2 Global Patient Monitor Sales by Country (2027-2032)
- 7.4 Global Patient Monitor Sales Value by Country (2021-2032)
- 7.4.1 Global Patient Monitor Sales Value by Country (2021-2026)
- 7.4.2 Global Patient Monitor Sales Value by Country (2027-2032)
- 7.5 USA
- 7.5.1 USA Patient Monitor Sales Value Growth Rate (2021-2032)
- 7.5.2 USA Patient Monitor Sales Value Share by Type, 2025 VS 2032
- 7.5.3 USA Patient Monitor Sales Value Share by Application, 2025 VS 2032
- 7.6 Canada
- 7.6.1 Canada Patient Monitor Sales Value Growth Rate (2021-2032)
- 7.6.2 Canada Patient Monitor Sales Value Share by Type, 2025 VS 2032
- 7.6.3 Canada Patient Monitor Sales Value Share by Application, 2025 VS 2032
- 7.7 Mexico
- 7.6.1 Mexico Patient Monitor Sales Value Growth Rate (2021-2032)
- 7.6.2 Mexico Patient Monitor Sales Value Share by Type, 2025 VS 2032
- 7.6.3 Mexico Patient Monitor Sales Value Share by Application, 2025 VS 2032
- 7.8 Germany
- 7.8.1 Germany Patient Monitor Sales Value Growth Rate (2021-2032)
- 7.8.2 Germany Patient Monitor Sales Value Share by Type, 2025 VS 2032
- 7.8.3 Germany Patient Monitor Sales Value Share by Application, 2025 VS 2032
- 7.9 France
- 7.9.1 France Patient Monitor Sales Value Growth Rate (2021-2032)
- 7.9.2 France Patient Monitor Sales Value Share by Type, 2025 VS 2032
- 7.9.3 France Patient Monitor Sales Value Share by Application, 2025 VS 2032
- 7.10 U.K.
- 7.10.1 U.K. Patient Monitor Sales Value Growth Rate (2021-2032)
- 7.10.2 U.K. Patient Monitor Sales Value Share by Type, 2025 VS 2032
- 7.10.3 U.K. Patient Monitor Sales Value Share by Application, 2025 VS 2032
- 7.11 Italy
- 7.11.1 Italy Patient Monitor Sales Value Growth Rate (2021-2032)
- 7.11.2 Italy Patient Monitor Sales Value Share by Type, 2025 VS 2032
- 7.11.3 Italy Patient Monitor Sales Value Share by Application, 2025 VS 2032
- 7.12 Spain
- 7.12.1 Spain Patient Monitor Sales Value Growth Rate (2021-2032)
- 7.12.2 Spain Patient Monitor Sales Value Share by Type, 2025 VS 2032
- 7.12.3 Spain Patient Monitor Sales Value Share by Application, 2025 VS 2032
- 7.13 Russia
- 7.13.1 Russia Patient Monitor Sales Value Growth Rate (2021-2032)
- 7.13.2 Russia Patient Monitor Sales Value Share by Type, 2025 VS 2032
- 7.13.3 Russia Patient Monitor Sales Value Share by Application, 2025 VS 2032
- 7.14 Netherlands
- 7.14.1 Netherlands Patient Monitor Sales Value Growth Rate (2021-2032)
- 7.14.2 Netherlands Patient Monitor Sales Value Share by Type, 2025 VS 2032
- 7.14.3 Netherlands Patient Monitor Sales Value Share by Application, 2025 VS 2032
- 7.15 Nordic Countries
- 7.15.1 Nordic Countries Patient Monitor Sales Value Growth Rate (2021-2032)
- 7.15.2 Nordic Countries Patient Monitor Sales Value Share by Type, 2025 VS 2032
- 7.15.3 Nordic Countries Patient Monitor Sales Value Share by Application, 2025 VS 2032
- 7.16 China
- 7.16.1 China Patient Monitor Sales Value Growth Rate (2021-2032)
- 7.16.2 China Patient Monitor Sales Value Share by Type, 2025 VS 2032
- 7.16.3 China Patient Monitor Sales Value Share by Application, 2025 VS 2032
- 7.17 Japan
- 7.17.1 Japan Patient Monitor Sales Value Growth Rate (2021-2032)
- 7.17.2 Japan Patient Monitor Sales Value Share by Type, 2025 VS 2032
- 7.17.3 Japan Patient Monitor Sales Value Share by Application, 2025 VS 2032
- 7.18 South Korea
- 7.18.1 South Korea Patient Monitor Sales Value Growth Rate (2021-2032)
- 7.18.2 South Korea Patient Monitor Sales Value Share by Type, 2025 VS 2032
- 7.18.3 South Korea Patient Monitor Sales Value Share by Application, 2025 VS 2032
- 7.19 India
- 7.19.1 India Patient Monitor Sales Value Growth Rate (2021-2032)
- 7.19.2 India Patient Monitor Sales Value Share by Type, 2025 VS 2032
- 7.19.3 India Patient Monitor Sales Value Share by Application, 2025 VS 2032
- 7.20 Australia
- 7.20.1 Australia Patient Monitor Sales Value Growth Rate (2021-2032)
- 7.20.2 Australia Patient Monitor Sales Value Share by Type, 2025 VS 2032
- 7.20.3 Australia Patient Monitor Sales Value Share by Application, 2025 VS 2032
- 7.21 Southeast Asia
- 7.21.1 Southeast Asia Patient Monitor Sales Value Growth Rate (2021-2032)
- 7.21.2 Southeast Asia Patient Monitor Sales Value Share by Type, 2025 VS 2032
- 7.21.3 Southeast Asia Patient Monitor Sales Value Share by Application, 2025 VS 2032
- 7.22 Brazil
- 7.22.1 Brazil Patient Monitor Sales Value Growth Rate (2021-2032)
- 7.22.2 Brazil Patient Monitor Sales Value Share by Type, 2025 VS 2032
- 7.22.3 Brazil Patient Monitor Sales Value Share by Application, 2025 VS 2032
- 7.23 Argentina
- 7.23.1 Argentina Patient Monitor Sales Value Growth Rate (2021-2032)
- 7.23.2 Argentina Patient Monitor Sales Value Share by Type, 2025 VS 2032
- 7.23.3 Argentina Patient Monitor Sales Value Share by Application, 2025 VS 2032
- 7.24 Chile
- 7.24.1 Chile Patient Monitor Sales Value Growth Rate (2021-2032)
- 7.24.2 Chile Patient Monitor Sales Value Share by Type, 2025 VS 2032
- 7.24.3 Chile Patient Monitor Sales Value Share by Application, 2025 VS 2032
- 7.25 Colombia
- 7.25.1 Colombia Patient Monitor Sales Value Growth Rate (2021-2032)
- 7.25.2 Colombia Patient Monitor Sales Value Share by Type, 2025 VS 2032
- 7.25.3 Colombia Patient Monitor Sales Value Share by Application, 2025 VS 2032
- 7.26 Peru
- 7.26.1 Peru Patient Monitor Sales Value Growth Rate (2021-2032)
- 7.26.2 Peru Patient Monitor Sales Value Share by Type, 2025 VS 2032
- 7.26.3 Peru Patient Monitor Sales Value Share by Application, 2025 VS 2032
- 7.27 Saudi Arabia
- 7.27.1 Saudi Arabia Patient Monitor Sales Value Growth Rate (2021-2032)
- 7.27.2 Saudi Arabia Patient Monitor Sales Value Share by Type, 2025 VS 2032
- 7.27.3 Saudi Arabia Patient Monitor Sales Value Share by Application, 2025 VS 2032
- 7.28 Israel
- 7.28.1 Israel Patient Monitor Sales Value Growth Rate (2021-2032)
- 7.28.2 Israel Patient Monitor Sales Value Share by Type, 2025 VS 2032
- 7.28.3 Israel Patient Monitor Sales Value Share by Application, 2025 VS 2032
- 7.29 UAE
- 7.29.1 UAE Patient Monitor Sales Value Growth Rate (2021-2032)
- 7.29.2 UAE Patient Monitor Sales Value Share by Type, 2025 VS 2032
- 7.29.3 UAE Patient Monitor Sales Value Share by Application, 2025 VS 2032
- 7.30 Turkey
- 7.30.1 Turkey Patient Monitor Sales Value Growth Rate (2021-2032)
- 7.30.2 Turkey Patient Monitor Sales Value Share by Type, 2025 VS 2032
- 7.30.3 Turkey Patient Monitor Sales Value Share by Application, 2025 VS 2032
- 7.31 Iran
- 7.31.1 Iran Patient Monitor Sales Value Growth Rate (2021-2032)
- 7.31.2 Iran Patient Monitor Sales Value Share by Type, 2025 VS 2032
- 7.31.3 Iran Patient Monitor Sales Value Share by Application, 2025 VS 2032
- 7.32 Egypt
- 7.32.1 Egypt Patient Monitor Sales Value Growth Rate (2021-2032)
- 7.32.2 Egypt Patient Monitor Sales Value Share by Type, 2025 VS 2032
- 7.32.3 Egypt Patient Monitor Sales Value Share by Application, 2025 VS 2032
8 Company Profiles
- 8.1 Philips
- 8.1.1 Philips Company Information
- 8.1.2 Philips Business Overview
- 8.1.3 Philips Patient Monitor Sales, Value and Gross Margin (2021-2026)
- 8.1.4 Philips Patient Monitor Product Portfolio
- 8.1.5 Philips Recent Developments
- 8.2 GE HealthCare
- 8.2.1 GE HealthCare Company Information
- 8.2.2 GE HealthCare Business Overview
- 8.2.3 GE HealthCare Patient Monitor Sales, Value and Gross Margin (2021-2026)
- 8.2.4 GE HealthCare Patient Monitor Product Portfolio
- 8.2.5 GE HealthCare Recent Developments
- 8.3 Mindray
- 8.3.1 Mindray Company Information
- 8.3.2 Mindray Business Overview
- 8.3.3 Mindray Patient Monitor Sales, Value and Gross Margin (2021-2026)
- 8.3.4 Mindray Patient Monitor Product Portfolio
- 8.3.5 Mindray Recent Developments
- 8.4 Nihon Kohden
- 8.4.1 Nihon Kohden Company Information
- 8.4.2 Nihon Kohden Business Overview
- 8.4.3 Nihon Kohden Patient Monitor Sales, Value and Gross Margin (2021-2026)
- 8.4.4 Nihon Kohden Patient Monitor Product Portfolio
- 8.4.5 Nihon Kohden Recent Developments
- 8.5 Dräger
- 8.5.1 Dräger Company Information
- 8.5.2 Dräger Business Overview
- 8.5.3 Dräger Patient Monitor Sales, Value and Gross Margin (2021-2026)
- 8.5.4 Dräger Patient Monitor Product Portfolio
- 8.5.5 Dräger Recent Developments
- 8.6 Masimo (Danaher)
- 8.6.1 Masimo (Danaher) Company Information
- 8.6.2 Masimo (Danaher) Business Overview
- 8.6.3 Masimo (Danaher) Patient Monitor Sales, Value and Gross Margin (2021-2026)
- 8.6.4 Masimo (Danaher) Patient Monitor Product Portfolio
- 8.6.5 Masimo (Danaher) Recent Developments
- 8.7 Spacelabs Healthcare (OSI Systems)
- 8.7.1 Spacelabs Healthcare (OSI Systems) Company Information
- 8.7.2 Spacelabs Healthcare (OSI Systems) Business Overview
- 8.7.3 Spacelabs Healthcare (OSI Systems) Patient Monitor Sales, Value and Gross Margin (2021-2026)
- 8.7.4 Spacelabs Healthcare (OSI Systems) Patient Monitor Product Portfolio
- 8.7.5 Spacelabs Healthcare (OSI Systems) Recent Developments
- 8.8 Fukuda Denshi
- 8.8.1 Fukuda Denshi Company Information
- 8.8.2 Fukuda Denshi Business Overview
- 8.8.3 Fukuda Denshi Patient Monitor Sales, Value and Gross Margin (2021-2026)
- 8.8.4 Fukuda Denshi Patient Monitor Product Portfolio
- 8.8.5 Fukuda Denshi Recent Developments
- 8.9 SCHILLER
- 8.9.1 SCHILLER Company Information
- 8.9.2 SCHILLER Business Overview
- 8.9.3 SCHILLER Patient Monitor Sales, Value and Gross Margin (2021-2026)
- 8.9.4 SCHILLER Patient Monitor Product Portfolio
- 8.9.5 SCHILLER Recent Developments
- 8.10 ZOLL Medical
- 8.10.1 ZOLL Medical Company Information
- 8.10.2 ZOLL Medical Business Overview
- 8.10.3 ZOLL Medical Patient Monitor Sales, Value and Gross Margin (2021-2026)
- 8.10.4 ZOLL Medical Patient Monitor Product Portfolio
- 8.10.5 ZOLL Medical Recent Developments
- 8.11 Baxter (Welch Allyn)
- 8.11.1 Baxter (Welch Allyn) Company Information
- 8.11.2 Baxter (Welch Allyn) Business Overview
- 8.11.3 Baxter (Welch Allyn) Patient Monitor Sales, Value and Gross Margin (2021-2026)
- 8.11.4 Baxter (Welch Allyn) Patient Monitor Product Portfolio
- 8.11.5 Baxter (Welch Allyn) Recent Developments
- 8.12 Medtronic
- 8.12.1 Medtronic Company Information
- 8.12.2 Medtronic Business Overview
- 8.12.3 Medtronic Patient Monitor Sales, Value and Gross Margin (2021-2026)
- 8.12.4 Medtronic Patient Monitor Product Portfolio
- 8.12.5 Medtronic Recent Developments
- 8.13 Stryker (Physio-Control)
- 8.13.1 Stryker (Physio-Control) Company Information
- 8.13.2 Stryker (Physio-Control) Business Overview
- 8.13.3 Stryker (Physio-Control) Patient Monitor Sales, Value and Gross Margin (2021-2026)
- 8.13.4 Stryker (Physio-Control) Patient Monitor Product Portfolio
- 8.13.5 Stryker (Physio-Control) Recent Developments
- 8.14 BD (Advanced Patient Monitoring)
- 8.14.1 BD (Advanced Patient Monitoring) Company Information
- 8.14.2 BD (Advanced Patient Monitoring) Business Overview
- 8.14.3 BD (Advanced Patient Monitoring) Patient Monitor Sales, Value and Gross Margin (2021-2026)
- 8.14.4 BD (Advanced Patient Monitoring) Patient Monitor Product Portfolio
- 8.14.5 BD (Advanced Patient Monitoring) Recent Developments
- 8.15 Getinge
- 8.15.1 Getinge Company Information
- 8.15.2 Getinge Business Overview
- 8.15.3 Getinge Patient Monitor Sales, Value and Gross Margin (2021-2026)
- 8.15.4 Getinge Patient Monitor Product Portfolio
- 8.15.5 Getinge Recent Developments
- 8.16 ICU Medical
- 8.16.1 ICU Medical Company Information
- 8.16.2 ICU Medical Business Overview
- 8.16.3 ICU Medical Patient Monitor Sales, Value and Gross Margin (2021-2026)
- 8.16.4 ICU Medical Patient Monitor Product Portfolio
- 8.16.5 ICU Medical Recent Developments
- 8.17 Radiometer (Danaher)
- 8.17.1 Radiometer (Danaher) Company Information
- 8.17.2 Radiometer (Danaher) Business Overview
- 8.17.3 Radiometer (Danaher) Patient Monitor Sales, Value and Gross Margin (2021-2026)
- 8.17.4 Radiometer (Danaher) Patient Monitor Product Portfolio
- 8.17.5 Radiometer (Danaher) Recent Developments
- 8.18 Nonin Medical
- 8.18.1 Nonin Medical Company Information
- 8.18.2 Nonin Medical Business Overview
- 8.18.3 Nonin Medical Patient Monitor Sales, Value and Gross Margin (2021-2026)
- 8.18.4 Nonin Medical Patient Monitor Product Portfolio
- 8.18.5 Nonin Medical Recent Developments
- 8.19 Sentec
- 8.19.1 Sentec Company Information
- 8.19.2 Sentec Business Overview
- 8.19.3 Sentec Patient Monitor Sales, Value and Gross Margin (2021-2026)
- 8.19.4 Sentec Patient Monitor Product Portfolio
- 8.19.5 Sentec Recent Developments
- 8.20 corpuls
- 8.20.1 corpuls Company Information
- 8.20.2 corpuls Business Overview
- 8.20.3 corpuls Patient Monitor Sales, Value and Gross Margin (2021-2026)
- 8.20.4 corpuls Patient Monitor Product Portfolio
- 8.20.5 corpuls Recent Developments
- 8.21 IRadimed
- 8.21.1 IRadimed Company Information
- 8.21.2 IRadimed Business Overview
- 8.21.3 IRadimed Patient Monitor Sales, Value and Gross Margin (2021-2026)
- 8.21.4 IRadimed Patient Monitor Product Portfolio
- 8.21.5 IRadimed Recent Developments
- 8.22 MIPM
- 8.22.1 MIPM Company Information
- 8.22.2 MIPM Business Overview
- 8.22.3 MIPM Patient Monitor Sales, Value and Gross Margin (2021-2026)
- 8.22.4 MIPM Patient Monitor Product Portfolio
- 8.22.5 MIPM Recent Developments
- 8.23 Innomed Medical
- 8.23.1 Innomed Medical Company Information
- 8.23.2 Innomed Medical Business Overview
- 8.23.3 Innomed Medical Patient Monitor Sales, Value and Gross Margin (2021-2026)
- 8.23.4 Innomed Medical Patient Monitor Product Portfolio
- 8.23.5 Innomed Medical Recent Developments
- 8.24 EMTEL
- 8.24.1 EMTEL Company Information
- 8.24.2 EMTEL Business Overview
- 8.24.3 EMTEL Patient Monitor Sales, Value and Gross Margin (2021-2026)
- 8.24.4 EMTEL Patient Monitor Product Portfolio
- 8.24.5 EMTEL Recent Developments
- 8.25 Mennen Medical
- 8.25.1 Mennen Medical Company Information
- 8.25.2 Mennen Medical Business Overview
- 8.25.3 Mennen Medical Patient Monitor Sales, Value and Gross Margin (2021-2026)
- 8.25.4 Mennen Medical Patient Monitor Product Portfolio
- 8.25.5 Mennen Medical Recent Developments
- 8.26 UTAS
- 8.26.1 UTAS Company Information
- 8.26.2 UTAS Business Overview
- 8.26.3 UTAS Patient Monitor Sales, Value and Gross Margin (2021-2026)
- 8.26.4 UTAS Patient Monitor Product Portfolio
- 8.26.5 UTAS Recent Developments
- 8.27 Infinium Medical
- 8.27.1 Infinium Medical Company Information
- 8.27.2 Infinium Medical Business Overview
- 8.27.3 Infinium Medical Patient Monitor Sales, Value and Gross Margin (2021-2026)
- 8.27.4 Infinium Medical Patient Monitor Product Portfolio
- 8.27.5 Infinium Medical Recent Developments
- 8.28 Criticare Technologies
- 8.28.1 Criticare Technologies Company Information
- 8.28.2 Criticare Technologies Business Overview
- 8.28.3 Criticare Technologies Patient Monitor Sales, Value and Gross Margin (2021-2026)
- 8.28.4 Criticare Technologies Patient Monitor Product Portfolio
- 8.28.5 Criticare Technologies Recent Developments
- 8.29 Clarity Medical
- 8.29.1 Clarity Medical Company Information
- 8.29.2 Clarity Medical Business Overview
- 8.29.3 Clarity Medical Patient Monitor Sales, Value and Gross Margin (2021-2026)
- 8.29.4 Clarity Medical Patient Monitor Product Portfolio
- 8.29.5 Clarity Medical Recent Developments
- 8.30 EDAN Instruments
- 8.30.1 EDAN Instruments Company Information
- 8.30.2 EDAN Instruments Business Overview
- 8.30.3 EDAN Instruments Patient Monitor Sales, Value and Gross Margin (2021-2026)
- 8.30.4 EDAN Instruments Patient Monitor Product Portfolio
- 8.30.5 EDAN Instruments Recent Developments
- 8.31 Shenzhen Comen Medical Instruments
- 8.31.1 Shenzhen Comen Medical Instruments Company Information
- 8.31.2 Shenzhen Comen Medical Instruments Business Overview
- 8.31.3 Shenzhen Comen Medical Instruments Patient Monitor Sales, Value and Gross Margin (2021-2026)
- 8.31.4 Shenzhen Comen Medical Instruments Patient Monitor Product Portfolio
- 8.31.5 Shenzhen Comen Medical Instruments Recent Developments
- 8.32 Guangdong Biolight Meditech
- 8.32.1 Guangdong Biolight Meditech Company Information
- 8.32.2 Guangdong Biolight Meditech Business Overview
- 8.32.3 Guangdong Biolight Meditech Patient Monitor Sales, Value and Gross Margin (2021-2026)
- 8.32.4 Guangdong Biolight Meditech Patient Monitor Product Portfolio
- 8.32.5 Guangdong Biolight Meditech Recent Developments
- 8.33 Contec Medical Systems
- 8.33.1 Contec Medical Systems Company Information
- 8.33.2 Contec Medical Systems Business Overview
- 8.33.3 Contec Medical Systems Patient Monitor Sales, Value and Gross Margin (2021-2026)
- 8.33.4 Contec Medical Systems Patient Monitor Product Portfolio
- 8.33.5 Contec Medical Systems Recent Developments
- 8.34 Shenzhen Biocare Bio-Medical Equipment
- 8.34.1 Shenzhen Biocare Bio-Medical Equipment Company Information
- 8.34.2 Shenzhen Biocare Bio-Medical Equipment Business Overview
- 8.34.3 Shenzhen Biocare Bio-Medical Equipment Patient Monitor Sales, Value and Gross Margin (2021-2026)
- 8.34.4 Shenzhen Biocare Bio-Medical Equipment Patient Monitor Product Portfolio
- 8.34.5 Shenzhen Biocare Bio-Medical Equipment Recent Developments
- 8.35 Wuhan Zoncare Bio-medical Electronics
- 8.35.1 Wuhan Zoncare Bio-medical Electronics Company Information
- 8.35.2 Wuhan Zoncare Bio-medical Electronics Business Overview
- 8.35.3 Wuhan Zoncare Bio-medical Electronics Patient Monitor Sales, Value and Gross Margin (2021-2026)
- 8.35.4 Wuhan Zoncare Bio-medical Electronics Patient Monitor Product Portfolio
- 8.35.5 Wuhan Zoncare Bio-medical Electronics Recent Developments
- 8.36 Lepu Medical (Creative Industry, Viatom)
- 8.36.1 Lepu Medical (Creative Industry, Viatom) Company Information
- 8.36.2 Lepu Medical (Creative Industry, Viatom) Business Overview
- 8.36.3 Lepu Medical (Creative Industry, Viatom) Patient Monitor Sales, Value and Gross Margin (2021-2026)
- 8.36.4 Lepu Medical (Creative Industry, Viatom) Patient Monitor Product Portfolio
- 8.36.5 Lepu Medical (Creative Industry, Viatom) Recent Developments
- 8.37 Shenzhen Hexin Zondan Medical Equipment
- 8.37.1 Shenzhen Hexin Zondan Medical Equipment Company Information
- 8.37.2 Shenzhen Hexin Zondan Medical Equipment Business Overview
- 8.37.3 Shenzhen Hexin Zondan Medical Equipment Patient Monitor Sales, Value and Gross Margin (2021-2026)
- 8.37.4 Shenzhen Hexin Zondan Medical Equipment Patient Monitor Product Portfolio
- 8.37.5 Shenzhen Hexin Zondan Medical Equipment Recent Developments
- 8.38 Heal Force
- 8.38.1 Heal Force Company Information
- 8.38.2 Heal Force Business Overview
- 8.38.3 Heal Force Patient Monitor Sales, Value and Gross Margin (2021-2026)
- 8.38.4 Heal Force Patient Monitor Product Portfolio
- 8.38.5 Heal Force Recent Developments
- 8.39 Shenzhen Wisonic Medical Technology
- 8.39.1 Shenzhen Wisonic Medical Technology Company Information
- 8.39.2 Shenzhen Wisonic Medical Technology Business Overview
- 8.39.3 Shenzhen Wisonic Medical Technology Patient Monitor Sales, Value and Gross Margin (2021-2026)
- 8.39.4 Shenzhen Wisonic Medical Technology Patient Monitor Product Portfolio
- 8.39.5 Shenzhen Wisonic Medical Technology Recent Developments
- 8.40 Jiangsu Konsung Bio-Medical Science and Technology
- 8.40.1 Jiangsu Konsung Bio-Medical Science and Technology Company Information
- 8.40.2 Jiangsu Konsung Bio-Medical Science and Technology Business Overview
- 8.40.3 Jiangsu Konsung Bio-Medical Science and Technology Patient Monitor Sales, Value and Gross Margin (2021-2026)
- 8.40.4 Jiangsu Konsung Bio-Medical Science and Technology Patient Monitor Product Portfolio
- 8.40.5 Jiangsu Konsung Bio-Medical Science and Technology Recent Developments
- 8.41 Beijing M&B Electronic Instruments
- 8.41.1 Beijing M&B Electronic Instruments Company Information
- 8.41.2 Beijing M&B Electronic Instruments Business Overview
- 8.41.3 Beijing M&B Electronic Instruments Patient Monitor Sales, Value and Gross Margin (2021-2026)
- 8.41.4 Beijing M&B Electronic Instruments Patient Monitor Product Portfolio
- 8.41.5 Beijing M&B Electronic Instruments Recent Developments
- 8.42 Beijing Choice Electronic Technology (ChoiceMMed)
- 8.42.1 Beijing Choice Electronic Technology (ChoiceMMed) Company Information
- 8.42.2 Beijing Choice Electronic Technology (ChoiceMMed) Business Overview
- 8.42.3 Beijing Choice Electronic Technology (ChoiceMMed) Patient Monitor Sales, Value and Gross Margin (2021-2026)
- 8.42.4 Beijing Choice Electronic Technology (ChoiceMMed) Patient Monitor Product Portfolio
- 8.42.5 Beijing Choice Electronic Technology (ChoiceMMed) Recent Developments
- 8.43 Bionet
- 8.43.1 Bionet Company Information
- 8.43.2 Bionet Business Overview
- 8.43.3 Bionet Patient Monitor Sales, Value and Gross Margin (2021-2026)
- 8.43.4 Bionet Patient Monitor Product Portfolio
- 8.43.5 Bionet Recent Developments
- 8.44 Mediana
- 8.44.1 Mediana Company Information
- 8.44.2 Mediana Business Overview
- 8.44.3 Mediana Patient Monitor Sales, Value and Gross Margin (2021-2026)
- 8.44.4 Mediana Patient Monitor Product Portfolio
- 8.44.5 Mediana Recent Developments
- 8.45 Bistos
- 8.45.1 Bistos Company Information
- 8.45.2 Bistos Business Overview
- 8.45.3 Bistos Patient Monitor Sales, Value and Gross Margin (2021-2026)
- 8.45.4 Bistos Patient Monitor Product Portfolio
- 8.45.5 Bistos Recent Developments
- 8.46 MEKICS
- 8.46.1 MEKICS Company Information
- 8.46.2 MEKICS Business Overview
- 8.46.3 MEKICS Patient Monitor Sales, Value and Gross Margin (2021-2026)
- 8.46.4 MEKICS Patient Monitor Product Portfolio
- 8.46.5 MEKICS Recent Developments
- 8.47 Skanray Technologies
- 8.47.1 Skanray Technologies Company Information
- 8.47.2 Skanray Technologies Business Overview
- 8.47.3 Skanray Technologies Patient Monitor Sales, Value and Gross Margin (2021-2026)
- 8.47.4 Skanray Technologies Patient Monitor Product Portfolio
- 8.47.5 Skanray Technologies Recent Developments
- 8.48 BPL Medical Technologies
- 8.48.1 BPL Medical Technologies Company Information
- 8.48.2 BPL Medical Technologies Business Overview
- 8.48.3 BPL Medical Technologies Patient Monitor Sales, Value and Gross Margin (2021-2026)
- 8.48.4 BPL Medical Technologies Patient Monitor Product Portfolio
- 8.48.5 BPL Medical Technologies Recent Developments
- 8.49 Recorders & Medicare Systems
- 8.49.1 Recorders & Medicare Systems Company Information
- 8.49.2 Recorders & Medicare Systems Business Overview
- 8.49.3 Recorders & Medicare Systems Patient Monitor Sales, Value and Gross Margin (2021-2026)
- 8.49.4 Recorders & Medicare Systems Patient Monitor Product Portfolio
- 8.49.5 Recorders & Medicare Systems Recent Developments
- 8.50 Trivitron Healthcare
- 8.50.1 Trivitron Healthcare Company Information
- 8.50.2 Trivitron Healthcare Business Overview
- 8.50.3 Trivitron Healthcare Patient Monitor Sales, Value and Gross Margin (2021-2026)
- 8.50.4 Trivitron Healthcare Patient Monitor Product Portfolio
- 8.50.5 Trivitron Healthcare Recent Developments
- 8.51 Allengers Global Healthcare
- 8.51.1 Allengers Global Healthcare Company Information
- 8.51.2 Allengers Global Healthcare Business Overview
- 8.51.3 Allengers Global Healthcare Patient Monitor Sales, Value and Gross Margin (2021-2026)
- 8.51.4 Allengers Global Healthcare Patient Monitor Product Portfolio
- 8.51.5 Allengers Global Healthcare Recent Developments
- 8.52 ProLife Equipamentos Médicos
- 8.52.1 ProLife Equipamentos Médicos Company Information
- 8.52.2 ProLife Equipamentos Médicos Business Overview
- 8.52.3 ProLife Equipamentos Médicos Patient Monitor Sales, Value and Gross Margin (2021-2026)
- 8.52.4 ProLife Equipamentos Médicos Patient Monitor Product Portfolio
- 8.52.5 ProLife Equipamentos Médicos Recent Developments
- 8.53 CMOS Drake
- 8.53.1 CMOS Drake Company Information
- 8.53.2 CMOS Drake Business Overview
- 8.53.3 CMOS Drake Patient Monitor Sales, Value and Gross Margin (2021-2026)
- 8.53.4 CMOS Drake Patient Monitor Product Portfolio
- 8.53.5 CMOS Drake Recent Developments
- 8.54 Lifemed
- 8.54.1 Lifemed Company Information
- 8.54.2 Lifemed Business Overview
- 8.54.3 Lifemed Patient Monitor Sales, Value and Gross Margin (2021-2026)
- 8.54.4 Lifemed Patient Monitor Product Portfolio
- 8.54.5 Lifemed Recent Developments
- 8.55 Alfa Med Sistemas Médicos
- 8.55.1 Alfa Med Sistemas Médicos Company Information
- 8.55.2 Alfa Med Sistemas Médicos Business Overview
- 8.55.3 Alfa Med Sistemas Médicos Patient Monitor Sales, Value and Gross Margin (2021-2026)
- 8.55.4 Alfa Med Sistemas Médicos Patient Monitor Product Portfolio
- 8.55.5 Alfa Med Sistemas Médicos Recent Developments
- 8.56 Instramed
- 8.56.1 Instramed Company Information
- 8.56.2 Instramed Business Overview
- 8.56.3 Instramed Patient Monitor Sales, Value and Gross Margin (2021-2026)
- 8.56.4 Instramed Patient Monitor Product Portfolio
- 8.56.5 Instramed Recent Developments
- 8.57 Huntleigh Healthcare (Arjo)
- 8.57.1 Huntleigh Healthcare (Arjo) Company Information
- 8.57.2 Huntleigh Healthcare (Arjo) Business Overview
- 8.57.3 Huntleigh Healthcare (Arjo) Patient Monitor Sales, Value and Gross Margin (2021-2026)
- 8.57.4 Huntleigh Healthcare (Arjo) Patient Monitor Product Portfolio
- 8.57.5 Huntleigh Healthcare (Arjo) Recent Developments
- 8.58 iRhythm (VitalConnect)
- 8.58.1 iRhythm (VitalConnect) Company Information
- 8.58.2 iRhythm (VitalConnect) Business Overview
- 8.58.3 iRhythm (VitalConnect) Patient Monitor Sales, Value and Gross Margin (2021-2026)
- 8.58.4 iRhythm (VitalConnect) Patient Monitor Product Portfolio
- 8.58.5 iRhythm (VitalConnect) Recent Developments
- 8.59 BioIntelliSense
- 8.59.1 BioIntelliSense Company Information
- 8.59.2 BioIntelliSense Business Overview
- 8.59.3 BioIntelliSense Patient Monitor Sales, Value and Gross Margin (2021-2026)
- 8.59.4 BioIntelliSense Patient Monitor Product Portfolio
- 8.59.5 BioIntelliSense Recent Developments
- 8.60 Murata Manufacturing (Vios)
- 8.60.1 Murata Manufacturing (Vios) Company Information
- 8.60.2 Murata Manufacturing (Vios) Business Overview
- 8.60.3 Murata Manufacturing (Vios) Patient Monitor Sales, Value and Gross Margin (2021-2026)
- 8.60.4 Murata Manufacturing (Vios) Patient Monitor Product Portfolio
- 8.60.5 Murata Manufacturing (Vios) Recent Developments
9 Value Chain and Sales Channels Analysis
- 9.1 Patient Monitor Value Chain Analysis
- 9.1.1 Patient Monitor Key Raw Materials
- 9.1.2 Raw Materials Key Suppliers
- 9.1.3 Manufacturing Cost Structure
- 9.1.4 Patient Monitor Sales Mode & Process
- 9.2 Patient Monitor Sales Channels Analysis
- 9.2.1 Direct Comparison with Distribution Share
- 9.2.2 Patient Monitor Distributors
- 9.2.3 Patient Monitor Customers
10 Concluding Insights
11 Appendix
- 11.1 Reasons for Doing This Study
- 11.2 Research Methodology
- 11.3 Research Process
- 11.4 Authors List of This Report
- 11.5 Data Source
- 11.5.1 Secondary Sources
- 11.5.2 Primary Sources
GET THE RESEARCH
Choose your license.
PDF by email within 3–5 working days after payment confirmation.
Talk to an analyst