
Global Automotive Top Mount Market by Size, by Type, by Application, by Region, History and Forecast 2021-2032
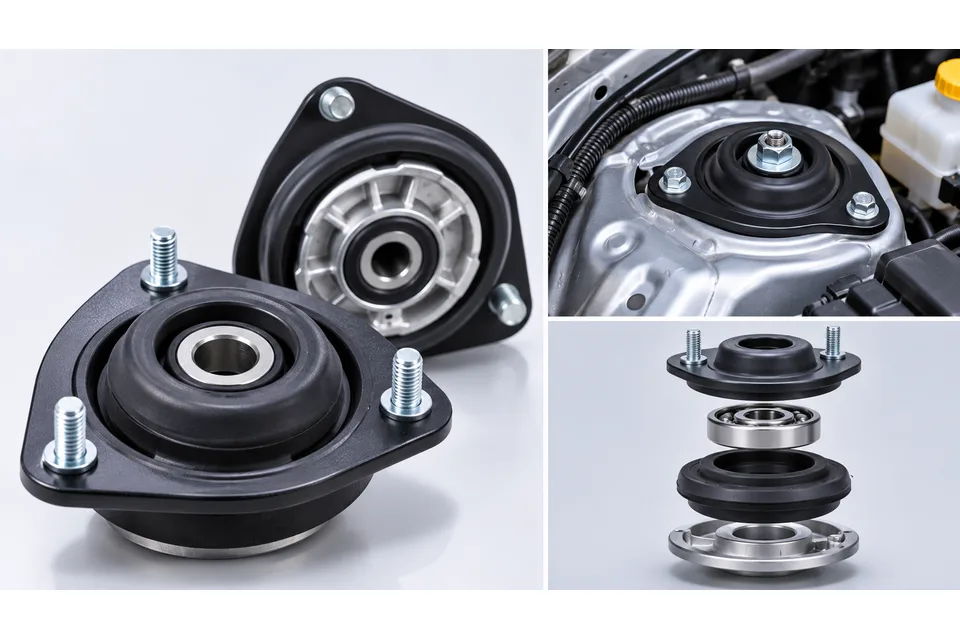
Automotive Top Mount refers to the upper suspension mounting assembly that connects a vehicle's shock absorber or suspension strut to the body structure, providing a defined mechanical load path while controlling the transmission of vibration, impact forces, and structure borne noise between the suspension and chassis. The assembly typically consists of an elastomeric isolating element bonded to stamped steel, aluminum, or reinforced polymer components, together with mounting plates, fastening elements, and application dependent bearing or spring support structures. Natural rubber, synthetic elastomers, polyurethane, and microcellular polyurethane are employed according to the required combination of static stiffness, dynamic stiffness, damping, fatigue resistance, and environmental durability. The fundamental isolation mechanism arises from the elastic deformation and viscoelastic energy dissipation of the polymer element under compression, shear, and combined loading. Rubber compound properties, element geometry, bonding interfaces, and structural constraints determine the relationship between applied force and displacement, the frequency dependent dynamic stiffness, and the energy dissipated during cyclic deformation. Lower dynamic stiffness can reduce the transmission of small amplitude road excitation, while sufficient structural rigidity and controlled deformation are required to maintain suspension geometry, transmit damper reaction forces, and resist high amplitude impacts. The resulting mechanical behavior depends on the interaction of elastomer modulus, preload, deformation amplitude, excitation frequency, temperature, and material aging.
In MacPherson strut suspensions, the upper mount participates in the transmission of suspension loads to the vehicle body and may incorporate a rolling or sliding bearing that permits the strut and associated spring components to rotate during steering while carrying axial and radial loads. Bearing friction, rotational clearance, axial stiffness, and radial compliance influence steering effort, returnability, wheel alignment stability, and noise generation. Rear shock absorber mounts and upper mounts used in suspension architectures without strut rotation generally employ simpler elastomeric support structures without steering bearings. Depending on suspension geometry, the mount transfers damper forces alone or a combination of damper reactions, spring loads, and lateral suspension forces. Commercial configurations include conventional rubber bonded metal mounts, polymer housing mounts, polyurethane mounts, and integrated assemblies incorporating bearings, spring seats, jounce bumpers, or protective components. Single, double, and multiple load path arrangements permit different suspension force components to be transmitted through elastomeric elements with distinct stiffness characteristics. The relevant engineering parameters include axial and radial stiffness, dynamic stiffness variation with frequency, damping loss characteristics, load capacity, fatigue behavior, permanent deformation, structural resonance, and resistance to temperature, moisture, oils, and road contaminants. Automotive Top Mount products encompass complete upper shock absorber and strut mounting assemblies supplied to vehicle manufacturers and the replacement parts market. Independently supplied shock absorbers, suspension springs, standalone bearings, spring isolators, jounce bumpers, dust boots, and general suspension bushings remain separate component categories.
Product & engineering
Understand the product.
Automotive Top Mount refers to the upper suspension mounting assembly that connects a vehicle's shock absorber or suspension strut to the body structure, providing a defined mechanical load path while controlling the transmission of vibration, impact forces, and structure borne noise between the suspension and chassis. The assembly typically consists of an elastomeric isolating element bonded to stamped steel, aluminum, or reinforced polymer components, together with mounting plates, fastening elements, and application dependent bearing or spring support structures. Natural rubber, synthetic elastomers, polyurethane, and microcellular polyurethane are employed according to the required combination of static stiffness, dynamic stiffness, damping, fatigue resistance, and environmental durability. The fundamental isolation mechanism arises from the elastic deformation and viscoelastic energy dissipation of the polymer element under compression, shear, and combined loading. Rubber compound properties, element geometry, bonding interfaces, and structural constraints determine the relationship between applied force and displacement, the frequency dependent dynamic stiffness, and the energy dissipated during cyclic deformation. Lower dynamic stiffness can reduce the transmission of small amplitude road excitation, while sufficient structural rigidity and controlled deformation are required to maintain suspension geometry, transmit damper reaction forces, and resist high amplitude impacts. The resulting mechanical behavior depends on the interaction of elastomer modulus, preload, deformation amplitude, excitation frequency, temperature, and material aging.
In MacPherson strut suspensions, the upper mount participates in the transmission of suspension loads to the vehicle body and may incorporate a rolling or sliding bearing that permits the strut and associated spring components to rotate during steering while carrying axial and radial loads. Bearing friction, rotational clearance, axial stiffness, and radial compliance influence steering effort, returnability, wheel alignment stability, and noise generation. Rear shock absorber mounts and upper mounts used in suspension architectures without strut rotation generally employ simpler elastomeric support structures without steering bearings. Depending on suspension geometry, the mount transfers damper forces alone or a combination of damper reactions, spring loads, and lateral suspension forces. Commercial configurations include conventional rubber bonded metal mounts, polymer housing mounts, polyurethane mounts, and integrated assemblies incorporating bearings, spring seats, jounce bumpers, or protective components. Single, double, and multiple load path arrangements permit different suspension force components to be transmitted through elastomeric elements with distinct stiffness characteristics. The relevant engineering parameters include axial and radial stiffness, dynamic stiffness variation with frequency, damping loss characteristics, load capacity, fatigue behavior, permanent deformation, structural resonance, and resistance to temperature, moisture, oils, and road contaminants. Automotive Top Mount products encompass complete upper shock absorber and strut mounting assemblies supplied to vehicle manufacturers and the replacement parts market. Independently supplied shock absorbers, suspension springs, standalone bearings, spring isolators, jounce bumpers, dust boots, and general suspension bushings remain separate component categories.
Selected research
Market Structure
Global Automotive Top Mount Market by Size, by Type, by Application, by Region, History and Forecast 2021-2032
MARKET AT A GLANCE
Scale & outlook
- 2025
- ≈ 3,090USD million
- 2032
- 4,320USD million
Select a bar to inspect its value.
Source: APO Research, Inc.
Market perspective
According to APO Research, Inc, the global Automotive Top Mount market was valued at approximately USD 3.09 billion in 2025 and is estimated to reach USD 3.21 billion in 2026 and USD 4.32 billion by 2032, representing a compound annual growth rate of 5.07% from 2026 to 2032. Global shipments of complete top mount assemblies are estimated at approximately 420 million units in 2025, increasing to 425 million units in 2026 and 497 million units by 2032. The corresponding weighted average manufacturer selling prices are approximately USD 7.36, USD 7.55, and USD 8.69 per unit. Revenue expansion is attributable to higher original equipment requirements, replacement demand from the existing vehicle population, and changes in the value of suspension mounting assemblies. Front suspension top mounts generally command higher unit values where strut bearings, spring seats, reinforced housings, and complex elastomeric structures are incorporated, while rear shock absorber mounts frequently employ simpler load bearing and isolation arrangements. The projected 16.9% increase in unit shipments between 2026 and 2032, together with an approximately 15.1% increase in average selling price, accounts for the forecast revenue expansion. Product configuration, regional sourcing costs, and the balance between original equipment and replacement sales determine the realized average selling price.
Global original equipment demand is directly associated with passenger car and light commercial vehicle production, subject to differences in suspension architecture and the number of upper mounting assemblies installed per vehicle. OICA reported worldwide motor vehicle production of approximately 96.4 million units in 2025, including 59.2 million vehicles manufactured in Asia Pacific, representing more than 61% of global output. China produced 34.53 million vehicles, including 16.63 million new energy vehicles, while Indian vehicle production reached approximately 6.49 million units. These manufacturing volumes establish China and India as major sources of incremental suspension component demand, with Chinese suppliers benefiting from domestic vehicle programs and local sourcing requirements. Vehicle electrification also changes suspension engineering requirements through differences in vehicle mass distribution, chassis configuration, vibration characteristics, and ride comfort specifications. Higher suspension loads and demanding noise isolation requirements can increase the engineering content of top mounts, particularly where manufacturers adopt reinforced housings, optimized elastomer structures, or polyurethane materials. European vehicle production remained approximately 17.2 million units in 2025, declining 0.8%, making replacement demand and product value changes more significant components of market development in established European manufacturing regions.
Shanghai Carthane provides evidence of the manufacturing capacity and customer nomination requirements associated with suspension top mount commercialization. In its February 2025 securities filing, the company disclosed existing annual polyurethane top mount capacity of 3.44 million units and a proposed expansion of another 4 million units. Its 45 customer nominated programs with explicit production forecasts indicated potential demand of 4.49 million units in 2026, subject to individual vehicle production schedules. The company's 2025 interim report also confirmed commercial deliveries of polyurethane top mounts for continuously controlled damping shock absorbers. These developments demonstrate the importance of vehicle program qualification, production capacity commitments, and material formulation in securing automotive suspension component business. Vibracoustic's commercial top mount range includes conventional rubber, polyurethane, and integrated assemblies with spring aids or jounce bumpers, as well as configurations with separate load paths. Such architectures permit different suspension force components to be managed through tailored elastomer characteristics, affecting component complexity, manufacturing cost, and the value assigned to the complete mounting assembly.
Full market overview
Replacement demand provides a separate revenue source whose timing is associated with vehicle age, suspension wear, and shock absorber maintenance. S&P Global Mobility reported that the average age of light vehicles in the United States reached 12.8 years in 2025, while the European Automobile Manufacturers' Association reported an average passenger car age of 12.5 years in the European Union for 2023. Prolonged exposure to cyclic suspension loads, temperature changes, moisture, and road contaminants can alter elastomer stiffness, increase permanent deformation, and accelerate deterioration of integrated bearings. ZF recommends replacing suspension strut mounts during shock absorber replacement, reflecting the mechanical relationship between mount condition, suspension noise, and wheel guidance. Established vehicle populations in North America and Europe therefore provide recurring demand for complete replacement mounts across a broad range of vehicle models and service ages. Manufacturers supplying these channels require extensive vehicle specific product coverage and regional distribution capabilities, while original equipment programs remain closely tied to automaker production schedules. Through 2032, market revenue is expected to increase through moderate growth in vehicle production, continuing replacement requirements, and a higher proportion of integrated and application specific mounting assemblies, with steel, aluminum, elastomer formulations, and manufacturing productivity remaining important determinants of unit cost.
The report provides an overview of the global Automotive Top Mount market in terms of capacity, output, revenue, and price, analyzing global market trends using historical revenue and sales data for 2021-2025, estimates for 2026, and projected CAGRs through 2032.
The study covers key producers of Automotive Top Mount and consumption patterns in major regions and countries, assesses future market potential, and highlights priority regions and countries for segmenting the market into sub-sectors, with country-specific market value data for the U.S., Canada, Mexico, Brazil, China, Japan, South Korea, Southeast Asia, India, Germany, the U.K., Italy, the Middle East, Africa, and other countries.
The report also presents Automotive Top Mount sales, revenue, market share, and industry ranking for the main manufacturers for 2021-2026, identifies the major stakeholders in the global market, and analyzes their competitive landscape and market positioning based on recent developments and segmental revenues.
In addition, the report analyzes segment data by Type and application—covering sales, revenue, and price—for 2021-2032, and evaluates and forecasts the Automotive Top Mount market size, projected growth trends, production technologies, key applications, and end-use industries.
Automotive Top Mount Segment by Company
- Vibracoustic
- Sumitomo Riko
- Hutchinson
- BOGE Rubber & Plastics
- Zhongding Group
- Tenneco
- BASF
- Tuopu Group
- Toyo Tire
- Kinugawa Rubber
- Marugo Rubber Industries
- Molten
- Shanghai Kaizhong
- Haida Rubber & Plastic
- Sidem
- Talbros Marugo Rubber
- Rubber Intertrade
- High Link Auto Parts
- Zhejiang Zhongding Auto Parts
Automotive Top Mount Segment by Type
- Front Top Mounts
- Rear Top Mounts
Automotive Top Mount Segment by Application
- Passenger Cars
- Light Commercial Vehicles
Automotive Top Mount Segment by Region
- North America
- United States
- Canada
- Mexico
- Europe
- Germany
- France
- U.K.
- Italy
- Russia
- Spain
- Netherlands
- Switzerland
- Sweden
- Poland
- Asia-Pacific
- China
- Japan
- South Korea
- India
- Australia
- Taiwan
- Southeast Asia
- South America
- Brazil
- Argentina
- Chile
- Middle East & Africa
- Egypt
- South Africa
- Israel
- Türkiye
- GCC Countries
Study Objectives
- To analyze and research the global status and future forecast, involving, production, value, consumption, growth rate (CAGR), market share, historical and forecast.
- To present the key manufacturers, capacity, production, revenue, market share, and Recent Developments.
- To split the breakdown data by regions, type, manufacturers, and Application.
- To analyze the global and key regions market potential and advantage, opportunity and challenge, restraints, and risks.
- To identify significant trends, drivers, influence factors in global and regions.
- To analyze competitive developments such as expansions, agreements, new product launches, and acquisitions in the market.
Reasons to Buy This Report
- This report will help the readers to understand the competition within the industries and strategies for the competitive environment to enhance the potential profit. The report also focuses on the competitive landscape of the global Automotive Top Mount market, and introduces in detail the market share, industry ranking, competitor ecosystem, market performance, new product development, operation situation, expansion, and acquisition. etc. of the main players, which helps the readers to identify the main competitors and deeply understand the competition pattern of the market.
- This report will help stakeholders to understand the global industry status and trends of Automotive Top Mount and provides them with information on key market drivers, restraints, challenges, and opportunities.
- This report will help stakeholders to understand competitors better and gain more insights to strengthen their position in their businesses. The competitive landscape section includes the market share and rank (in volume and value), competitor ecosystem, new product development, expansion, and acquisition.
- This report stays updated with novel technology integration, features, and the latest developments in the market.
- This report helps stakeholders to gain insights into which regions to target globally.
- This report helps stakeholders to gain insights into the end-user perception concerning the adoption of Automotive Top Mount.
- This report helps stakeholders to identify some of the key players in the market and understand their valuable contribution.
Chapter Outline
- Chapter 1: Provides an overview of the Automotive Top Mount market, including product definition, global market growth prospects, production value, capacity, and average price forecasts (2021-2032).
- Chapter 2: Analysis key trends, drivers, challenges, and opportunities within the global Automotive Top Mount industry.
- Chapter 3: Detailed analysis of Automotive Top Mount market competition landscape. Including Automotive Top Mount manufacturers' output value, output and average price from 2021 to 2026, as well as competition analysis indicators such as origin, product type, application, merger and acquisition information, etc.
- Chapter 4: Provides the analysis of various market segments by Type, covering the market size and development potential of each market segment, to help readers find the blue ocean market in different market segments.
- Chapter 5: Provides the analysis of various market segments by Application, covering the market size and development potential of each market segment, to help readers find the blue ocean market in different downstream markets.
- Chapter 6: Provides profiles of key players, introducing the basic situation of the main companies in the market in detail, including product production/output, value, price, gross margin, product introduction, recent development, etc.
- Chapter 7: Production/Production Value of Automotive Top Mount by region. It provides a quantitative analysis of the market size and development potential of each region in the next six years.
- Chapter 8: Consumption of Automotive Top Mount in regional level and country level. It provides a quantitative analysis of the market size and development potential of each region and its main countries and introduces the market development, future development prospects, market space, and production of each country in the world.
- Chapter 9: Analysis of industrial chain, including the upstream and downstream of the industry.
- Chapter 10: Concluding Insights of the report.
More report detail
Tables and figures
List of Tables
- Table 1. Automotive Top Mount Industry Trends
- Table 2. Automotive Top Mount Industry Drivers
- Table 3. Automotive Top Mount Industry Opportunities and Challenges
- Table 4. Automotive Top Mount Industry Restraints
- Table 5. Global Automotive Top Mount Production Value by Manufacturers (US$ Million) & (2021-2026)
- Table 6. Global Automotive Top Mount Production Value Share by Manufacturers (2021-2026)
- Table 7. Global Automotive Top Mount Production by Manufacturers (k units) & (2021-2026)
- Table 8. Global Automotive Top Mount Production Market Share by Manufacturers
- Table 9. Global Automotive Top Mount Average Price (USD/unit) of Manufacturers (2021-2026)
- Table 10. Global Automotive Top Mount Industry Manufacturers Ranking, 2024 VS 2025 VS 2026
- Table 11. Global Automotive Top Mount Key Manufacturers Manufacturing Sites & Headquarters
- Table 12. Global Automotive Top Mount Manufacturers, Product Type & Application
- Table 13. Global Automotive Top Mount Manufacturers Established Date
- Table 14. Global Manufacturers Market Concentration Ratio (CR5 and HHI)
- Table 15. Global Automotive Top Mount by Manufacturers Type (Tier 1, Tier 2, and Tier 3) & (based on the Production Value of 2025)
- Table 16. Major Manufacturers of Front Top Mounts
- Table 17. Major Manufacturers of Rear Top Mounts
- Table 18. Global Automotive Top Mount Production by Type 2021 VS 2025 VS 2032 (k units)
- Table 19. Global Automotive Top Mount Production by Type (2021-2026) & (k units)
- Table 20. Global Automotive Top Mount Production by Type (2027-2032) & (k units)
- Table 21. Global Automotive Top Mount Production Market Share by Type (2021-2026)
- Table 22. Global Automotive Top Mount Production Market Share by Type (2027-2032)
- Table 23. Global Automotive Top Mount Production Value by Type 2021 VS 2025 VS 2032 (k units)
- Table 24. Global Automotive Top Mount Production Value by Type (2021-2026) & (k units)
- Table 25. Global Automotive Top Mount Production Value by Type (2027-2032) & (k units)
- Table 26. Global Automotive Top Mount Production Value Market Share by Type (2021-2026)
- Table 27. Global Automotive Top Mount Production Value Market Share by Type (2027-2032)
- Table 28. Major Manufacturers of Passenger Cars
- Table 29. Major Manufacturers of Light Commercial Vehicles
- Table 30. Global Automotive Top Mount Production by Application 2021 VS 2025 VS 2032 (k units)
- Table 31. Global Automotive Top Mount Production by Application (2021-2026) & (k units)
- Table 32. Global Automotive Top Mount Production by Application (2027-2032) & (k units)
- Table 33. Global Automotive Top Mount Production Market Share by Application (2021-2026)
- Table 34. Global Automotive Top Mount Production Market Share by Application (2027-2032)
- Table 35. Global Automotive Top Mount Production Value by Application 2021 VS 2025 VS 2032 (k units)
- Table 36. Global Automotive Top Mount Production Value by Application (2021-2026) & (k units)
- Table 37. Global Automotive Top Mount Production Value by Application (2027-2032) & (k units)
- Table 38. Global Automotive Top Mount Production Value Market Share by Application (2021-2026)
- Table 39. Global Automotive Top Mount Production Value Market Share by Application (2027-2032)
- Table 40. Vibracoustic Company Information
- Table 41. Vibracoustic Business Overview
- Table 42. Vibracoustic Automotive Top Mount Production (k units), Value (US$ Million), Price (USD/unit) and Gross Margin (2021-2026)
- Table 43. Vibracoustic Automotive Top Mount Product Portfolio
- Table 44. Vibracoustic Recent Development
- Table 45. Sumitomo Riko Company Information
- Table 46. Sumitomo Riko Business Overview
- Table 47. Sumitomo Riko Automotive Top Mount Production (k units), Value (US$ Million), Price (USD/unit) and Gross Margin (2021-2026)
- Table 48. Sumitomo Riko Automotive Top Mount Product Portfolio
- Table 49. Sumitomo Riko Recent Development
- Table 50. Hutchinson Company Information
- Table 51. Hutchinson Business Overview
- Table 52. Hutchinson Automotive Top Mount Production (k units), Value (US$ Million), Price (USD/unit) and Gross Margin (2021-2026)
- Table 53. Hutchinson Automotive Top Mount Product Portfolio
- Table 54. Hutchinson Recent Development
- Table 55. BOGE Rubber & Plastics Company Information
- Table 56. BOGE Rubber & Plastics Business Overview
- Table 57. BOGE Rubber & Plastics Automotive Top Mount Production (k units), Value (US$ Million), Price (USD/unit) and Gross Margin (2021-2026)
- Table 58. BOGE Rubber & Plastics Automotive Top Mount Product Portfolio
- Table 59. BOGE Rubber & Plastics Recent Development
- Table 60. Zhongding Group Company Information
- Table 61. Zhongding Group Business Overview
- Table 62. Zhongding Group Automotive Top Mount Production (k units), Value (US$ Million), Price (USD/unit) and Gross Margin (2021-2026)
- Table 63. Zhongding Group Automotive Top Mount Product Portfolio
- Table 64. Zhongding Group Recent Development
- Table 65. Tenneco Company Information
- Table 66. Tenneco Business Overview
- Table 67. Tenneco Automotive Top Mount Production (k units), Value (US$ Million), Price (USD/unit) and Gross Margin (2021-2026)
- Table 68. Tenneco Automotive Top Mount Product Portfolio
- Table 69. Tenneco Recent Development
- Table 70. BASF Company Information
- Table 71. BASF Business Overview
- Table 72. BASF Automotive Top Mount Production (k units), Value (US$ Million), Price (USD/unit) and Gross Margin (2021-2026)
- Table 73. BASF Automotive Top Mount Product Portfolio
- Table 74. BASF Recent Development
- Table 75. Tuopu Group Company Information
- Table 76. Tuopu Group Business Overview
- Table 77. Tuopu Group Automotive Top Mount Production (k units), Value (US$ Million), Price (USD/unit) and Gross Margin (2021-2026)
- Table 78. Tuopu Group Automotive Top Mount Product Portfolio
- Table 79. Tuopu Group Recent Development
- Table 80. Toyo Tire Company Information
- Table 81. Toyo Tire Business Overview
- Table 82. Toyo Tire Automotive Top Mount Production (k units), Value (US$ Million), Price (USD/unit) and Gross Margin (2021-2026)
- Table 83. Toyo Tire Automotive Top Mount Product Portfolio
- Table 84. Toyo Tire Recent Development
- Table 85. Kinugawa Rubber Company Information
- Table 86. Kinugawa Rubber Business Overview
- Table 87. Kinugawa Rubber Automotive Top Mount Production (k units), Value (US$ Million), Price (USD/unit) and Gross Margin (2021-2026)
- Table 88. Kinugawa Rubber Automotive Top Mount Product Portfolio
- Table 89. Kinugawa Rubber Recent Development
- Table 90. Marugo Rubber Industries Company Information
- Table 91. Marugo Rubber Industries Business Overview
- Table 92. Marugo Rubber Industries Automotive Top Mount Production (k units), Value (US$ Million), Price (USD/unit) and Gross Margin (2021-2026)
- Table 93. Marugo Rubber Industries Automotive Top Mount Product Portfolio
- Table 94. Marugo Rubber Industries Recent Development
- Table 95. Molten Company Information
- Table 96. Molten Business Overview
- Table 97. Molten Automotive Top Mount Production (k units), Value (US$ Million), Price (USD/unit) and Gross Margin (2021-2026)
- Table 98. Molten Automotive Top Mount Product Portfolio
- Table 99. Molten Recent Development
- Table 100. Shanghai Kaizhong Company Information
- Table 101. Shanghai Kaizhong Business Overview
- Table 102. Shanghai Kaizhong Automotive Top Mount Production (k units), Value (US$ Million), Price (USD/unit) and Gross Margin (2021-2026)
- Table 103. Shanghai Kaizhong Automotive Top Mount Product Portfolio
- Table 104. Shanghai Kaizhong Recent Development
- Table 105. Haida Rubber & Plastic Company Information
- Table 106. Haida Rubber & Plastic Business Overview
- Table 107. Haida Rubber & Plastic Automotive Top Mount Production (k units), Value (US$ Million), Price (USD/unit) and Gross Margin (2021-2026)
- Table 108. Haida Rubber & Plastic Automotive Top Mount Product Portfolio
- Table 109. Haida Rubber & Plastic Recent Development
- Table 110. Sidem Company Information
- Table 111. Sidem Business Overview
- Table 112. Sidem Automotive Top Mount Production (k units), Value (US$ Million), Price (USD/unit) and Gross Margin (2021-2026)
- Table 113. Sidem Automotive Top Mount Product Portfolio
- Table 114. Sidem Recent Development
- Table 115. Talbros Marugo Rubber Company Information
- Table 116. Talbros Marugo Rubber Business Overview
- Table 117. Talbros Marugo Rubber Automotive Top Mount Production (k units), Value (US$ Million), Price (USD/unit) and Gross Margin (2021-2026)
- Table 118. Talbros Marugo Rubber Automotive Top Mount Product Portfolio
- Table 119. Talbros Marugo Rubber Recent Development
- Table 120. Rubber Intertrade Company Information
- Table 121. Rubber Intertrade Business Overview
- Table 122. Rubber Intertrade Automotive Top Mount Production (k units), Value (US$ Million), Price (USD/unit) and Gross Margin (2021-2026)
- Table 123. Rubber Intertrade Automotive Top Mount Product Portfolio
- Table 124. Rubber Intertrade Recent Development
- Table 125. High Link Auto Parts Company Information
- Table 126. High Link Auto Parts Business Overview
- Table 127. High Link Auto Parts Automotive Top Mount Production (k units), Value (US$ Million), Price (USD/unit) and Gross Margin (2021-2026)
- Table 128. High Link Auto Parts Automotive Top Mount Product Portfolio
- Table 129. High Link Auto Parts Recent Development
- Table 130. Zhejiang Zhongding Auto Parts Company Information
- Table 131. Zhejiang Zhongding Auto Parts Business Overview
- Table 132. Zhejiang Zhongding Auto Parts Automotive Top Mount Production (k units), Value (US$ Million), Price (USD/unit) and Gross Margin (2021-2026)
- Table 133. Zhejiang Zhongding Auto Parts Automotive Top Mount Product Portfolio
- Table 134. Zhejiang Zhongding Auto Parts Recent Development
- Table 135. Global Automotive Top Mount Production by Region: 2021 VS 2025 VS 2032 (k units)
- Table 136. Global Automotive Top Mount Production by Region (2021-2026) & (k units)
- Table 137. Global Automotive Top Mount Production Market Share by Region (2021-2026)
- Table 138. Global Automotive Top Mount Production Forecast by Region (2027-2032) & (k units)
- Table 139. Global Automotive Top Mount Production Market Share Forecast by Region (2027-2032)
- Table 140. Global Automotive Top Mount Production Value Comparison by Region: 2021 VS 2025 VS 2032 (US$ Million)
- Table 141. Global Automotive Top Mount Production Value by Region (2021-2026) & (US$ Million)
- Table 142. Global Automotive Top Mount Production Value Share by Region (2021-2026)
- Table 143. Global Automotive Top Mount Production Value by Region (2027-2032) & (US$ Million)
- Table 144. Global Automotive Top Mount Production Value Share by Region: (2027-2032) & (US$ Million)
- Table 145. Global Automotive Top Mount Market Average Price (USD/unit) by Region (2021-2026)
- Table 146. Global Automotive Top Mount Market Average Price (USD/unit) by Region (2027-2032)
- Table 147. Global Automotive Top Mount Consumption by Region: 2021 VS 2025 VS 2032 (k units)
- Table 148. Global Automotive Top Mount Consumption by Region (2021-2026) & (k units)
- Table 149. Global Automotive Top Mount Consumption Market Share by Region (2021-2026)
- Table 150. Global Automotive Top Mount Consumption Forecasted by Region (2027-2032) & (k units)
- Table 151. Global Automotive Top Mount Consumption Forecasted Market Share by Region (2027-2032)
- Table 152. North America Automotive Top Mount Consumption Growth Rate by Country: 2021 VS 2025 VS 2032 (k units)
- Table 153. North America Automotive Top Mount Consumption by Country (2021-2026) & (k units)
- Table 154. North America Automotive Top Mount Consumption by Country (2027-2032) & (k units)
- Table 155. Europe Automotive Top Mount Consumption Growth Rate by Country: 2021 VS 2025 VS 2032 (k units)
- Table 156. Europe Automotive Top Mount Consumption by Country (2021-2026) & (k units)
- Table 157. Europe Automotive Top Mount Consumption by Country (2027-2032) & (k units)
- Table 158. Asia Pacific Automotive Top Mount Consumption Growth Rate by Country: 2021 VS 2025 VS 2032 (k units)
- Table 159. Asia Pacific Automotive Top Mount Consumption by Country (2021-2026) & (k units)
- Table 160. Asia Pacific Automotive Top Mount Consumption by Country (2027-2032) & (k units)
- Table 161. South America Automotive Top Mount Consumption Growth Rate by Country: 2021 VS 2025 VS 2032 (k units)
- Table 162. South America Automotive Top Mount Consumption by Country (2021-2026) & (k units)
- Table 163. South America Automotive Top Mount Consumption by Country (2027-2032) & (k units)
- Table 164. Middle East & Africa Automotive Top Mount Consumption Growth Rate by Country: 2021 VS 2025 VS 2032 (k units)
- Table 165. Middle East & Africa Automotive Top Mount Consumption by Country (2021-2026) & (k units)
- Table 166. Middle East & Africa Automotive Top Mount Consumption by Country (2027-2032) & (k units)
- Table 167. Key Raw Materials
- Table 168. Raw Materials Key Suppliers
- Table 169. Automotive Top Mount Distributors List
- Table 170. Automotive Top Mount Customers List
- Table 171. Research Programs/Design for This Report
- Table 172. Authors List of This Report
- Table 173. Secondary Sources
- Table 174. Primary Sources
List of Figures
- Figure 1. Automotive Top Mount Product Image
- Figure 2. Global Automotive Top Mount Production Value (US$ Million), 2021 VS 2025 VS 2032
- Figure 3. Global Automotive Top Mount Production Value (2021-2032) & (US$ Million)
- Figure 4. Global Automotive Top Mount Production Capacity (2021-2032) & (k units)
- Figure 5. Global Automotive Top Mount Production (2021-2032) & (k units)
- Figure 6. Global Automotive Top Mount Average Price (USD/unit) & (2021-2032)
- Figure 7. Global Top 5 and 10 Automotive Top Mount Players Market Share by Production Value in 2025
- Figure 8. Manufacturers Type (Tier 1, Tier 2, and Tier 3): 2021 VS 2025
- Figure 9. Front Top Mounts Image
- Figure 10. Rear Top Mounts Image
- Figure 11. Global Automotive Top Mount Production by Type (2021 VS 2025 VS 2032) & (k units)
- Figure 12. Global Automotive Top Mount Production Market Share 2021 VS 2025 VS 2032
- Figure 13. Global Automotive Top Mount Production Market Share by Type (2021-2032)
- Figure 14. Global Automotive Top Mount Production Value by Type (2021 VS 2025 VS 2032) & (k units)
- Figure 15. Global Automotive Top Mount Production Value Share 2021 VS 2025 VS 2032
- Figure 16. Global Automotive Top Mount Production Value Share by Type (2021-2032)
- Figure 17. Passenger Cars Image
- Figure 18. Light Commercial Vehicles Image
- Figure 19. Global Automotive Top Mount Production by Application (2021 VS 2025 VS 2032) & (k units)
- Figure 20. Global Automotive Top Mount Production Market Share 2021 VS 2025 VS 2032
- Figure 21. Global Automotive Top Mount Production Market Share by Application (2021-2032)
- Figure 22. Global Automotive Top Mount Production Value by Application (2021 VS 2025 VS 2032) & (k units)
- Figure 23. Global Automotive Top Mount Production Value Share 2021 VS 2025 VS 2032
- Figure 24. Global Automotive Top Mount Production Value Share by Application (2021-2032)
- Figure 25. Global Automotive Top Mount Production by Region: 2021 VS 2025 VS 2032 (k units)
- Figure 26. Global Automotive Top Mount Production Market Share by Region: 2021 VS 2025 VS 2032
- Figure 27. Global Automotive Top Mount Production Value Comparison by Region: 2021 VS 2025 VS 2032 (US$ Million)
- Figure 28. Global Automotive Top Mount Production Value Share by Region: 2021 VS 2025 VS 2032
- Figure 29. North America Automotive Top Mount Production Value (2021-2032) & (US$ Million)
- Figure 30. Europe Automotive Top Mount Production Value (2021-2032) & (US$ Million)
- Figure 31. Asia-Pacific Automotive Top Mount Production Value (2021-2032) & (US$ Million)
- Figure 32. South America Automotive Top Mount Production Value (2021-2032) & (US$ Million)
- Figure 33. Middle East & Africa Automotive Top Mount Production Value (2021-2032) & (US$ Million)
- Figure 34. North America Automotive Top Mount Consumption and Growth Rate (2021-2032) & (k units)
- Figure 35. North America Automotive Top Mount Consumption Market Share by Country (2021-2032)
- Figure 36. U.S. Automotive Top Mount Consumption and Growth Rate (2021-2032) & (k units)
- Figure 37. Canada Automotive Top Mount Consumption and Growth Rate (2021-2032) & (k units)
- Figure 38. Mexico Automotive Top Mount Consumption and Growth Rate (2021-2032) & (k units)
- Figure 39. Europe Automotive Top Mount Consumption and Growth Rate (2021-2032) & (k units)
- Figure 40. Europe Automotive Top Mount Consumption Market Share by Country (2021-2032)
- Figure 41. Germany Automotive Top Mount Consumption and Growth Rate (2021-2032) & (k units)
- Figure 42. France Automotive Top Mount Consumption and Growth Rate (2021-2032) & (k units)
- Figure 43. U.K. Automotive Top Mount Consumption and Growth Rate (2021-2032) & (k units)
- Figure 44. Italy Automotive Top Mount Consumption and Growth Rate (2021-2032) & (k units)
- Figure 45. Netherlands Automotive Top Mount Consumption and Growth Rate (2021-2032) & (k units)
- Figure 46. Asia Pacific Automotive Top Mount Consumption and Growth Rate (2021-2032) & (k units)
- Figure 47. Asia Pacific Automotive Top Mount Consumption Market Share by Country (2021-2032)
- Figure 48. China Automotive Top Mount Consumption and Growth Rate (2021-2032) & (k units)
- Figure 49. Japan Automotive Top Mount Consumption and Growth Rate (2021-2032) & (k units)
- Figure 50. South Korea Automotive Top Mount Consumption and Growth Rate (2021-2032) & (k units)
- Figure 51. Southeast Asia Automotive Top Mount Consumption and Growth Rate (2021-2032) & (k units)
- Figure 52. India Automotive Top Mount Consumption and Growth Rate (2021-2032) & (k units)
- Figure 53. Australia Automotive Top Mount Consumption and Growth Rate (2021-2032) & (k units)
- Figure 54. South America Automotive Top Mount Consumption and Growth Rate (2021-2032) & (k units)
- Figure 55. South America Automotive Top Mount Consumption Market Share by Country (2021-2032)
- Figure 56. Brazil Automotive Top Mount Consumption and Growth Rate (2021-2032) & (k units)
- Figure 57. Argentina Automotive Top Mount Consumption and Growth Rate (2021-2032) & (k units)
- Figure 58. Chile Automotive Top Mount Consumption and Growth Rate (2021-2032) & (k units)
- Figure 59. Middle East & Africa Automotive Top Mount Consumption and Growth Rate (2021-2032) & (k units)
- Figure 60. Middle East & Africa Automotive Top Mount Consumption Market Share by Country (2021-2032)
- Figure 61. Egypt Automotive Top Mount Consumption and Growth Rate (2021-2032) & (k units)
- Figure 62. South Africa Automotive Top Mount Consumption and Growth Rate (2021-2032) & (k units)
- Figure 63. Israel Automotive Top Mount Consumption and Growth Rate (2021-2032) & (k units)
- Figure 64. Türkiye Automotive Top Mount Consumption and Growth Rate (2021-2032) & (k units)
- Figure 65. GCC Countries Automotive Top Mount Consumption and Growth Rate (2021-2032) & (k units)
- Figure 66. Automotive Top Mount Value Chain
- Figure 67. Manufacturing Cost Structure
- Figure 68. Automotive Top Mount Production Mode & Process
- Figure 69. Direct Comparison with Distribution Share
- Figure 70. Distributors Profiles
- Figure 71. Years Considered
- Figure 72. Research Process
- Figure 73. Key Executives Interviewed
Scope & coverage.
By Type
- Front Top Mounts
- Rear Top Mounts
By Application
- Passenger Cars
- Light Commercial Vehicles
Companies covered
- Vibracoustic
- Sumitomo Riko
- Hutchinson
- BOGE Rubber & Plastics
- Zhongding Group
- Tenneco
- BASF
- Tuopu Group
- Toyo Tire
- Kinugawa Rubber
- Marugo Rubber Industries
- Molten
- Shanghai Kaizhong
- Haida Rubber & Plastic
- Sidem
- Talbros Marugo Rubber
- Rubber Intertrade
- High Link Auto Parts
- Zhejiang Zhongding Auto Parts
Inside the report.
1 Market Overview
- 1.1 Product Definition
- 1.2 Global Market Growth Prospects
- 1.2.1 Global Automotive Top Mount Production Value Estimates and Forecasts (2021-2032)
- 1.2.2 Global Automotive Top Mount Production Capacity Estimates and Forecasts (2021-2032)
- 1.2.3 Global Automotive Top Mount Production Estimates and Forecasts (2021-2032)
- 1.2.4 Global Automotive Top Mount Market Average Price (2021-2032)
- 1.3 Assumptions and Limitations
- 1.4 Study Goals and Objectives
2 Global Automotive Top Mount Market Dynamics
- 2.1 Automotive Top Mount Industry Trends
- 2.2 Automotive Top Mount Industry Drivers
- 2.3 Automotive Top Mount Industry Opportunities and Challenges
- 2.4 Automotive Top Mount Industry Restraints
3 Automotive Top Mount Market by Manufacturers
- 3.1 Global Automotive Top Mount Production Value by Manufacturers (2021-2026)
- 3.2 Global Automotive Top Mount Production by Manufacturers (2021-2026)
- 3.3 Global Automotive Top Mount Average Price by Manufacturers (2021-2026)
- 3.4 Global Automotive Top Mount Industry Manufacturers Ranking, 2024 VS 2025 VS 2026
- 3.5 Global Automotive Top Mount Key Manufacturers Manufacturing Sites & Headquarters
- 3.6 Global Automotive Top Mount Manufacturers, Product Type & Application
- 3.7 Global Automotive Top Mount Manufacturers Established Date
- 3.8 Market Competitive Analysis
- 3.8.1 Global Automotive Top Mount Market CR5 and HHI
- 3.8.2 Global Top 5 and 10 Automotive Top Mount Players Market Share by Production Value in 2025
- 3.8.3 2025 Automotive Top Mount Tier 1, Tier 2, and Tier 3
4 Automotive Top Mount Market by Type
- 4.1 Automotive Top Mount Type Introduction
- 4.1.1 Front Top Mounts
- 4.1.2 Rear Top Mounts
- 4.2 Global Automotive Top Mount Production by Type
- 4.2.1 Global Automotive Top Mount Production by Type (2021 VS 2025 VS 2032)
- 4.2.2 Global Automotive Top Mount Production by Type (2021-2032)
- 4.2.3 Global Automotive Top Mount Production Market Share by Type (2021-2032)
- 4.3 Global Automotive Top Mount Production Value by Type
- 4.3.1 Global Automotive Top Mount Production Value by Type (2021 VS 2025 VS 2032)
- 4.3.2 Global Automotive Top Mount Production Value by Type (2021-2032)
- 4.3.3 Global Automotive Top Mount Production Value Market Share by Type (2021-2032)
5 Automotive Top Mount Market by Application
- 5.1 Automotive Top Mount Application Introduction
- 5.1.1 Passenger Cars
- 5.1.2 Light Commercial Vehicles
- 5.2 Global Automotive Top Mount Production by Application
- 5.2.1 Global Automotive Top Mount Production by Application (2021 VS 2025 VS 2032)
- 5.2.2 Global Automotive Top Mount Production by Application (2021-2032)
- 5.2.3 Global Automotive Top Mount Production Market Share by Application (2021-2032)
- 5.3 Global Automotive Top Mount Production Value by Application
- 5.3.1 Global Automotive Top Mount Production Value by Application (2021 VS 2025 VS 2032)
- 5.3.2 Global Automotive Top Mount Production Value by Application (2021-2032)
- 5.3.3 Global Automotive Top Mount Production Value Market Share by Application (2021-2032)
6 Company Profiles
- 6.1 Vibracoustic
- 6.1.1 Vibracoustic Company Information
- 6.1.2 Vibracoustic Business Overview
- 6.1.3 Vibracoustic Automotive Top Mount Production, Value and Gross Margin (2021-2026)
- 6.1.4 Vibracoustic Automotive Top Mount Product Portfolio
- 6.1.5 Vibracoustic Recent Developments
- 6.2 Sumitomo Riko
- 6.2.1 Sumitomo Riko Company Information
- 6.2.2 Sumitomo Riko Business Overview
- 6.2.3 Sumitomo Riko Automotive Top Mount Production, Value and Gross Margin (2021-2026)
- 6.2.4 Sumitomo Riko Automotive Top Mount Product Portfolio
- 6.2.5 Sumitomo Riko Recent Developments
- 6.3 Hutchinson
- 6.3.1 Hutchinson Company Information
- 6.3.2 Hutchinson Business Overview
- 6.3.3 Hutchinson Automotive Top Mount Production, Value and Gross Margin (2021-2026)
- 6.3.4 Hutchinson Automotive Top Mount Product Portfolio
- 6.3.5 Hutchinson Recent Developments
- 6.4 BOGE Rubber & Plastics
- 6.4.1 BOGE Rubber & Plastics Company Information
- 6.4.2 BOGE Rubber & Plastics Business Overview
- 6.4.3 BOGE Rubber & Plastics Automotive Top Mount Production, Value and Gross Margin (2021-2026)
- 6.4.4 BOGE Rubber & Plastics Automotive Top Mount Product Portfolio
- 6.4.5 BOGE Rubber & Plastics Recent Developments
- 6.5 Zhongding Group
- 6.5.1 Zhongding Group Company Information
- 6.5.2 Zhongding Group Business Overview
- 6.5.3 Zhongding Group Automotive Top Mount Production, Value and Gross Margin (2021-2026)
- 6.5.4 Zhongding Group Automotive Top Mount Product Portfolio
- 6.5.5 Zhongding Group Recent Developments
- 6.6 Tenneco
- 6.6.1 Tenneco Company Information
- 6.6.2 Tenneco Business Overview
- 6.6.3 Tenneco Automotive Top Mount Production, Value and Gross Margin (2021-2026)
- 6.6.4 Tenneco Automotive Top Mount Product Portfolio
- 6.6.5 Tenneco Recent Developments
- 6.7 BASF
- 6.7.1 BASF Company Information
- 6.7.2 BASF Business Overview
- 6.7.3 BASF Automotive Top Mount Production, Value and Gross Margin (2021-2026)
- 6.7.4 BASF Automotive Top Mount Product Portfolio
- 6.7.5 BASF Recent Developments
- 6.8 Tuopu Group
- 6.8.1 Tuopu Group Company Information
- 6.8.2 Tuopu Group Business Overview
- 6.8.3 Tuopu Group Automotive Top Mount Production, Value and Gross Margin (2021-2026)
- 6.8.4 Tuopu Group Automotive Top Mount Product Portfolio
- 6.8.5 Tuopu Group Recent Developments
- 6.9 Toyo Tire
- 6.9.1 Toyo Tire Company Information
- 6.9.2 Toyo Tire Business Overview
- 6.9.3 Toyo Tire Automotive Top Mount Production, Value and Gross Margin (2021-2026)
- 6.9.4 Toyo Tire Automotive Top Mount Product Portfolio
- 6.9.5 Toyo Tire Recent Developments
- 6.10 Kinugawa Rubber
- 6.10.1 Kinugawa Rubber Company Information
- 6.10.2 Kinugawa Rubber Business Overview
- 6.10.3 Kinugawa Rubber Automotive Top Mount Production, Value and Gross Margin (2021-2026)
- 6.10.4 Kinugawa Rubber Automotive Top Mount Product Portfolio
- 6.10.5 Kinugawa Rubber Recent Developments
- 6.11 Marugo Rubber Industries
- 6.11.1 Marugo Rubber Industries Company Information
- 6.11.2 Marugo Rubber Industries Business Overview
- 6.11.3 Marugo Rubber Industries Automotive Top Mount Production, Value and Gross Margin (2021-2026)
- 6.11.4 Marugo Rubber Industries Automotive Top Mount Product Portfolio
- 6.11.5 Marugo Rubber Industries Recent Developments
- 6.12 Molten
- 6.12.1 Molten Company Information
- 6.12.2 Molten Business Overview
- 6.12.3 Molten Automotive Top Mount Production, Value and Gross Margin (2021-2026)
- 6.12.4 Molten Automotive Top Mount Product Portfolio
- 6.12.5 Molten Recent Developments
- 6.13 Shanghai Kaizhong
- 6.13.1 Shanghai Kaizhong Company Information
- 6.13.2 Shanghai Kaizhong Business Overview
- 6.13.3 Shanghai Kaizhong Automotive Top Mount Production, Value and Gross Margin (2021-2026)
- 6.13.4 Shanghai Kaizhong Automotive Top Mount Product Portfolio
- 6.13.5 Shanghai Kaizhong Recent Developments
- 6.14 Haida Rubber & Plastic
- 6.14.1 Haida Rubber & Plastic Company Information
- 6.14.2 Haida Rubber & Plastic Business Overview
- 6.14.3 Haida Rubber & Plastic Automotive Top Mount Production, Value and Gross Margin (2021-2026)
- 6.14.4 Haida Rubber & Plastic Automotive Top Mount Product Portfolio
- 6.14.5 Haida Rubber & Plastic Recent Developments
- 6.15 Sidem
- 6.15.1 Sidem Company Information
- 6.15.2 Sidem Business Overview
- 6.15.3 Sidem Automotive Top Mount Production, Value and Gross Margin (2021-2026)
- 6.15.4 Sidem Automotive Top Mount Product Portfolio
- 6.15.5 Sidem Recent Developments
- 6.16 Talbros Marugo Rubber
- 6.16.1 Talbros Marugo Rubber Company Information
- 6.16.2 Talbros Marugo Rubber Business Overview
- 6.16.3 Talbros Marugo Rubber Automotive Top Mount Production, Value and Gross Margin (2021-2026)
- 6.16.4 Talbros Marugo Rubber Automotive Top Mount Product Portfolio
- 6.16.5 Talbros Marugo Rubber Recent Developments
- 6.17 Rubber Intertrade
- 6.17.1 Rubber Intertrade Company Information
- 6.17.2 Rubber Intertrade Business Overview
- 6.17.3 Rubber Intertrade Automotive Top Mount Production, Value and Gross Margin (2021-2026)
- 6.17.4 Rubber Intertrade Automotive Top Mount Product Portfolio
- 6.17.5 Rubber Intertrade Recent Developments
- 6.18 High Link Auto Parts
- 6.18.1 High Link Auto Parts Company Information
- 6.18.2 High Link Auto Parts Business Overview
- 6.18.3 High Link Auto Parts Automotive Top Mount Production, Value and Gross Margin (2021-2026)
- 6.18.4 High Link Auto Parts Automotive Top Mount Product Portfolio
- 6.18.5 High Link Auto Parts Recent Developments
- 6.19 Zhejiang Zhongding Auto Parts
- 6.19.1 Zhejiang Zhongding Auto Parts Company Information
- 6.19.2 Zhejiang Zhongding Auto Parts Business Overview
- 6.19.3 Zhejiang Zhongding Auto Parts Automotive Top Mount Production, Value and Gross Margin (2021-2026)
- 6.19.4 Zhejiang Zhongding Auto Parts Automotive Top Mount Product Portfolio
- 6.19.5 Zhejiang Zhongding Auto Parts Recent Developments
7 Global Automotive Top Mount Production by Region
- 7.1 Global Automotive Top Mount Production by Region: 2021 VS 2025 VS 2032
- 7.2 Global Automotive Top Mount Production by Region (2021-2032)
- 7.2.1 Global Automotive Top Mount Production by Region (2021-2026)
- 7.2.2 Global Automotive Top Mount Production Forecast by Region (2027-2032)
- 7.3 Global Automotive Top Mount Production by Region: 2021 VS 2025 VS 2032
- 7.4 Global Automotive Top Mount Production Value by Region (2021-2032)
- 7.4.1 Global Automotive Top Mount Production Value by Region (2021-2026)
- 7.4.2 Global Automotive Top Mount Production Value by Region (2027-2032)
- 7.5 Global Automotive Top Mount Market Price Analysis by Region (2021-2032)
- 7.6 Regional Production Value Trends (2021-2032)
- 7.6.1 North America Automotive Top Mount Production Value (2021-2032)
- 7.6.2 Europe Automotive Top Mount Production Value (2021-2032)
- 7.6.3 Asia-Pacific Automotive Top Mount Production Value (2021-2032)
- 7.6.4 South America Automotive Top Mount Production Value (2021-2032)
- 7.6.5 Middle East & Africa Automotive Top Mount Production Value (2021-2032)
8 Global Automotive Top Mount Consumption by Region
- 8.1 Global Automotive Top Mount Consumption by Region: 2021 VS 2025 VS 2032
- 8.2 Global Automotive Top Mount Consumption by Region (2021-2032)
- 8.2.1 Global Automotive Top Mount Consumption by Region (2021-2026)
- 8.2.2 Global Automotive Top Mount Consumption by Region (2027-2032)
- 8.3 North America
- 8.3.1 North America Automotive Top Mount Consumption Growth Rate by Country: 2021 VS 2025 VS 2032
- 8.3.2 North America Automotive Top Mount Consumption by Country (2021-2032)
- 8.3.3 U.S.
- 8.3.4 Canada
- 8.3.5 Mexico
- 8.4 Europe
- 8.4.1 Europe Automotive Top Mount Consumption Growth Rate by Country: 2021 VS 2025 VS 2032
- 8.4.2 Europe Automotive Top Mount Consumption by Country (2021-2032)
- 8.4.3 Germany
- 8.4.4 France
- 8.4.5 U.K.
- 8.4.6 Italy
- 8.4.7 Netherlands
- 8.5 Asia Pacific
- 8.5.1 Asia Pacific Automotive Top Mount Consumption Growth Rate by Country: 2021 VS 2025 VS 2032
- 8.5.2 Asia Pacific Automotive Top Mount Consumption by Country (2021-2032)
- 8.5.3 China
- 8.5.4 Japan
- 8.5.5 South Korea
- 8.5.6 Southeast Asia
- 8.5.7 India
- 8.5.8 Australia
- 8.6 South America
- 8.6.1 South America Automotive Top Mount Consumption Growth Rate by Country: 2021 VS 2025 VS 2032
- 8.6.2 South America Automotive Top Mount Consumption by Country (2021-2032)
- 8.6.3 Brazil
- 8.6.4 Argentina
- 8.6.5 Chile
- 8.6.6 Colombia
- 8.7 Middle East & Africa
- 8.7.1 Middle East & Africa Automotive Top Mount Consumption Growth Rate by Country: 2021 VS 2025 VS 2032
- 8.7.2 Middle East & Africa Automotive Top Mount Consumption by Country (2021-2032)
- 8.7.3 Egypt
- 8.7.4 South Africa
- 8.7.5 Israel
- 8.7.6 Türkiye
- 8.7.7 GCC Countries
9 Value Chain and Sales Channels Analysis
- 9.1 Automotive Top Mount Value Chain Analysis
- 9.1.1 Automotive Top Mount Key Raw Materials
- 9.1.2 Raw Materials Key Suppliers
- 9.1.3 Manufacturing Cost Structure
- 9.1.4 Automotive Top Mount Production Mode & Process
- 9.2 Automotive Top Mount Sales Channels Analysis
- 9.2.1 Direct Comparison with Distribution Share
- 9.2.2 Automotive Top Mount Distributors
- 9.2.3 Automotive Top Mount Customers
10 Concluding Insights
11 Appendix
- 11.1 Reasons for Doing This Study
- 11.2 Research Methodology
- 11.3 Research Process
- 11.4 Authors List of This Report
- 11.5 Data Source
- 11.5.1 Secondary Sources
- 11.5.2 Primary Sources
- 11.6 Disclaimer
GET THE RESEARCH
Choose your license.
PDF by email within 3–5 working days after payment confirmation.
Talk to an analyst