
Global Methanation Catalysts Market Analysis and Forecast 2026-2032
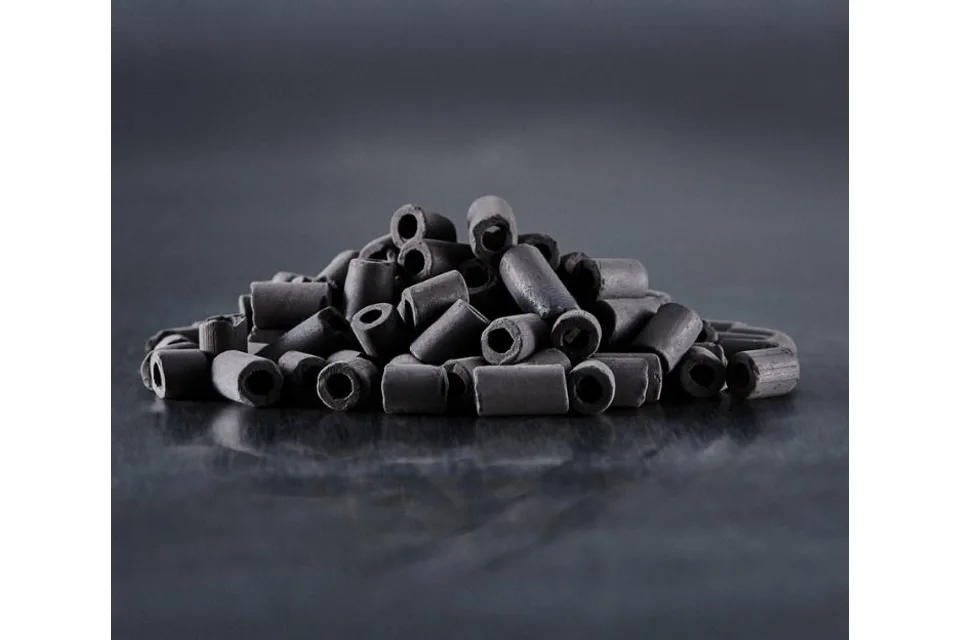
Methanation catalysts are heterogeneous catalytic materials that promote the hydrogenation of carbon monoxide (CO) and carbon dioxide (CO₂) to methane (CH₄) and water (H₂O). The principal reactions are CO + 3H₂ → CH₄ + H₂O and CO₂ + 4H₂ → CH₄ + 2H₂O, releasing approximately 206 kJ and 165 kJ of heat per mole of carbon oxide converted, respectively, under standard conditions. Catalytic activity originates from accessible metal surface sites that dissociate hydrogen, adsorb carbon oxides, activate carbon and oxygen bonds, and facilitate successive hydrogenation steps leading to methane formation and water desorption. CO methanation generally involves adsorbed CO dissociation followed by hydrogenation of surface carbon species, while CO₂ methanation can proceed through CO intermediates or oxygenated surface species, including formates, depending on the active metal, support composition and reaction conditions. Both reactions reduce the total number of gas molecules, making elevated pressure thermodynamically favorable for methane formation. Lower temperatures favor equilibrium methane yields, while higher temperatures accelerate reaction kinetics and increase the risk of reverse water gas shift activity, catalyst sintering and equilibrium limitations. Reaction performance is governed by hydrogen availability, carbon oxide partial pressures, steam concentration, temperature distribution, gas residence time and the accessibility of active catalytic sites.
Commercial methanation catalysts primarily employ nickel or ruthenium as the active metal, dispersed on thermally stable inorganic supports such as alumina, magnesium aluminate spinel, zirconia and modified metal oxides. Nickel catalysts account for the principal industrial catalyst technology used in large scale synthetic natural gas production and conventional carbon oxide removal because of their established activity, raw material availability and suitability for substantial catalyst inventories. Ruthenium catalysts exhibit high intrinsic hydrogenation activity at comparatively low temperatures and are used in selected purification and CO₂ methanation applications where low temperature conversion or higher specific activity is required. Commercial formulations are supplied as spheres, tablets, cylindrical extrudates, rings or structured catalytic bodies, with metal loading, support porosity, particle geometry and promoter composition determining active surface area, diffusion resistance, pressure drop, mechanical integrity and thermal durability. Nickel catalysts commonly contain nickel oxide before activation, which is reduced to metallic nickel under hydrogen to generate the active phase. Prereduced and passivated formulations are also available for specific operating requirements. Catalyst deactivation arises principally from sulfur poisoning, carbon deposition, thermal sintering, oxidation of active metal sites and structural deterioration under severe temperature or steam exposure. Sulfur compounds can strongly inhibit metallic active sites, while carbon formation becomes important under unfavorable carbon activity and hydrogen availability. The highly exothermic reaction requires controlled heat removal through staged adiabatic reactors, gas recycle, intercooling or cooled reactor configurations. Commercial catalyst selection therefore reflects the required conversion at the prevailing temperature, tolerance to feed impurities, resistance to thermal excursions, activity retention, pressure drop and expected operating life.
Methanation catalysts are used in synthetic natural gas production, ammonia synthesis, hydrogen production, petroleum refining, petrochemical gas purification and renewable methane production. In coal and petroleum coke gasification processes, they convert conditioned synthesis gas containing CO, CO₂ and H₂ into methane suitable for downstream gas processing and distribution. In renewable methane production, they convert captured or process derived CO₂ and hydrogen from water electrolysis into methane, enabling the conversion of renewable hydrogen into a gaseous hydrocarbon fuel. In ammonia plants, methanation catalysts remove residual CO and CO₂ following reforming, water gas shift conversion and bulk carbon dioxide removal, protecting downstream ammonia synthesis catalysts from carbon oxide contamination. Similar purification duties occur in hydrogen production and selected petrochemical processes where residual carbon oxides interfere with subsequent catalytic operations. The required catalyst inventory and operating configuration vary substantially between bulk methanation and trace carbon oxide removal. Bulk methanation involves high carbon oxide throughput, substantial heat release and sustained conversion across multiple reaction stages. Purification methanation operates at lower carbon oxide concentrations and emphasizes low residual impurity levels while controlling hydrogen consumption and methane formation. In CO₂ hydrogenation systems, catalyst performance is additionally influenced by feedstock CO₂ purity, electrolytic hydrogen supply, operating flexibility, steam accumulation and the competing formation of CO through reverse water gas shift reactions. These operating conditions determine the appropriate active metal, catalyst formulation, reactor loading and replacement interval for each industrial application.
Product & engineering
Understand the product.
Methanation catalysts are heterogeneous catalytic materials that promote the hydrogenation of carbon monoxide (CO) and carbon dioxide (CO₂) to methane (CH₄) and water (H₂O). The principal reactions are CO + 3H₂ → CH₄ + H₂O and CO₂ + 4H₂ → CH₄ + 2H₂O, releasing approximately 206 kJ and 165 kJ of heat per mole of carbon oxide converted, respectively, under standard conditions. Catalytic activity originates from accessible metal surface sites that dissociate hydrogen, adsorb carbon oxides, activate carbon and oxygen bonds, and facilitate successive hydrogenation steps leading to methane formation and water desorption. CO methanation generally involves adsorbed CO dissociation followed by hydrogenation of surface carbon species, while CO₂ methanation can proceed through CO intermediates or oxygenated surface species, including formates, depending on the active metal, support composition and reaction conditions. Both reactions reduce the total number of gas molecules, making elevated pressure thermodynamically favorable for methane formation. Lower temperatures favor equilibrium methane yields, while higher temperatures accelerate reaction kinetics and increase the risk of reverse water gas shift activity, catalyst sintering and equilibrium limitations. Reaction performance is governed by hydrogen availability, carbon oxide partial pressures, steam concentration, temperature distribution, gas residence time and the accessibility of active catalytic sites.
Commercial methanation catalysts primarily employ nickel or ruthenium as the active metal, dispersed on thermally stable inorganic supports such as alumina, magnesium aluminate spinel, zirconia and modified metal oxides. Nickel catalysts account for the principal industrial catalyst technology used in large scale synthetic natural gas production and conventional carbon oxide removal because of their established activity, raw material availability and suitability for substantial catalyst inventories. Ruthenium catalysts exhibit high intrinsic hydrogenation activity at comparatively low temperatures and are used in selected purification and CO₂ methanation applications where low temperature conversion or higher specific activity is required. Commercial formulations are supplied as spheres, tablets, cylindrical extrudates, rings or structured catalytic bodies, with metal loading, support porosity, particle geometry and promoter composition determining active surface area, diffusion resistance, pressure drop, mechanical integrity and thermal durability. Nickel catalysts commonly contain nickel oxide before activation, which is reduced to metallic nickel under hydrogen to generate the active phase. Prereduced and passivated formulations are also available for specific operating requirements. Catalyst deactivation arises principally from sulfur poisoning, carbon deposition, thermal sintering, oxidation of active metal sites and structural deterioration under severe temperature or steam exposure. Sulfur compounds can strongly inhibit metallic active sites, while carbon formation becomes important under unfavorable carbon activity and hydrogen availability. The highly exothermic reaction requires controlled heat removal through staged adiabatic reactors, gas recycle, intercooling or cooled reactor configurations. Commercial catalyst selection therefore reflects the required conversion at the prevailing temperature, tolerance to feed impurities, resistance to thermal excursions, activity retention, pressure drop and expected operating life.
Methanation catalysts are used in synthetic natural gas production, ammonia synthesis, hydrogen production, petroleum refining, petrochemical gas purification and renewable methane production. In coal and petroleum coke gasification processes, they convert conditioned synthesis gas containing CO, CO₂ and H₂ into methane suitable for downstream gas processing and distribution. In renewable methane production, they convert captured or process derived CO₂ and hydrogen from water electrolysis into methane, enabling the conversion of renewable hydrogen into a gaseous hydrocarbon fuel. In ammonia plants, methanation catalysts remove residual CO and CO₂ following reforming, water gas shift conversion and bulk carbon dioxide removal, protecting downstream ammonia synthesis catalysts from carbon oxide contamination. Similar purification duties occur in hydrogen production and selected petrochemical processes where residual carbon oxides interfere with subsequent catalytic operations. The required catalyst inventory and operating configuration vary substantially between bulk methanation and trace carbon oxide removal. Bulk methanation involves high carbon oxide throughput, substantial heat release and sustained conversion across multiple reaction stages. Purification methanation operates at lower carbon oxide concentrations and emphasizes low residual impurity levels while controlling hydrogen consumption and methane formation. In CO₂ hydrogenation systems, catalyst performance is additionally influenced by feedstock CO₂ purity, electrolytic hydrogen supply, operating flexibility, steam accumulation and the competing formation of CO through reverse water gas shift reactions. These operating conditions determine the appropriate active metal, catalyst formulation, reactor loading and replacement interval for each industrial application.
Selected research
Market Analysis & Forecast
Global Methanation Catalysts Market Analysis and Forecast 2026-2032
MARKET AT A GLANCE
Scale & outlook
- 2025
- 65.54USD million
- 2032
- 84.69USD million
Select a bar to inspect its value.
Source: APO Research, Inc.
Market perspective
According to APO Research, Inc, the global Methanation Catalysts market was valued at USD 65.54 million in 2025 and is estimated to reach USD 68.84 million in 2026 and USD 84.69 million by 2032, representing a compound annual growth rate (CAGR) of 3.51% from 2026 to 2032. Global catalyst sales are projected to increase from 3,538 tonnes in 2026 to 4,050 tonnes in 2032, while the average selling price rises from approximately USD 19,457 to USD 20,911 per tonne. Of the projected USD 15.85 million revenue increase, approximately USD 9.96 million is attributable to additional sales volume at 2026 prices, with the remaining USD 5.89 million arising from higher average realized prices. Catalyst consumption depends on initial reactor loading, subsequent replacement intervals and the operating condition of existing plants, making industrial maintenance and catalyst replacement important sources of demand alongside new methanation capacity.
China represents a major source of industrial methanation catalyst procurement and an increasingly competitive manufacturing base. Southwest Research and Design Institute of Chemical Industry replaced imported methanation catalysts at the Qinghua coal to synthetic natural gas facility in Xinjiang in 2022 and subsequently at the Yili Xintian facility in 2024. The respective plants have annual synthetic natural gas capacities of approximately 1.375 billion and 1 billion normal cubic meters. The Qinghua installation accumulated 18,000 operating hours over a complete catalyst operating cycle, with an average operating load of 104%, establishing a commercial operating reference for domestic catalysts in large industrial reactors. These replacements transfer procurement from established international suppliers to Chinese manufacturers while preserving the underlying demand associated with existing reactor inventories. China's conventional hydrogen production sector provides a separate procurement channel. Sinopec's 2026 procurement program specified 74.15 tonnes of prereduced methanation catalysts for hydrogen production, with a required operating life exceeding four years. The purchase specification illustrates how scheduled catalyst replacement and the installed base of hydrogen purification units generate measurable orders independently of new synthetic natural gas projects. Existing ammonia and hydrogen plants in China, India and North America provide continuing demand for carbon oxide removal catalysts, although new electrolytic hydrogen facilities do not require conventional reformate methanation unless their hydrogen is subsequently used to produce methane.
Nickel based catalysts account for the principal industrial volume in conventional ammonia, hydrogen and synthetic natural gas production, while ruthenium based formulations address selected low temperature purification applications. Clariant's METH 134 and METH 135 contain 25% and 43% nickel oxide by weight, respectively, whereas its METH 150 uses ruthenium for methanation below 170°C. Differences in active metal loading, operating temperature and reactor duty create distinct pricing and replacement economics within the same product category. Topsoe's MCR series and PK series similarly address different temperature ranges and reactor configurations in synthetic natural gas and synthesis gas purification. The projected increase in average selling prices reflects a combination of specialized catalyst formulations, metal input costs and product mix, with conventional nickel catalysts continuing to account for most physical sales.
Full market overview
CO₂ methanation represents an additional source of catalyst demand in Japan and selected European industrial projects. In February 2026, INPEX and Osaka Gas began demonstration operation at their Nagaoka facility in Niigata Prefecture, Japan, with a CO₂ processing capacity of 400 normal cubic meters per hour. The facility achieved a methane concentration of 96% during commissioning and injected synthetic methane into the existing natural gas pipeline system on February 20, demonstrating an operating route from recovered CO₂ to pipeline gas. In Germany, Clariant's methanation catalysts have been deployed at Audi's Werlte synthetic methane facility, providing an industrial reference for catalytic conversion of renewable hydrogen and CO₂. These projects create demand for dedicated CO₂ hydrogenation formulations, although commercial expansion remains constrained by electrolytic hydrogen costs, available CO₂ supply and project financing. Conventional biomethane upgrading based on gas separation does not itself require methanation catalysts, and additional demand arises when separated CO₂ is subsequently converted with hydrogen. The projected market expansion therefore depends principally on replacement requirements in established industrial applications, selective new synthetic natural gas installations and the gradual commissioning of dedicated CO₂ methanation capacity.
This report presents an overview of global market for Methanation Catalysts, capacity, output, revenue and price. Analyses of the global market trends, with historic market revenue or sales data for 2021 - 2025, estimates for 2026, and projections of CAGR through 2032.
This report researches the key producers of Methanation Catalysts, also provides the consumption of main regions and countries. Of the upcoming market potential for Methanation Catalysts, and key regions or countries of focus to forecast this market into various segments and sub-segments. Country specific data and market value analysis for the U.S., Canada, Mexico, Brazil, China, Japan, South Korea, Southeast Asia, India, Germany, the U.K., Italy, Middle East, Africa, and Other Countries.
This report focuses on the Methanation Catalysts sales, revenue, market share and industry ranking of main manufacturers, data from 2021 to 2026. Identification of the major stakeholders in the global Methanation Catalysts market, and analysis of their competitive landscape and market positioning based on recent developments and segmental revenues. This report will help stakeholders to understand the competitive landscape and gain more insights and position their businesses and market strategies in a better way.
This report analyzes the segments data by Type and by Application, sales, revenue, and price, from 2021 to 2032. Evaluation and forecast the market size for Methanation Catalysts sales, projected growth trends, production technology, application and end-user industry.
Methanation Catalysts Segment by Company
- Topsoe
- Honeywell
- BASF
- Clariant
- Heraeus Precious Metals
- UNICAT Catalyst Technologies
- JGC Catalysts and Chemicals
- TANAKA Precious Metals
- ITOCHU CERATECH
- Hulteberg Chemistry & Engineering
- NIAP Katalizator
- Southwest Research and Design Institute of Chemical Industry
- Sinopec Nanjing Chemical Research Institute
- Sichuan Shutai
- Hubei Huihuang
- Dalian Reak
- Dalian Kaiteli
- Liaoning Haitai
- Jiangxi Huihua
- REZEL Catalysts
- Wuhan Kelin
- Chengdu Shengli
- Changyi Kaite
- Shandong Dengzhuo
- Kunshan Huahai
- Henan Xinye Catalyst
Methanation Catalysts Segment by Type
- Nickel Based
- Ruthenium Based
Methanation Catalysts Segment by Application
- SNG Production
- Ammonia Production
- Hydrogen Production
- Petrochemicals and Refining
- Others
Methanation Catalysts Segment by Region
- North America
- United States
- Canada
- Mexico
- Europe
- Germany
- France
- U.K.
- Italy
- Russia
- Spain
- Netherlands
- Switzerland
- Sweden
- Poland
- Asia-Pacific
- China
- Japan
- South Korea
- India
- Australia
- Taiwan
- Southeast Asia
- South America
- Brazil
- Argentina
- Chile
- Colombia
- Middle East & Africa
- Egypt
- South Africa
- Israel
- Türkiye
- GCC Countries
Study Objectives
- To analyze and research the global status and future forecast, involving, production, value, consumption, growth rate (CAGR), market share, historical and forecast.
- To present the key manufacturers, capacity, production, revenue, market share, and Recent Developments.
- To split the breakdown data by regions, type, manufacturers, and Application.
- To analyze the global and key regions market potential and advantage, opportunity and challenge, restraints, and risks.
- To identify significant trends, drivers, influence factors in global and regions.
- To analyze competitive developments such as expansions, agreements, new product launches, and acquisitions in the market.
Reasons to Buy This Report
- This report will help the readers to understand the competition within the industries and strategies for the competitive environment to enhance the potential profit. The report also focuses on the competitive landscape of the global Methanation Catalysts market, and introduces in detail the market share, industry ranking, competitor ecosystem, market performance, new product development, operation situation, expansion, and acquisition. etc. of the main players, which helps the readers to identify the main competitors and deeply understand the competition pattern of the market.
- This report will help stakeholders to understand the global industry status and trends of Methanation Catalysts and provides them with information on key market drivers, restraints, challenges, and opportunities.
- This report will help stakeholders to understand competitors better and gain more insights to strengthen their position in their businesses. The competitive landscape section includes the market share and rank (in volume and value), competitor ecosystem, new product development, expansion, and acquisition.
- This report stays updated with novel technology integration, features, and the latest developments in the market.
- This report helps stakeholders to gain insights into which regions to target globally.
- This report helps stakeholders to gain insights into the end-user perception concerning the adoption of Methanation Catalysts.
- This report helps stakeholders to identify some of the key players in the market and understand their valuable contribution.
Chapter Outline
- Chapter 1: Introduces the report scope of the report, executive summary of different market segments (by type and by application, etc), including the market size of each market segment, future development potential, and so on. It offers a high-level view of the current state of the market and its likely evolution in the short to mid-term, and long term.
- Chapter 2: Introduces the market dynamics, latest developments of the market, the driving factors and restrictive factors of the market, the challenges and risks faced by manufacturers in the industry, and the analysis of relevant policies in the industry.
- Chapter 3: Methanation Catalysts production/output of global and key producers (regions/countries). It provides a quantitative analysis of the production, and development potential of each producer in the next six years.
- Chapter 4: Sales (consumption), revenue of Methanation Catalysts in global, regional level and country level. It provides a quantitative analysis of the market size and development potential of each region and its main countries and introduces the market development, future development prospects, market space of each country in the world.
- Chapter 5: Detailed analysis of Methanation Catalysts manufacturers competitive landscape, price, sales, revenue, market share and industry ranking, latest development plan, merger, and acquisition information, etc.
- Chapter 6: Provides the analysis of various market segments by type, covering the sales, revenue, average price, and development potential of each market segment, to help readers find the blue ocean market in different market segments.
- Chapter 7: Provides the analysis of various market segments by application, covering the sales, revenue, average price, and development potential of each market segment, to help readers find the blue ocean market in different downstream markets.
- Chapter 8: Provides profiles of key manufacturers, introducing the basic situation of the main companies in the market in detail, including product descriptions and specifications, Methanation Catalysts sales, revenue, price, gross margin, and recent development, etc.
- Chapter 9: North America by type, by application and by country, sales, and revenue for each segment.
- Chapter 10: Europe by type, by application and by country, sales, and revenue for each segment.
- Chapter 11: China by type, by application, sales, and revenue for each segment.
- Chapter 12: Asia (Excluding China) by type, by application and by region, sales, and revenue for each segment.
- Chapter 13: South America, Middle East and Africa by type, by application and by country, sales, and revenue for each segment.
- Chapter 14: Analysis of industrial chain, sales channel, key raw materials, distributors and customers.
- Chapter 15: The main concluding insights of the report.
More report detail
Tables and figures
List of Tables
- Table 1. Global Methanation Catalysts Market Size Growth Rate by Type (US$ Million), 2021 VS 2025 VS 2032
- Table 2. Nickel Based Major Manufacturers
- Table 3. Ruthenium Based Major Manufacturers
- Table 4. Global Methanation Catalysts Market Size Growth Rate by Application (US$ Million), 2021 VS 2025 VS 2032
- Table 5. SNG Production Major Manufacturers
- Table 6. Ammonia Production Major Manufacturers
- Table 7. Hydrogen Production Major Manufacturers
- Table 8. Petrochemicals and Refining Major Manufacturers
- Table 9. Others Major Manufacturers
- Table 10. Methanation Catalysts Industry Trends
- Table 11. Methanation Catalysts Industry Drivers
- Table 12. Methanation Catalysts Industry Opportunities and Challenges
- Table 13. Methanation Catalysts Industry Restraints
- Table 14. Global Methanation Catalysts Production Growth Rate (CAGR) by Region: 2021 VS 2025 VS 2032 (t)
- Table 15. Global Methanation Catalysts Production by Region (2021-2026) & (t)
- Table 16. Global Methanation Catalysts Production by Region (2027-2032) & (t)
- Table 17. Global Methanation Catalysts Production Market Share by Region (2021-2026)
- Table 18. Global Methanation Catalysts Production Market Share by Region (2027-2032)
- Table 19. Global Methanation Catalysts Revenue Grow Rate (CAGR) by Region: 2021 VS 2025 VS 2032 (US$ Million)
- Table 20. Global Methanation Catalysts Revenue by Region (2021-2026) & (US$ Million)
- Table 21. Global Methanation Catalysts Revenue by Region (2027-2032) & (US$ Million)
- Table 22. Global Methanation Catalysts Revenue Market Share by Region (2021-2026)
- Table 23. Global Methanation Catalysts Revenue Market Share by Region (2027-2032)
- Table 24. Global Methanation Catalysts Sales Grow Rate (CAGR) by Region: 2021 VS 2025 VS 2032 (t)
- Table 25. Global Methanation Catalysts Sales by Region (2021-2026) & (t)
- Table 26. Global Methanation Catalysts Sales by Region (2027-2032) & (t)
- Table 27. Global Methanation Catalysts Sales Market Share by Region (2021-2026)
- Table 28. Global Methanation Catalysts Sales Market Share by Region (2027-2032)
- Table 29. Global Methanation Catalysts Revenue by Manufacturers (US$ Million) & (2021-2026)
- Table 30. Global Methanation Catalysts Revenue Market Share by Manufacturers (2021-2026)
- Table 31. Global Methanation Catalysts Sales by Manufacturers (US$ Million) & (2021-2026)
- Table 32. Global Methanation Catalysts Sales Market Share by Manufacturers (2021-2026)
- Table 33. Global Methanation Catalysts Sales Price (USD/t) of Manufacturers (2021-2026)
- Table 34. Global Methanation Catalysts Key Manufacturers Ranking, 2024 VS 2025 VS 2026
- Table 35. Global Methanation Catalysts Key Manufacturers Manufacturing Sites & Headquarters
- Table 36. Global Methanation Catalysts Manufacturers, Product Type & Application
- Table 37. Global Methanation Catalysts Manufacturers Commercialization Time
- Table 38. Global Manufacturers Market Concentration Ratio (CR5 and HHI)
- Table 39. Global Methanation Catalysts by Manufacturers Type (Tier 1, Tier 2, and Tier 3) & (based on the Revenue of 2025)
- Table 40. Global Methanation Catalysts Revenue by Type (2021-2026) & (US$ Million)
- Table 41. Global Methanation Catalysts Revenue by Type (2027-2032) & (US$ Million)
- Table 42. Global Methanation Catalysts Revenue Market Share by Type (2021-2026)
- Table 43. Global Methanation Catalysts Revenue Market Share by Type (2027-2032)
- Table 44. Global Methanation Catalysts Sales by Type (2021-2026) & (t)
- Table 45. Global Methanation Catalysts Sales by Type (2027-2032) & (t)
- Table 46. Global Methanation Catalysts Sales Market Share by Type (2021-2026)
- Table 47. Global Methanation Catalysts Sales Market Share by Type (2027-2032)
- Table 48. Global Methanation Catalysts Price by Type (2021-2026) & (USD/t)
- Table 49. Global Methanation Catalysts Price by Type (2027-2032) & (USD/t)
- Table 50. Global Methanation Catalysts Revenue by Application (2021-2026) & (US$ Million)
- Table 51. Global Methanation Catalysts Revenue by Application (2027-2032) & (US$ Million)
- Table 52. Global Methanation Catalysts Revenue Market Share by Application (2021-2026)
- Table 53. Global Methanation Catalysts Revenue Market Share by Application (2027-2032)
- Table 54. Global Methanation Catalysts Sales by Application (2021-2026) & (t)
- Table 55. Global Methanation Catalysts Sales by Application (2027-2032) & (t)
- Table 56. Global Methanation Catalysts Sales Market Share by Application (2021-2026)
- Table 57. Global Methanation Catalysts Sales Market Share by Application (2027-2032)
- Table 58. Global Methanation Catalysts Price by Application (2021-2026) & (USD/t)
- Table 59. Global Methanation Catalysts Price by Application (2027-2032) & (USD/t)
- Table 60. Topsoe Company Information
- Table 61. Topsoe Business Overview
- Table 62. Topsoe Methanation Catalysts Sales (t), Revenue (US$ Million), Price (USD/t) and Gross Margin (2021-2026)
- Table 63. Topsoe Methanation Catalysts Product Portfolio
- Table 64. Topsoe Recent Development
- Table 65. Honeywell Company Information
- Table 66. Honeywell Business Overview
- Table 67. Honeywell Methanation Catalysts Sales (t), Revenue (US$ Million), Price (USD/t) and Gross Margin (2021-2026)
- Table 68. Honeywell Methanation Catalysts Product Portfolio
- Table 69. Honeywell Recent Development
- Table 70. BASF Company Information
- Table 71. BASF Business Overview
- Table 72. BASF Methanation Catalysts Sales (t), Revenue (US$ Million), Price (USD/t) and Gross Margin (2021-2026)
- Table 73. BASF Methanation Catalysts Product Portfolio
- Table 74. BASF Recent Development
- Table 75. Clariant Company Information
- Table 76. Clariant Business Overview
- Table 77. Clariant Methanation Catalysts Sales (t), Revenue (US$ Million), Price (USD/t) and Gross Margin (2021-2026)
- Table 78. Clariant Methanation Catalysts Product Portfolio
- Table 79. Clariant Recent Development
- Table 80. Heraeus Precious Metals Company Information
- Table 81. Heraeus Precious Metals Business Overview
- Table 82. Heraeus Precious Metals Methanation Catalysts Sales (t), Revenue (US$ Million), Price (USD/t) and Gross Margin (2021-2026)
- Table 83. Heraeus Precious Metals Methanation Catalysts Product Portfolio
- Table 84. Heraeus Precious Metals Recent Development
- Table 85. UNICAT Catalyst Technologies Company Information
- Table 86. UNICAT Catalyst Technologies Business Overview
- Table 87. UNICAT Catalyst Technologies Methanation Catalysts Sales (t), Revenue (US$ Million), Price (USD/t) and Gross Margin (2021-2026)
- Table 88. UNICAT Catalyst Technologies Methanation Catalysts Product Portfolio
- Table 89. UNICAT Catalyst Technologies Recent Development
- Table 90. JGC Catalysts and Chemicals Company Information
- Table 91. JGC Catalysts and Chemicals Business Overview
- Table 92. JGC Catalysts and Chemicals Methanation Catalysts Sales (t), Revenue (US$ Million), Price (USD/t) and Gross Margin (2021-2026)
- Table 93. JGC Catalysts and Chemicals Methanation Catalysts Product Portfolio
- Table 94. JGC Catalysts and Chemicals Recent Development
- Table 95. TANAKA Precious Metals Company Information
- Table 96. TANAKA Precious Metals Business Overview
- Table 97. TANAKA Precious Metals Methanation Catalysts Sales (t), Revenue (US$ Million), Price (USD/t) and Gross Margin (2021-2026)
- Table 98. TANAKA Precious Metals Methanation Catalysts Product Portfolio
- Table 99. TANAKA Precious Metals Recent Development
- Table 100. ITOCHU CERATECH Company Information
- Table 101. ITOCHU CERATECH Business Overview
- Table 102. ITOCHU CERATECH Methanation Catalysts Sales (t), Revenue (US$ Million), Price (USD/t) and Gross Margin (2021-2026)
- Table 103. ITOCHU CERATECH Methanation Catalysts Product Portfolio
- Table 104. ITOCHU CERATECH Recent Development
- Table 105. Hulteberg Chemistry & Engineering Company Information
- Table 106. Hulteberg Chemistry & Engineering Business Overview
- Table 107. Hulteberg Chemistry & Engineering Methanation Catalysts Sales (t), Revenue (US$ Million), Price (USD/t) and Gross Margin (2021-2026)
- Table 108. Hulteberg Chemistry & Engineering Methanation Catalysts Product Portfolio
- Table 109. Hulteberg Chemistry & Engineering Recent Development
- Table 110. NIAP Katalizator Company Information
- Table 111. NIAP Katalizator Business Overview
- Table 112. NIAP Katalizator Methanation Catalysts Sales (t), Revenue (US$ Million), Price (USD/t) and Gross Margin (2021-2026)
- Table 113. NIAP Katalizator Methanation Catalysts Product Portfolio
- Table 114. NIAP Katalizator Recent Development
- Table 115. Southwest Research and Design Institute of Chemical Industry Company Information
- Table 116. Southwest Research and Design Institute of Chemical Industry Business Overview
- Table 117. Southwest Research and Design Institute of Chemical Industry Methanation Catalysts Sales (t), Revenue (US$ Million), Price (USD/t) and Gross Margin (2021-2026)
- Table 118. Southwest Research and Design Institute of Chemical Industry Methanation Catalysts Product Portfolio
- Table 119. Southwest Research and Design Institute of Chemical Industry Recent Development
- Table 120. Sinopec Nanjing Chemical Research Institute Company Information
- Table 121. Sinopec Nanjing Chemical Research Institute Business Overview
- Table 122. Sinopec Nanjing Chemical Research Institute Methanation Catalysts Sales (t), Revenue (US$ Million), Price (USD/t) and Gross Margin (2021-2026)
- Table 123. Sinopec Nanjing Chemical Research Institute Methanation Catalysts Product Portfolio
- Table 124. Sinopec Nanjing Chemical Research Institute Recent Development
- Table 125. Sichuan Shutai Company Information
- Table 126. Sichuan Shutai Business Overview
- Table 127. Sichuan Shutai Methanation Catalysts Sales (t), Revenue (US$ Million), Price (USD/t) and Gross Margin (2021-2026)
- Table 128. Sichuan Shutai Methanation Catalysts Product Portfolio
- Table 129. Sichuan Shutai Recent Development
- Table 130. Hubei Huihuang Company Information
- Table 131. Hubei Huihuang Business Overview
- Table 132. Hubei Huihuang Methanation Catalysts Sales (t), Revenue (US$ Million), Price (USD/t) and Gross Margin (2021-2026)
- Table 133. Hubei Huihuang Methanation Catalysts Product Portfolio
- Table 134. Hubei Huihuang Recent Development
- Table 135. Dalian Reak Company Information
- Table 136. Dalian Reak Business Overview
- Table 137. Dalian Reak Methanation Catalysts Sales (t), Revenue (US$ Million), Price (USD/t) and Gross Margin (2021-2026)
- Table 138. Dalian Reak Methanation Catalysts Product Portfolio
- Table 139. Dalian Reak Recent Development
- Table 140. Dalian Kaiteli Company Information
- Table 141. Dalian Kaiteli Business Overview
- Table 142. Dalian Kaiteli Methanation Catalysts Sales (t), Revenue (US$ Million), Price (USD/t) and Gross Margin (2021-2026)
- Table 143. Dalian Kaiteli Methanation Catalysts Product Portfolio
- Table 144. Dalian Kaiteli Recent Development
- Table 145. Liaoning Haitai Company Information
- Table 146. Liaoning Haitai Business Overview
- Table 147. Liaoning Haitai Methanation Catalysts Sales (t), Revenue (US$ Million), Price (USD/t) and Gross Margin (2021-2026)
- Table 148. Liaoning Haitai Methanation Catalysts Product Portfolio
- Table 149. Liaoning Haitai Recent Development
- Table 150. Jiangxi Huihua Company Information
- Table 151. Jiangxi Huihua Business Overview
- Table 152. Jiangxi Huihua Methanation Catalysts Sales (t), Revenue (US$ Million), Price (USD/t) and Gross Margin (2021-2026)
- Table 153. Jiangxi Huihua Methanation Catalysts Product Portfolio
- Table 154. Jiangxi Huihua Recent Development
- Table 155. REZEL Catalysts Company Information
- Table 156. REZEL Catalysts Business Overview
- Table 157. REZEL Catalysts Methanation Catalysts Sales (t), Revenue (US$ Million), Price (USD/t) and Gross Margin (2021-2026)
- Table 158. REZEL Catalysts Methanation Catalysts Product Portfolio
- Table 159. REZEL Catalysts Recent Development
- Table 160. Wuhan Kelin Company Information
- Table 161. Wuhan Kelin Business Overview
- Table 162. Wuhan Kelin Methanation Catalysts Sales (t), Revenue (US$ Million), Price (USD/t) and Gross Margin (2021-2026)
- Table 163. Wuhan Kelin Methanation Catalysts Product Portfolio
- Table 164. Wuhan Kelin Recent Development
- Table 165. Chengdu Shengli Company Information
- Table 166. Chengdu Shengli Business Overview
- Table 167. Chengdu Shengli Methanation Catalysts Sales (t), Revenue (US$ Million), Price (USD/t) and Gross Margin (2021-2026)
- Table 168. Chengdu Shengli Methanation Catalysts Product Portfolio
- Table 169. Chengdu Shengli Recent Development
- Table 170. Changyi Kaite Company Information
- Table 171. Changyi Kaite Business Overview
- Table 172. Changyi Kaite Methanation Catalysts Sales (t), Revenue (US$ Million), Price (USD/t) and Gross Margin (2021-2026)
- Table 173. Changyi Kaite Methanation Catalysts Product Portfolio
- Table 174. Changyi Kaite Recent Development
- Table 175. Shandong Dengzhuo Company Information
- Table 176. Shandong Dengzhuo Business Overview
- Table 177. Shandong Dengzhuo Methanation Catalysts Sales (t), Revenue (US$ Million), Price (USD/t) and Gross Margin (2021-2026)
- Table 178. Shandong Dengzhuo Methanation Catalysts Product Portfolio
- Table 179. Shandong Dengzhuo Recent Development
- Table 180. Kunshan Huahai Company Information
- Table 181. Kunshan Huahai Business Overview
- Table 182. Kunshan Huahai Methanation Catalysts Sales (t), Revenue (US$ Million), Price (USD/t) and Gross Margin (2021-2026)
- Table 183. Kunshan Huahai Methanation Catalysts Product Portfolio
- Table 184. Kunshan Huahai Recent Development
- Table 185. Henan Xinye Catalyst Company Information
- Table 186. Henan Xinye Catalyst Business Overview
- Table 187. Henan Xinye Catalyst Methanation Catalysts Sales (t), Revenue (US$ Million), Price (USD/t) and Gross Margin (2021-2026)
- Table 188. Henan Xinye Catalyst Methanation Catalysts Product Portfolio
- Table 189. Henan Xinye Catalyst Recent Development
- Table 190. North America Methanation Catalysts Revenue by Type (2021-2026) & (US$ Million)
- Table 191. North America Methanation Catalysts Revenue by Type (2027-2032) & (US$ Million)
- Table 192. North America Methanation Catalysts Sales by Type (2021-2026) & (t)
- Table 193. North America Methanation Catalysts Sales by Type (2027-2032) & (t)
- Table 194. North America Methanation Catalysts Sales Price by Type (2021-2026) & (USD/t)
- Table 195. North America Methanation Catalysts Sales Price by Type (2027-2032) & (USD/t)
- Table 196. North America Methanation Catalysts Revenue by Application (2021-2026) & (US$ Million)
- Table 197. North America Methanation Catalysts Revenue by Application (2027-2032) & (US$ Million)
- Table 198. North America Methanation Catalysts Sales by Application (2021-2026) & (t)
- Table 199. North America Methanation Catalysts Sales by Application (2027-2032) & (t)
- Table 200. North America Methanation Catalysts Sales Price by Application (2021-2026) & (USD/t)
- Table 201. North America Methanation Catalysts Sales Price by Application (2027-2032) & (USD/t)
- Table 202. North America Methanation Catalysts Revenue Grow Rate by Country (2021 VS 2025 VS 2032) & (US$ Million)
- Table 203. North America Methanation Catalysts Revenue Grow Rate by Country (2021-2026) & (US$ Million)
- Table 204. North America Methanation Catalysts Revenue Grow Rate by Country (2027-2032) & (US$ Million)
- Table 205. North America Methanation Catalysts Sales by Country (2021 VS 2025 VS 2032) & (t)
- Table 206. North America Methanation Catalysts Sales by Country (2021-2026) & (t)
- Table 207. North America Methanation Catalysts Sales by Country (2027-2032) & (t)
- Table 208. North America Methanation Catalysts Sales Price by Country (2021-2026) & (USD/t)
- Table 209. North America Methanation Catalysts Sales Price by Country (2027-2032) & (USD/t)
- Table 210. United States Methanation Catalysts Revenue (2021-2032) & (US$ Million)
- Table 211. Canada Methanation Catalysts Revenue (2021-2032) & (US$ Million)
- Table 212. Mexico Methanation Catalysts Revenue (2021-2032) & (US$ Million)
- Table 213. Europe Methanation Catalysts Revenue by Type (2021-2026) & (US$ Million)
- Table 214. Europe Methanation Catalysts Revenue by Type (2027-2032) & (US$ Million)
- Table 215. Europe Methanation Catalysts Sales by Type (2021-2026) & (t)
- Table 216. Europe Methanation Catalysts Sales by Type (2027-2032) & (t)
- Table 217. Europe Methanation Catalysts Sales Price by Type (2021-2026) & (USD/t)
- Table 218. Europe Methanation Catalysts Sales Price by Type (2027-2032) & (USD/t)
- Table 219. Europe Methanation Catalysts Revenue by Application (2021-2026) & (US$ Million)
- Table 220. Europe Methanation Catalysts Revenue by Application (2027-2032) & (US$ Million)
- Table 221. Europe Methanation Catalysts Sales by Application (2021-2026) & (t)
- Table 222. Europe Methanation Catalysts Sales by Application (2027-2032) & (t)
- Table 223. Europe Methanation Catalysts Sales Price by Application (2021-2026) & (USD/t)
- Table 224. Europe Methanation Catalysts Sales Price by Application (2027-2032) & (USD/t)
- Table 225. Europe Methanation Catalysts Revenue Grow Rate by Country (2021 VS 2025 VS 2032) & (US$ Million)
- Table 226. Europe Methanation Catalysts Revenue Grow Rate by Country (2021-2026) & (US$ Million)
- Table 227. Europe Methanation Catalysts Revenue Grow Rate by Country (2027-2032) & (US$ Million)
- Table 228. Europe Methanation Catalysts Sales by Country (2021 VS 2025 VS 2032) & (t)
- Table 229. Europe Methanation Catalysts Sales by Country (2021-2026) & (t)
- Table 230. Europe Methanation Catalysts Sales by Country (2027-2032) & (t)
- Table 231. Europe Methanation Catalysts Sales Price by Country (2021-2026) & (USD/t)
- Table 232. Europe Methanation Catalysts Sales Price by Country (2027-2032) & (USD/t)
- Table 233. Germany Methanation Catalysts Revenue (2021-2032) & (US$ Million)
- Table 234. France Methanation Catalysts Revenue (2021-2032) & (US$ Million)
- Table 235. U.K. Methanation Catalysts Revenue (2021-2032) & (US$ Million)
- Table 236. Italy Methanation Catalysts Revenue (2021-2032) & (US$ Million)
- Table 237. Russia Methanation Catalysts Revenue (2021-2032) & (US$ Million)
- Table 238. Spain Methanation Catalysts Revenue (2021-2032) & (US$ Million)
- Table 239. Netherlands Methanation Catalysts Revenue (2021-2032) & (US$ Million)
- Table 240. Switzerland Methanation Catalysts Revenue (2021-2032) & (US$ Million)
- Table 241. Sweden Methanation Catalysts Revenue (2021-2032) & (US$ Million)
- Table 242. Poland Methanation Catalysts Revenue (2021-2032) & (US$ Million)
- Table 243. China Methanation Catalysts Revenue by Type (2021-2026) & (US$ Million)
- Table 244. China Methanation Catalysts Revenue by Type (2027-2032) & (US$ Million)
- Table 245. China Methanation Catalysts Sales by Type (2021-2026) & (t)
- Table 246. China Methanation Catalysts Sales by Type (2027-2032) & (t)
- Table 247. China Methanation Catalysts Sales Price by Type (2021-2026) & (USD/t)
- Table 248. China Methanation Catalysts Sales Price by Type (2027-2032) & (USD/t)
- Table 249. China Methanation Catalysts Revenue by Application (2021-2026) & (US$ Million)
- Table 250. China Methanation Catalysts Revenue by Application (2027-2032) & (US$ Million)
- Table 251. China Methanation Catalysts Sales by Application (2021-2026) & (t)
- Table 252. China Methanation Catalysts Sales by Application (2027-2032) & (t)
- Table 253. China Methanation Catalysts Sales Price by Application (2021-2026) & (USD/t)
- Table 254. China Methanation Catalysts Sales Price by Application (2027-2032) & (USD/t)
- Table 255. Asia Methanation Catalysts Revenue by Type (2021-2026) & (US$ Million)
- Table 256. Asia Methanation Catalysts Revenue by Type (2027-2032) & (US$ Million)
- Table 257. Asia Methanation Catalysts Sales by Type (2021-2026) & (t)
- Table 258. Asia Methanation Catalysts Sales by Type (2027-2032) & (t)
- Table 259. Asia Methanation Catalysts Sales Price by Type (2021-2026) & (USD/t)
- Table 260. Asia Methanation Catalysts Sales Price by Type (2027-2032) & (USD/t)
- Table 261. Asia Methanation Catalysts Revenue by Application (2021-2026) & (US$ Million)
- Table 262. Asia Methanation Catalysts Revenue by Application (2027-2032) & (US$ Million)
- Table 263. Asia Methanation Catalysts Sales by Application (2021-2026) & (t)
- Table 264. Asia Methanation Catalysts Sales by Application (2027-2032) & (t)
- Table 265. Asia Methanation Catalysts Sales Price by Application (2021-2026) & (USD/t)
- Table 266. Asia Methanation Catalysts Sales Price by Application (2027-2032) & (USD/t)
- Table 267. Asia Methanation Catalysts Revenue Grow Rate by Country (2021 VS 2025 VS 2032) & (US$ Million)
- Table 268. Asia Methanation Catalysts Revenue Grow Rate by Country (2021-2026) & (US$ Million)
- Table 269. Asia Methanation Catalysts Revenue Grow Rate by Country (2027-2032) & (US$ Million)
- Table 270. Asia Methanation Catalysts Sales by Country (2021 VS 2025 VS 2032) & (t)
- Table 271. Asia Methanation Catalysts Sales by Country (2021-2026) & (t)
- Table 272. Asia Methanation Catalysts Sales by Country (2027-2032) & (t)
- Table 273. Asia Methanation Catalysts Sales Price by Country (2021-2026) & (USD/t)
- Table 274. Asia Methanation Catalysts Sales Price by Country (2027-2032) & (USD/t)
- Table 275. Japan Methanation Catalysts Revenue (2021-2032) & (US$ Million)
- Table 276. South Korea Methanation Catalysts Revenue (2021-2032) & (US$ Million)
- Table 277. India Methanation Catalysts Revenue (2021-2032) & (US$ Million)
- Table 278. Australia Methanation Catalysts Revenue (2021-2032) & (US$ Million)
- Table 279. Taiwan Methanation Catalysts Revenue (2021-2032) & (US$ Million)
- Table 280. Southeast Asia Methanation Catalysts Revenue (2021-2032) & (US$ Million)
- Table 281. SAMEA Methanation Catalysts Revenue by Type (2021-2026) & (US$ Million)
- Table 282. SAMEA Methanation Catalysts Revenue by Type (2027-2032) & (US$ Million)
- Table 283. SAMEA Methanation Catalysts Sales by Type (2021-2026) & (t)
- Table 284. SAMEA Methanation Catalysts Sales by Type (2027-2032) & (t)
- Table 285. SAMEA Methanation Catalysts Sales Price by Type (2021-2026) & (USD/t)
- Table 286. SAMEA Methanation Catalysts Sales Price by Type (2027-2032) & (USD/t)
- Table 287. SAMEA Methanation Catalysts Revenue by Application (2021-2026) & (US$ Million)
- Table 288. SAMEA Methanation Catalysts Revenue by Application (2027-2032) & (US$ Million)
- Table 289. SAMEA Methanation Catalysts Sales by Application (2021-2026) & (t)
- Table 290. SAMEA Methanation Catalysts Sales by Application (2027-2032) & (t)
- Table 291. SAMEA Methanation Catalysts Sales Price by Application (2021-2026) & (USD/t)
- Table 292. SAMEA Methanation Catalysts Sales Price by Application (2027-2032) & (USD/t)
- Table 293. SAMEA Methanation Catalysts Revenue Grow Rate by Country (2021 VS 2025 VS 2032) & (US$ Million)
- Table 294. SAMEA Methanation Catalysts Revenue Grow Rate by Country (2021-2026) & (US$ Million)
- Table 295. SAMEA Methanation Catalysts Revenue Grow Rate by Country (2027-2032) & (US$ Million)
- Table 296. SAMEA Methanation Catalysts Sales by Country (2021 VS 2025 VS 2032) & (t)
- Table 297. SAMEA Methanation Catalysts Sales by Country (2021-2026) & (t)
- Table 298. SAMEA Methanation Catalysts Sales by Country (2027-2032) & (t)
- Table 299. SAMEA Methanation Catalysts Sales Price by Country (2021-2026) & (USD/t)
- Table 300. SAMEA Methanation Catalysts Sales Price by Country (2027-2032) & (USD/t)
- Table 301. Brazil Methanation Catalysts Revenue (2021-2032) & (US$ Million)
- Table 302. Argentina Methanation Catalysts Revenue (2021-2032) & (US$ Million)
- Table 303. Chile Methanation Catalysts Revenue (2021-2032) & (US$ Million)
- Table 304. Colombia Methanation Catalysts Revenue (2021-2032) & (US$ Million)
- Table 305. Peru Methanation Catalysts Revenue (2021-2032) & (US$ Million)
- Table 306. Saudi Arabia Methanation Catalysts Revenue (2021-2032) & (US$ Million)
- Table 307. Israel Methanation Catalysts Revenue (2021-2032) & (US$ Million)
- Table 308. UAE Methanation Catalysts Revenue (2021-2032) & (US$ Million)
- Table 309. Turkey Methanation Catalysts Revenue (2021-2032) & (US$ Million)
- Table 310. Iran Methanation Catalysts Revenue (2021-2032) & (US$ Million)
- Table 311. Egypt Methanation Catalysts Revenue (2021-2032) & (US$ Million)
- Table 312. Key Raw Materials
- Table 313. Raw Materials Key Suppliers
- Table 314. Methanation Catalysts Distributors List
- Table 315. Methanation Catalysts Customers List
- Table 316. Research Programs/Design for This Report
- Table 317. Authors List of This Report
- Table 318. Secondary Sources
- Table 319. Primary Sources
List of Figures
- Figure 1. Methanation Catalysts Product Image
- Figure 2. Global Methanation Catalysts Market Size Growth Rate by Type (US$ Million), 2021 VS 2025 VS 2032
- Figure 3. Global Methanation Catalysts Market Size Share 2021 VS 2025 VS 2032
- Figure 4. Nickel Based Image
- Figure 5. Ruthenium Based Image
- Figure 6. Global Methanation Catalysts Market Size Growth Rate by Application (US$ Million), 2021 VS 2025 VS 2032
- Figure 7. Global Methanation Catalysts Market Size Share 2021 VS 2025 VS 2032
- Figure 8. SNG Production Image
- Figure 9. Ammonia Production Image
- Figure 10. Hydrogen Production Image
- Figure 11. Petrochemicals and Refining Image
- Figure 12. Others Image
- Figure 13. Global Methanation Catalysts Capacity, Capacity Utilization (2021-2032) & (t)
- Figure 14. Global Methanation Catalysts Production by Region: 2021 VS 2025 VS 2032 (t)
- Figure 15. Global Methanation Catalysts Production Market Share by Region: 2025 Versus 2032
- Figure 16. Global Methanation Catalysts Production Market Share by Region (2021-2032)
- Figure 17. North America Methanation Catalysts Production Growth Rate (2021-2032) & (t)
- Figure 18. Europe Methanation Catalysts Production Growth Rate (2021-2032) & (t)
- Figure 19. China Methanation Catalysts Production Growth Rate (2021-2032) & (t)
- Figure 20. Japan Methanation Catalysts Production Growth Rate (2021-2032) & (t)
- Figure 21. Global Methanation Catalysts Revenue (US$ Million), 2021 VS 2025 VS 2032
- Figure 22. Global Methanation Catalysts Revenue (2021-2032) & (US$ Million)
- Figure 23. Global Methanation Catalysts Revenue (CAGR) by Region: 2021 VS 2025 VS 2032 (US$ Million)
- Figure 24. Global Methanation Catalysts Revenue Market Share by Region: 2025 Versus 2032
- Figure 25. Global Methanation Catalysts Revenue Market Share by Region (2021-2032)
- Figure 26. Global Methanation Catalysts Sales (2021-2032) & (t)
- Figure 27. Global Methanation Catalysts Sales by Region: 2021 VS 2025 VS 2032 (t)
- Figure 28. Global Methanation Catalysts Sales Market Share by Region (2021-2032)
- Figure 29. North America Methanation Catalysts Sales YoY (2021-2032) & (t)
- Figure 30. Europe Methanation Catalysts Sales YoY (2021-2032) & (t)
- Figure 31. China Methanation Catalysts Sales YoY (2021-2032) & (t)
- Figure 32. Asia (Excluding China) Methanation Catalysts Sales YoY (2021-2032) & (t)
- Figure 33. South America, Middle East and Africa Methanation Catalysts Sales YoY (2021-2032) & (t)
- Figure 34. Global Methanation Catalysts Manufacturers Revenue Share Top 10 and Top 5 in 2025
- Figure 35. Global Methanation Catalysts Manufacturers Sales Share Top 10 and Top 5 in 2025
- Figure 36. Manufacturers Type (Tier 1, Tier 2, and Tier 3): 2021 VS 2025
- Figure 37. Global Methanation Catalysts Revenue Market Share by Type (2021-2032)
- Figure 38. Global Methanation Catalysts Sales Market Share by Type (2021-2032)
- Figure 39. Global Methanation Catalysts Revenue Market Share by Application (2021-2032)
- Figure 40. Global Methanation Catalysts Sales Market Share by Application (2021-2032)
- Figure 41. North America Methanation Catalysts Revenue Share by Type (2021-2032)
- Figure 42. North America Methanation Catalysts Sales Share by Type (2021-2032)
- Figure 43. North America Methanation Catalysts Revenue Share by Application (2021-2032)
- Figure 44. North America Methanation Catalysts Sales Share by Application (2021-2032)
- Figure 45. North America Methanation Catalysts Revenue Share by Country (2021-2032)
- Figure 46. North America Methanation Catalysts Sales Share by Country (2021-2032)
- Figure 47. Europe Methanation Catalysts Revenue Share by Type (2021-2032)
- Figure 48. Europe Methanation Catalysts Sales Share by Type (2021-2032)
- Figure 49. Europe Methanation Catalysts Revenue Share by Application (2021-2032)
- Figure 50. Europe Methanation Catalysts Sales Share by Application (2021-2032)
- Figure 51. Europe Methanation Catalysts Revenue Share by Country (2021-2032)
- Figure 52. Europe Methanation Catalysts Sales Share by Country (2021-2032)
- Figure 53. China Methanation Catalysts Revenue Share by Type (2021-2032)
- Figure 54. China Methanation Catalysts Sales Share by Type (2021-2032)
- Figure 55. China Methanation Catalysts Revenue Share by Application (2021-2032)
- Figure 56. China Methanation Catalysts Sales Share by Application (2021-2032)
- Figure 57. Asia Methanation Catalysts Revenue Share by Type (2021-2032)
- Figure 58. Asia Methanation Catalysts Sales Share by Type (2021-2032)
- Figure 59. Asia Methanation Catalysts Revenue Share by Application (2021-2032)
- Figure 60. Asia Methanation Catalysts Sales Share by Application (2021-2032)
- Figure 61. Asia Methanation Catalysts Revenue Share by Country (2021-2032)
- Figure 62. Asia Methanation Catalysts Sales Share by Country (2021-2032)
- Figure 63. SAMEA Methanation Catalysts Revenue Share by Type (2021-2032)
- Figure 64. SAMEA Methanation Catalysts Sales Share by Type (2021-2032)
- Figure 65. SAMEA Methanation Catalysts Revenue Share by Application (2021-2032)
- Figure 66. SAMEA Methanation Catalysts Sales Share by Application (2021-2032)
- Figure 67. SAMEA Methanation Catalysts Revenue Share by Country (2021-2032)
- Figure 68. SAMEA Methanation Catalysts Sales Share by Country (2021-2032)
- Figure 69. Methanation Catalysts Value Chain
- Figure 70. Manufacturing Cost Structure
- Figure 71. Methanation Catalysts Production Mode & Process
- Figure 72. Direct Comparison with Distribution Share
- Figure 73. Distributors Profiles
- Figure 74. Years Considered
- Figure 75. Research Process
- Figure 76. Key Executives Interviewed
Scope & coverage.
By Type
- Nickel Based
- Ruthenium Based
By Application
- SNG Production
- Ammonia Production
- Hydrogen Production
- Petrochemicals and Refining
- Others
Companies covered
- Topsoe
- Honeywell
- BASF
- Clariant
- Heraeus Precious Metals
- UNICAT Catalyst Technologies
- JGC Catalysts and Chemicals
- TANAKA Precious Metals
- ITOCHU CERATECH
- Hulteberg Chemistry & Engineering
- NIAP Katalizator
- Southwest Research and Design Institute of Chemical Industry
- Sinopec Nanjing Chemical Research Institute
- Sichuan Shutai
- Hubei Huihuang
- Dalian Reak
- Dalian Kaiteli
- Liaoning Haitai
- Jiangxi Huihua
- REZEL Catalysts
- Wuhan Kelin
- Chengdu Shengli
- Changyi Kaite
- Shandong Dengzhuo
- Kunshan Huahai
- Henan Xinye Catalyst
Inside the report.
1 Market Overview
- 1.1 Product Definition
- 1.2 Methanation Catalysts Market by Type
- 1.2.1 Global Methanation Catalysts Market Size by Type, 2021 VS 2025 VS 2032
- 1.2.2 Nickel Based
- 1.2.3 Ruthenium Based
- 1.3 Methanation Catalysts Market by Application
- 1.3.1 Global Methanation Catalysts Market Size by Application, 2021 VS 2025 VS 2032
- 1.3.2 SNG Production
- 1.3.3 Ammonia Production
- 1.3.4 Hydrogen Production
- 1.3.5 Petrochemicals and Refining
- 1.3.6 Others
- 1.4 Assumptions and Limitations
- 1.5 Study Goals and Objectives
2 Methanation Catalysts Market Dynamics
- 2.1 Methanation Catalysts Industry Trends
- 2.2 Methanation Catalysts Industry Drivers
- 2.3 Methanation Catalysts Industry Opportunities and Challenges
- 2.4 Methanation Catalysts Industry Restraints
3 Global Methanation Catalysts Production Overview
- 3.1 Global Methanation Catalysts Production Capacity (2021-2032)
- 3.2 Global Methanation Catalysts Production by Region: 2021 VS 2025 VS 2032
- 3.3 Global Methanation Catalysts Production by Region
- 3.3.1 Global Methanation Catalysts Production by Region (2021-2026)
- 3.3.2 Global Methanation Catalysts Production by Region (2027-2032)
- 3.3.3 Global Methanation Catalysts Production Market Share by Region (2021-2032)
- 3.4 North America
- 3.5 Europe
- 3.6 China
- 3.7 Japan
4 Global Market Growth Prospects
- 4.1 Global Methanation Catalysts Revenue Estimates and Forecasts (2021-2032)
- 4.2 Global Methanation Catalysts Revenue by Region
- 4.2.1 Global Methanation Catalysts Revenue by Region: 2021 VS 2025 VS 2032
- 4.2.2 Global Methanation Catalysts Revenue by Region (2021-2026)
- 4.2.3 Global Methanation Catalysts Revenue by Region (2027-2032)
- 4.2.4 Global Methanation Catalysts Revenue Market Share by Region (2021-2032)
- 4.3 Global Methanation Catalysts Sales Estimates and Forecasts 2021-2032
- 4.4 Global Methanation Catalysts Sales by Region
- 4.4.1 Global Methanation Catalysts Sales by Region: 2021 VS 2025 VS 2032
- 4.4.2 Global Methanation Catalysts Sales by Region (2021-2026)
- 4.4.3 Global Methanation Catalysts Sales by Region (2027-2032)
- 4.4.4 Global Methanation Catalysts Sales Market Share by Region (2021-2032)
- 4.5 North America
- 4.6 Europe
- 4.7 China
- 4.8 Asia (Excluding China)
- 4.9 South America, Middle East and Africa
5 Market Competitive Landscape by Manufacturers
- 5.1 Global Methanation Catalysts Revenue by Manufacturers
- 5.1.1 Global Methanation Catalysts Revenue by Manufacturers (2021-2026)
- 5.1.2 Global Methanation Catalysts Revenue Market Share by Manufacturers (2021-2026)
- 5.1.3 Global Methanation Catalysts Manufacturers Revenue Share Top 10 and Top 5 in 2025
- 5.2 Global Methanation Catalysts Sales by Manufacturers
- 5.2.1 Global Methanation Catalysts Sales by Manufacturers (2021-2026)
- 5.2.2 Global Methanation Catalysts Sales Market Share by Manufacturers (2021-2026)
- 5.2.3 Global Methanation Catalysts Manufacturers Sales Share Top 10 and Top 5 in 2025
- 5.3 Global Methanation Catalysts Sales Price by Manufacturers (2021-2026)
- 5.4 Global Methanation Catalysts Key Manufacturers Ranking, 2024 VS 2025 VS 2026
- 5.5 Global Methanation Catalysts Key Manufacturers Manufacturing Sites & Headquarters
- 5.6 Global Methanation Catalysts Manufacturers, Product Type & Application
- 5.7 Global Methanation Catalysts Manufacturers Commercialization Time
- 5.8 Market Competitive Analysis
- 5.8.1 Global Methanation Catalysts Market CR5 and HHI
- 5.8.2 2025 Methanation Catalysts Tier 1, Tier 2, and Tier 3
6 Methanation Catalysts Market by Type
- 6.1 Global Methanation Catalysts Revenue by Type
- 6.1.1 Global Methanation Catalysts Revenue by Type (2021-2032) & (US$ Million)
- 6.1.2 Global Methanation Catalysts Revenue Market Share by Type (2021-2032)
- 6.2 Global Methanation Catalysts Sales by Type
- 6.2.1 Global Methanation Catalysts Sales by Type (2021-2032) & (t)
- 6.2.2 Global Methanation Catalysts Sales Market Share by Type (2021-2032)
- 6.3 Global Methanation Catalysts Price by Type
7 Methanation Catalysts Market by Application
- 7.1 Global Methanation Catalysts Revenue by Application
- 7.1.1 Global Methanation Catalysts Revenue by Application (2021-2032) & (US$ Million)
- 7.1.2 Global Methanation Catalysts Revenue Market Share by Application (2021-2032)
- 7.2 Global Methanation Catalysts Sales by Application
- 7.2.1 Global Methanation Catalysts Sales by Application (2021-2032) & (t)
- 7.2.2 Global Methanation Catalysts Sales Market Share by Application (2021-2032)
- 7.3 Global Methanation Catalysts Price by Application
8 Company Profiles
- 8.1 Topsoe
- 8.1.1 Topsoe Company Information
- 8.1.2 Topsoe Business Overview
- 8.1.3 Topsoe Methanation Catalysts Sales, Revenue, Price and Gross Margin (2021-2026)
- 8.1.4 Topsoe Methanation Catalysts Product Portfolio
- 8.1.5 Topsoe Recent Developments
- 8.2 Honeywell
- 8.2.1 Honeywell Company Information
- 8.2.2 Honeywell Business Overview
- 8.2.3 Honeywell Methanation Catalysts Sales, Revenue, Price and Gross Margin (2021-2026)
- 8.2.4 Honeywell Methanation Catalysts Product Portfolio
- 8.2.5 Honeywell Recent Developments
- 8.3 BASF
- 8.3.1 BASF Company Information
- 8.3.2 BASF Business Overview
- 8.3.3 BASF Methanation Catalysts Sales, Revenue, Price and Gross Margin (2021-2026)
- 8.3.4 BASF Methanation Catalysts Product Portfolio
- 8.3.5 BASF Recent Developments
- 8.4 Clariant
- 8.4.1 Clariant Company Information
- 8.4.2 Clariant Business Overview
- 8.4.3 Clariant Methanation Catalysts Sales, Revenue, Price and Gross Margin (2021-2026)
- 8.4.4 Clariant Methanation Catalysts Product Portfolio
- 8.4.5 Clariant Recent Developments
- 8.5 Heraeus Precious Metals
- 8.5.1 Heraeus Precious Metals Company Information
- 8.5.2 Heraeus Precious Metals Business Overview
- 8.5.3 Heraeus Precious Metals Methanation Catalysts Sales, Revenue, Price and Gross Margin (2021-2026)
- 8.5.4 Heraeus Precious Metals Methanation Catalysts Product Portfolio
- 8.5.5 Heraeus Precious Metals Recent Developments
- 8.6 UNICAT Catalyst Technologies
- 8.6.1 UNICAT Catalyst Technologies Company Information
- 8.6.2 UNICAT Catalyst Technologies Business Overview
- 8.6.3 UNICAT Catalyst Technologies Methanation Catalysts Sales, Revenue, Price and Gross Margin (2021-2026)
- 8.6.4 UNICAT Catalyst Technologies Methanation Catalysts Product Portfolio
- 8.6.5 UNICAT Catalyst Technologies Recent Developments
- 8.7 JGC Catalysts and Chemicals
- 8.7.1 JGC Catalysts and Chemicals Company Information
- 8.7.2 JGC Catalysts and Chemicals Business Overview
- 8.7.3 JGC Catalysts and Chemicals Methanation Catalysts Sales, Revenue, Price and Gross Margin (2021-2026)
- 8.7.4 JGC Catalysts and Chemicals Methanation Catalysts Product Portfolio
- 8.7.5 JGC Catalysts and Chemicals Recent Developments
- 8.8 TANAKA Precious Metals
- 8.8.1 TANAKA Precious Metals Company Information
- 8.8.2 TANAKA Precious Metals Business Overview
- 8.8.3 TANAKA Precious Metals Methanation Catalysts Sales, Revenue, Price and Gross Margin (2021-2026)
- 8.8.4 TANAKA Precious Metals Methanation Catalysts Product Portfolio
- 8.8.5 TANAKA Precious Metals Recent Developments
- 8.9 ITOCHU CERATECH
- 8.9.1 ITOCHU CERATECH Company Information
- 8.9.2 ITOCHU CERATECH Business Overview
- 8.9.3 ITOCHU CERATECH Methanation Catalysts Sales, Revenue, Price and Gross Margin (2021-2026)
- 8.9.4 ITOCHU CERATECH Methanation Catalysts Product Portfolio
- 8.9.5 ITOCHU CERATECH Recent Developments
- 8.10 Hulteberg Chemistry & Engineering
- 8.10.1 Hulteberg Chemistry & Engineering Company Information
- 8.10.2 Hulteberg Chemistry & Engineering Business Overview
- 8.10.3 Hulteberg Chemistry & Engineering Methanation Catalysts Sales, Revenue, Price and Gross Margin (2021-2026)
- 8.10.4 Hulteberg Chemistry & Engineering Methanation Catalysts Product Portfolio
- 8.10.5 Hulteberg Chemistry & Engineering Recent Developments
- 8.11 NIAP Katalizator
- 8.11.1 NIAP Katalizator Company Information
- 8.11.2 NIAP Katalizator Business Overview
- 8.11.3 NIAP Katalizator Methanation Catalysts Sales, Revenue, Price and Gross Margin (2021-2026)
- 8.11.4 NIAP Katalizator Methanation Catalysts Product Portfolio
- 8.11.5 NIAP Katalizator Recent Developments
- 8.12 Southwest Research and Design Institute of Chemical Industry
- 8.12.1 Southwest Research and Design Institute of Chemical Industry Company Information
- 8.12.2 Southwest Research and Design Institute of Chemical Industry Business Overview
- 8.12.3 Southwest Research and Design Institute of Chemical Industry Methanation Catalysts Sales, Revenue, Price and Gross Margin (2021-2026)
- 8.12.4 Southwest Research and Design Institute of Chemical Industry Methanation Catalysts Product Portfolio
- 8.12.5 Southwest Research and Design Institute of Chemical Industry Recent Developments
- 8.13 Sinopec Nanjing Chemical Research Institute
- 8.13.1 Sinopec Nanjing Chemical Research Institute Company Information
- 8.13.2 Sinopec Nanjing Chemical Research Institute Business Overview
- 8.13.3 Sinopec Nanjing Chemical Research Institute Methanation Catalysts Sales, Revenue, Price and Gross Margin (2021-2026)
- 8.13.4 Sinopec Nanjing Chemical Research Institute Methanation Catalysts Product Portfolio
- 8.13.5 Sinopec Nanjing Chemical Research Institute Recent Developments
- 8.14 Sichuan Shutai
- 8.14.1 Sichuan Shutai Company Information
- 8.14.2 Sichuan Shutai Business Overview
- 8.14.3 Sichuan Shutai Methanation Catalysts Sales, Revenue, Price and Gross Margin (2021-2026)
- 8.14.4 Sichuan Shutai Methanation Catalysts Product Portfolio
- 8.14.5 Sichuan Shutai Recent Developments
- 8.15 Hubei Huihuang
- 8.15.1 Hubei Huihuang Company Information
- 8.15.2 Hubei Huihuang Business Overview
- 8.15.3 Hubei Huihuang Methanation Catalysts Sales, Revenue, Price and Gross Margin (2021-2026)
- 8.15.4 Hubei Huihuang Methanation Catalysts Product Portfolio
- 8.15.5 Hubei Huihuang Recent Developments
- 8.16 Dalian Reak
- 8.16.1 Dalian Reak Company Information
- 8.16.2 Dalian Reak Business Overview
- 8.16.3 Dalian Reak Methanation Catalysts Sales, Revenue, Price and Gross Margin (2021-2026)
- 8.16.4 Dalian Reak Methanation Catalysts Product Portfolio
- 8.16.5 Dalian Reak Recent Developments
- 8.17 Dalian Kaiteli
- 8.17.1 Dalian Kaiteli Company Information
- 8.17.2 Dalian Kaiteli Business Overview
- 8.17.3 Dalian Kaiteli Methanation Catalysts Sales, Revenue, Price and Gross Margin (2021-2026)
- 8.17.4 Dalian Kaiteli Methanation Catalysts Product Portfolio
- 8.17.5 Dalian Kaiteli Recent Developments
- 8.18 Liaoning Haitai
- 8.18.1 Liaoning Haitai Company Information
- 8.18.2 Liaoning Haitai Business Overview
- 8.18.3 Liaoning Haitai Methanation Catalysts Sales, Revenue, Price and Gross Margin (2021-2026)
- 8.18.4 Liaoning Haitai Methanation Catalysts Product Portfolio
- 8.18.5 Liaoning Haitai Recent Developments
- 8.19 Jiangxi Huihua
- 8.19.1 Jiangxi Huihua Company Information
- 8.19.2 Jiangxi Huihua Business Overview
- 8.19.3 Jiangxi Huihua Methanation Catalysts Sales, Revenue, Price and Gross Margin (2021-2026)
- 8.19.4 Jiangxi Huihua Methanation Catalysts Product Portfolio
- 8.19.5 Jiangxi Huihua Recent Developments
- 8.20 REZEL Catalysts
- 8.20.1 REZEL Catalysts Company Information
- 8.20.2 REZEL Catalysts Business Overview
- 8.20.3 REZEL Catalysts Methanation Catalysts Sales, Revenue, Price and Gross Margin (2021-2026)
- 8.20.4 REZEL Catalysts Methanation Catalysts Product Portfolio
- 8.20.5 REZEL Catalysts Recent Developments
- 8.21 Wuhan Kelin
- 8.21.1 Wuhan Kelin Company Information
- 8.21.2 Wuhan Kelin Business Overview
- 8.21.3 Wuhan Kelin Methanation Catalysts Sales, Revenue, Price and Gross Margin (2021-2026)
- 8.21.4 Wuhan Kelin Methanation Catalysts Product Portfolio
- 8.21.5 Wuhan Kelin Recent Developments
- 8.22 Chengdu Shengli
- 8.22.1 Chengdu Shengli Company Information
- 8.22.2 Chengdu Shengli Business Overview
- 8.22.3 Chengdu Shengli Methanation Catalysts Sales, Revenue, Price and Gross Margin (2021-2026)
- 8.22.4 Chengdu Shengli Methanation Catalysts Product Portfolio
- 8.22.5 Chengdu Shengli Recent Developments
- 8.23 Changyi Kaite
- 8.23.1 Changyi Kaite Company Information
- 8.23.2 Changyi Kaite Business Overview
- 8.23.3 Changyi Kaite Methanation Catalysts Sales, Revenue, Price and Gross Margin (2021-2026)
- 8.23.4 Changyi Kaite Methanation Catalysts Product Portfolio
- 8.23.5 Changyi Kaite Recent Developments
- 8.24 Shandong Dengzhuo
- 8.24.1 Shandong Dengzhuo Company Information
- 8.24.2 Shandong Dengzhuo Business Overview
- 8.24.3 Shandong Dengzhuo Methanation Catalysts Sales, Revenue, Price and Gross Margin (2021-2026)
- 8.24.4 Shandong Dengzhuo Methanation Catalysts Product Portfolio
- 8.24.5 Shandong Dengzhuo Recent Developments
- 8.25 Kunshan Huahai
- 8.25.1 Kunshan Huahai Company Information
- 8.25.2 Kunshan Huahai Business Overview
- 8.25.3 Kunshan Huahai Methanation Catalysts Sales, Revenue, Price and Gross Margin (2021-2026)
- 8.25.4 Kunshan Huahai Methanation Catalysts Product Portfolio
- 8.25.5 Kunshan Huahai Recent Developments
- 8.26 Henan Xinye Catalyst
- 8.26.1 Henan Xinye Catalyst Company Information
- 8.26.2 Henan Xinye Catalyst Business Overview
- 8.26.3 Henan Xinye Catalyst Methanation Catalysts Sales, Revenue, Price and Gross Margin (2021-2026)
- 8.26.4 Henan Xinye Catalyst Methanation Catalysts Product Portfolio
- 8.26.5 Henan Xinye Catalyst Recent Developments
9 North America
- 9.1 North America Methanation Catalysts Market Size by Type
- 9.1.1 North America Methanation Catalysts Revenue by Type (2021-2032)
- 9.1.2 North America Methanation Catalysts Sales by Type (2021-2032)
- 9.1.3 North America Methanation Catalysts Price by Type (2021-2032)
- 9.2 North America Methanation Catalysts Market Size by Application
- 9.2.1 North America Methanation Catalysts Revenue by Application (2021-2032)
- 9.2.2 North America Methanation Catalysts Sales by Application (2021-2032)
- 9.2.3 North America Methanation Catalysts Price by Application (2021-2032)
- 9.3 North America Methanation Catalysts Market Size by Country
- 9.3.1 North America Methanation Catalysts Revenue Grow Rate by Country (2021 VS 2025 VS 2032)
- 9.3.2 North America Methanation Catalysts Sales by Country (2021 VS 2025 VS 2032)
- 9.3.3 North America Methanation Catalysts Price by Country (2021-2032)
- 9.3.4 United States
- 9.3.5 Canada
- 9.3.6 Mexico
10 Europe
- 10.1 Europe Methanation Catalysts Market Size by Type
- 10.1.1 Europe Methanation Catalysts Revenue by Type (2021-2032)
- 10.1.2 Europe Methanation Catalysts Sales by Type (2021-2032)
- 10.1.3 Europe Methanation Catalysts Price by Type (2021-2032)
- 10.2 Europe Methanation Catalysts Market Size by Application
- 10.2.1 Europe Methanation Catalysts Revenue by Application (2021-2032)
- 10.2.2 Europe Methanation Catalysts Sales by Application (2021-2032)
- 10.2.3 Europe Methanation Catalysts Price by Application (2021-2032)
- 10.3 Europe Methanation Catalysts Market Size by Country
- 10.3.1 Europe Methanation Catalysts Revenue Grow Rate by Country (2021 VS 2025 VS 2032)
- 10.3.2 Europe Methanation Catalysts Sales by Country (2021 VS 2025 VS 2032)
- 10.3.3 Europe Methanation Catalysts Price by Country (2021-2032)
- 10.3.4 Germany
- 10.3.5 France
- 10.3.6 U.K.
- 10.3.7 Italy
- 10.3.8 Russia
- 10.3.9 Spain
- 10.3.10 Netherlands
- 10.3.11 Switzerland
- 10.3.12 Sweden
11 China
- 11.1 China Methanation Catalysts Market Size by Type
- 11.1.1 China Methanation Catalysts Revenue by Type (2021-2032)
- 11.1.2 China Methanation Catalysts Sales by Type (2021-2032)
- 11.1.3 China Methanation Catalysts Price by Type (2021-2032)
- 11.2 China Methanation Catalysts Market Size by Application
- 11.2.1 China Methanation Catalysts Revenue by Application (2021-2032)
- 11.2.2 China Methanation Catalysts Sales by Application (2021-2032)
- 11.2.3 China Methanation Catalysts Price by Application (2021-2032)
12 Asia (Excluding China)
- 12.1 Asia Methanation Catalysts Market Size by Type
- 12.1.1 Asia Methanation Catalysts Revenue by Type (2021-2032)
- 12.1.2 Asia Methanation Catalysts Sales by Type (2021-2032)
- 12.1.3 Asia Methanation Catalysts Price by Type (2021-2032)
- 12.2 Asia Methanation Catalysts Market Size by Application
- 12.2.1 Asia Methanation Catalysts Revenue by Application (2021-2032)
- 12.2.2 Asia Methanation Catalysts Sales by Application (2021-2032)
- 12.2.3 Asia Methanation Catalysts Price by Application (2021-2032)
- 12.3 Asia Methanation Catalysts Market Size by Country
- 12.3.1 Asia Methanation Catalysts Revenue Grow Rate by Country (2021 VS 2025 VS 2032)
- 12.3.2 Asia Methanation Catalysts Sales by Country (2021 VS 2025 VS 2032)
- 12.3.3 Asia Methanation Catalysts Price by Country (2021-2032)
- 12.3.4 Japan
- 12.3.5 South Korea
- 12.3.6 India
- 12.3.7 Australia
- 12.3.8 Taiwan
- 12.3.9 Southeast Asia
13 South America, Middle East and Africa
- 13.1 SAMEA Methanation Catalysts Market Size by Type
- 13.1.1 SAMEA Methanation Catalysts Revenue by Type (2021-2032)
- 13.1.2 SAMEA Methanation Catalysts Sales by Type (2021-2032)
- 13.1.3 SAMEA Methanation Catalysts Price by Type (2021-2032)
- 13.2 SAMEA Methanation Catalysts Market Size by Application
- 13.2.1 SAMEA Methanation Catalysts Revenue by Application (2021-2032)
- 13.2.2 SAMEA Methanation Catalysts Sales by Application (2021-2032)
- 13.2.3 SAMEA Methanation Catalysts Price by Application (2021-2032)
- 13.3 SAMEA Methanation Catalysts Market Size by Country
- 13.3.1 SAMEA Methanation Catalysts Revenue Grow Rate by Country (2021 VS 2025 VS 2032)
- 13.3.2 SAMEA Methanation Catalysts Sales by Country (2021 VS 2025 VS 2032)
- 13.3.3 SAMEA Methanation Catalysts Price by Country (2021-2032)
- 13.3.4 Brazil
- 13.3.5 Argentina
- 13.3.6 Chile
- 13.3.7 Colombia
- 13.3.8 Peru
- 13.3.9 Saudi Arabia
- 13.3.10 Israel
- 13.3.11 UAE
- 13.3.12 Turkey
- 13.3.13 Iran
- 13.3.14 Egypt
14 Value Chain and Sales Channels Analysis
- 14.1 Methanation Catalysts Value Chain Analysis
- 14.1.1 Methanation Catalysts Key Raw Materials
- 14.1.2 Raw Materials Key Suppliers
- 14.1.3 Manufacturing Cost Structure
- 14.1.4 Methanation Catalysts Production Mode & Process
- 14.2 Methanation Catalysts Sales Channels Analysis
- 14.2.1 Direct Comparison with Distribution Share
- 14.2.2 Methanation Catalysts Distributors
- 14.2.3 Methanation Catalysts Customers
15 Concluding Insights
16 Appendix
- 16.1 Reasons for Doing This Study
- 16.2 Research Methodology
- 16.3 Research Process
- 16.4 Authors List of This Report
- 16.5 Data Source
- 16.5.1 Secondary Sources
- 16.5.2 Primary Sources
- 16.6 Disclaimer
GET THE RESEARCH
Choose your license.
PDF by email within 3–5 working days after payment confirmation.
Talk to an analyst