APO RESEARCH · REPORT
Heat Sinks
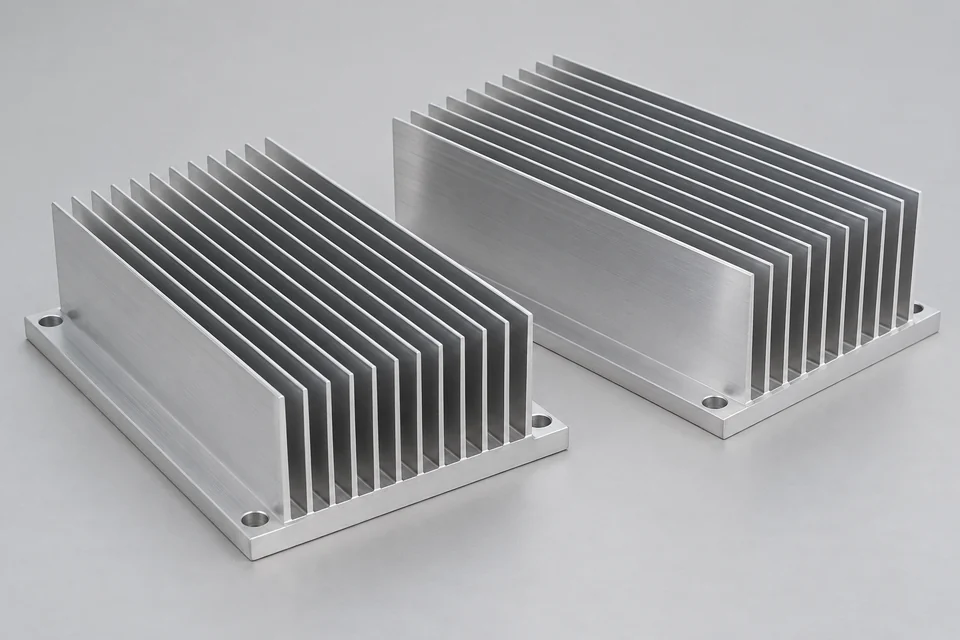
A heat sink conducts heat from a component into a larger surface from which it transfers to the surrounding fluid, usually air.
Product & engineering
Understand the product.
A heat sink is a passive thermal management device designed to absorb and dissipate heat from electronic or electromechanical components into a secondary medium—typically ambient air or liquid coolant—to ensure the component operates within its allowable temperature range. Heat conduction, described by Fourier’s law, governs the internal transfer of thermal energy from the heat source to the sink base. This is followed by convective and radiative transfer from the sink’s surface to the environment. Heat sinks are indispensable in applications where internal heat generation exceeds the device’s self-dissipating capacity, such as in CPUs, GPUs, power transistors, LED arrays, laser diodes, and high-power semiconductor modules.
The thermal efficiency of a heat sink is primarily determined by its material properties and geometric design. Copper, with thermal conductivity around 400 W/m·K, offers excellent performance but is dense and costly. Aluminum, with conductivity ranging from 200–235 W/m·K, provides a balanced trade-off between thermal performance, weight, and manufacturability. Common industrial grades include aluminum 6063 and 1050, or copper alloys such as brass and bronze. Fabrication processes include extrusion, die casting, stamping, CNC machining, and skiving, each influencing cost, fin density, and structural precision. Surface treatments like anodization or black coatings enhance emissivity and corrosion resistance, especially in passive or low-airflow environments. Fin structures—such as straight, pin, or folded fins—are engineered to maximize the convective surface area while maintaining acceptable pressure drop levels.
Heat sink performance is quantitatively evaluated using parameters such as thermal resistance (°C/W) and pressure drop (Pa or mmH₂O). Thermal resistance denotes the temperature differential per unit power dissipated; lower values indicate more effective heat dissipation. Pressure drop reflects airflow impedance and must be minimized to avoid excess fan load or thermal stagnation. For instance, a 30-watt CPU operating in 45°C air with a maximum allowable junction temperature of 75°C requires a heat sink with thermal resistance not exceeding 1.0 °C/W. Fin spacing, base thickness, and airflow orientation are optimized using computational fluid dynamics (CFD) to meet thermal budgets under varying system constraints.
At the device interface, thermal resistance is further influenced by micro-level surface irregularities that trap insulating air. To minimize this contact resistance, thermal interface materials (TIMs)—including greases, pads, or phase-change compounds—are used to fill air gaps and improve heat spreading. Mounting methods such as spring clips, screws, adhesives, or solder must provide uniform contact pressure without compromising mechanical reliability. System-level constraints such as enclosure geometry, airflow direction, acoustic limits, and resistance to vibration or shock must also be addressed, particularly in mission-critical or harsh-environment applications. Advanced thermal modules often integrate heat pipes, vapor chambers, or microchannel liquid cooling to support high heat flux densities.
Manufacturing processes play a critical role in performance and cost optimization. Extruded aluminum is prevalent for its low cost and adaptability. Die casting allows complex 3D geometries but may sacrifice thermal conductivity due to internal voids. Skived-fin designs, created by slicing and bending from a single block of metal, achieve high fin density and surface area without introducing interfacial resistance. CNC machining offers exceptional precision, preferred in aerospace or high-reliability electronics, albeit with higher unit costs. For mobile and compact systems, stamped or bonded-fin structures provide high integration density and scalability.
Emerging heat sink designs leverage advanced materials and composite structures. Graphite sheets, carbon nanotube arrays, and ceramics offer promising thermal-to-weight ratios and are increasingly applied in high-density electronic modules. Vapor chambers and embedded heat pipes utilize phase-change mechanisms for uniform temperature distribution and enhanced localized cooling. These hybrid structures are being adopted in 5G base stations, electric vehicles, data centers, and defense systems, where thermal loads exceed the dissipation capacity of conventional designs.
Application-specific requirements dictate customized thermal architectures. In data centers, densely packed fin arrays optimized for forced convection ensure thermal headroom for processors and memory. Automotive environments demand robustness to thermal cycling, shock, and contamination, often requiring sealed or liquid-cooled configurations. LED lighting systems require passive, aesthetically integrated solutions using die-cast aluminum or thermally conductive polymers. In aerospace and satellite electronics, where mass and vacuum compatibility are critical, CNC-machined aluminum or graphite-reinforced composites are utilized, often qualified under stringent outgassing and thermal vacuum standards.
Modern heat sink development is increasingly reliant on numerical simulation and physical validation. Software tools such as ANSYS Icepak, Siemens FLOTHERM, and COMSOL Multiphysics enable multiphysics modeling of airflow, temperature gradients, and interface resistance. These simulations inform design iterations prior to prototyping. Physical validation involves infrared thermography, transient thermal measurements, and wind tunnel testing to confirm compliance with design specifications. In high-reliability sectors—such as aerospace, medical, and telecommunications—accelerated stress testing (thermal cycling, power cycling, humidity exposure) is performed to validate long-term durability and interface integrity. A rigorously engineered heat sink thus represents not merely a passive component, but a critical enabler of electronic system performance, reliability, and lifecycle efficiency.
According to data compiled by APO Research, the global heat sink market has demonstrated consistent growth in both unit sales and total revenue from 2019 to 2024. Global sales volume increased from 3.78 billion units in 2019 to an estimated 4.70 billion units by 2024, reflecting a compound annual growth rate (CAGR) in the range of 1.5% to 4.7%. The market reached a temporary peak in 2021 at 4.52 billion units, followed by a moderate contraction in 2022 and a subsequent recovery through the end of the forecast period. In parallel, global revenue expanded from USD 12.19 billion in 2019 to a projected USD 17.71 billion in 2024, representing a CAGR of 7.76%. Market concentration remains evident, with major players such as Aavid Thermalloy, Alpha Novatech, and Wakefield-Vette accounting for a significant share of both revenue and unit shipments. Aavid Thermalloy is expected to maintain its position as the leading revenue contributor, reaching USD 375.83 million by 2024.
Regionally, North America continues to hold a substantial share of the global market, contributing approximately 27% to 28% of annual revenue over the analysis period. Revenue in this region is projected to grow at a CAGR of 4.81% from 2019 to 2023 and to accelerate further to 6.37% between 2024 and 2030. Total market value in North America is forecast to exceed USD 5 billion by 2024, driven largely by demand from high-performance computing, electric vehicle power electronics, and telecommunications infrastructure. Prominent regional contributors include TE Connectivity and Alpha Novatech. Europe ranks as the second-largest regional market, accounting for 20% to 22% of global revenue. The region has exhibited stable but moderate growth, with a projected CAGR of 3.74% from 2019 to 2023 and 5.25% over the longer term. Key demand drivers include automotive electronics, industrial automation, and telecommunications, although the region faces structural saturation in certain Western European economies.
Asia-Pacific remains the dominant regional market in both unit sales and revenue terms, contributing more than 48% of global market share as of 2020. The region is expected to continue its leadership, supported by a CAGR of 6.19% from 2019 to 2023 and 8.26% from 2024 to 2030. Demand is primarily fueled by consumer electronics production—including smartphones, laptops, and tablets—as well as increasing adoption in electric vehicle battery systems and power modules. Regional manufacturers such as Mecc. Al. srl and Miba Cooling have gained competitive advantage through vertical integration and strong alignment with downstream OEMs. South America has exhibited slower but stable expansion, with a projected CAGR of 4.22% from 2019 to 2023. Revenue is expected to grow from USD 0.54 billion in 2019 to USD 0.72 billion in 2024, largely supported by applications in automotive and industrial electronics. Despite positive growth, the region remains a relatively small component of the global market. The Middle East and Africa constitute a niche but gradually emerging market, contributing less than 2% of total global revenue. However, ongoing investment in industrial electronics and telecommunications infrastructure—particularly in Gulf states and selected Sub-Saharan economies—is expected to yield a CAGR of 3.72% through 2029, suggesting latent potential for long-term expansion.
Base thickness, fin geometry and material conductivity affect spreading and flow. Extrusion, machining, skiving and other fabrication routes create different geometries.
Thermal-interface resistance and airflow can dominate the installed result. More fin area does not guarantee better cooling when air cannot pass effectively.
What turns activity into demand
Demand follows cooled components and the thermal architecture around them. The heat sink, interface material, fan and complete cooling assembly have separate component value.
The commercial boundary
The heat sink, interface material, fan and complete cooling assembly have separate component value.
Selected research
Market Analysis & Forecast
Global Heat Sinks Market Analysis and Forecast 2026-2032
Market perspective
A heat sink is a passive thermal management device designed to absorb and dissipate heat from electronic or electromechanical components into a secondary medium—typically ambient air or liquid coolant—to ensure the component operates within its allowable temperature range. Heat conduction, described by Fourier’s law, governs the internal transfer of thermal energy from the heat source to the sink base. This is followed by convective and radiative transfer from the sink’s surface to the environment. Heat sinks are indispensable in applications where internal heat generation exceeds the device’s self-dissipating capacity, such as in CPUs, GPUs, power transistors, LED arrays, laser diodes, and high-power semiconductor modules.
The thermal efficiency of a heat sink is primarily determined by its material properties and geometric design. Copper, with thermal conductivity around 400 W/m·K, offers excellent performance but is dense and costly. Aluminum, with conductivity ranging from 200–235 W/m·K, provides a balanced trade-off between thermal performance, weight, and manufacturability. Common industrial grades include aluminum 6063 and 1050, or copper alloys such as brass and bronze. Fabrication processes include extrusion, die casting, stamping, CNC machining, and skiving, each influencing cost, fin density, and structural precision. Surface treatments like anodization or black coatings enhance emissivity and corrosion resistance, especially in passive or low-airflow environments. Fin structures—such as straight, pin, or folded fins—are engineered to maximize the convective surface area while maintaining acceptable pressure drop levels.
Heat sink performance is quantitatively evaluated using parameters such as thermal resistance (°C/W) and pressure drop (Pa or mmH₂O). Thermal resistance denotes the temperature differential per unit power dissipated; lower values indicate more effective heat dissipation. Pressure drop reflects airflow impedance and must be minimized to avoid excess fan load or thermal stagnation. For instance, a 30-watt CPU operating in 45°C air with a maximum allowable junction temperature of 75°C requires a heat sink with thermal resistance not exceeding 1.0 °C/W. Fin spacing, base thickness, and airflow orientation are optimized using computational fluid dynamics (CFD) to meet thermal budgets under varying system constraints.
Read the full market overview
At the device interface, thermal resistance is further influenced by micro-level surface irregularities that trap insulating air. To minimize this contact resistance, thermal interface materials (TIMs)—including greases, pads, or phase-change compounds—are used to fill air gaps and improve heat spreading. Mounting methods such as spring clips, screws, adhesives, or solder must provide uniform contact pressure without compromising mechanical reliability. System-level constraints such as enclosure geometry, airflow direction, acoustic limits, and resistance to vibration or shock must also be addressed, particularly in mission-critical or harsh-environment applications. Advanced thermal modules often integrate heat pipes, vapor chambers, or microchannel liquid cooling to support high heat flux densities.
Manufacturing processes play a critical role in performance and cost optimization. Extruded aluminum is prevalent for its low cost and adaptability. Die casting allows complex 3D geometries but may sacrifice thermal conductivity due to internal voids. Skived-fin designs, created by slicing and bending from a single block of metal, achieve high fin density and surface area without introducing interfacial resistance. CNC machining offers exceptional precision, preferred in aerospace or high-reliability electronics, albeit with higher unit costs. For mobile and compact systems, stamped or bonded-fin structures provide high integration density and scalability.
Emerging heat sink designs leverage advanced materials and composite structures. Graphite sheets, carbon nanotube arrays, and ceramics offer promising thermal-to-weight ratios and are increasingly applied in high-density electronic modules. Vapor chambers and embedded heat pipes utilize phase-change mechanisms for uniform temperature distribution and enhanced localized cooling. These hybrid structures are being adopted in 5G base stations, electric vehicles, data centers, and defense systems, where thermal loads exceed the dissipation capacity of conventional designs.
Application-specific requirements dictate customized thermal architectures. In data centers, densely packed fin arrays optimized for forced convection ensure thermal headroom for processors and memory. Automotive environments demand robustness to thermal cycling, shock, and contamination, often requiring sealed or liquid-cooled configurations. LED lighting systems require passive, aesthetically integrated solutions using die-cast aluminum or thermally conductive polymers. In aerospace and satellite electronics, where mass and vacuum compatibility are critical, CNC-machined aluminum or graphite-reinforced composites are utilized, often qualified under stringent outgassing and thermal vacuum standards.
Modern heat sink development is increasingly reliant on numerical simulation and physical validation. Software tools such as ANSYS Icepak, Siemens FLOTHERM, and COMSOL Multiphysics enable multiphysics modeling of airflow, temperature gradients, and interface resistance. These simulations inform design iterations prior to prototyping. Physical validation involves infrared thermography, transient thermal measurements, and wind tunnel testing to confirm compliance with design specifications. In high-reliability sectors—such as aerospace, medical, and telecommunications—accelerated stress testing (thermal cycling, power cycling, humidity exposure) is performed to validate long-term durability and interface integrity. A rigorously engineered heat sink thus represents not merely a passive component, but a critical enabler of electronic system performance, reliability, and lifecycle efficiency.
According to data compiled by APO Research, the global heat sink market has demonstrated consistent growth in both unit sales and total revenue from 2019 to 2024. Global sales volume increased from 3.78 billion units in 2019 to an estimated 4.70 billion units by 2024, reflecting a compound annual growth rate (CAGR) in the range of 1.5% to 4.7%. The market reached a temporary peak in 2021 at 4.52 billion units, followed by a moderate contraction in 2022 and a subsequent recovery through the end of the forecast period. In parallel, global revenue expanded from USD 12.19 billion in 2019 to a projected USD 17.71 billion in 2024, representing a CAGR of 7.76%. Market concentration remains evident, with major players such as Aavid Thermalloy, Alpha Novatech, and Wakefield-Vette accounting for a significant share of both revenue and unit shipments. Aavid Thermalloy is expected to maintain its position as the leading revenue contributor, reaching USD 375.83 million by 2024.
Regionally, North America continues to hold a substantial share of the global market, contributing approximately 27% to 28% of annual revenue over the analysis period. Revenue in this region is projected to grow at a CAGR of 4.81% from 2019 to 2023 and to accelerate further to 6.37% between 2024 and 2030. Total market value in North America is forecast to exceed USD 5 billion by 2024, driven largely by demand from high-performance computing, electric vehicle power electronics, and telecommunications infrastructure. Prominent regional contributors include TE Connectivity and Alpha Novatech. Europe ranks as the second-largest regional market, accounting for 20% to 22% of global revenue. The region has exhibited stable but moderate growth, with a projected CAGR of 3.74% from 2019 to 2023 and 5.25% over the longer term. Key demand drivers include automotive electronics, industrial automation, and telecommunications, although the region faces structural saturation in certain Western European economies.
Asia-Pacific remains the dominant regional market in both unit sales and revenue terms, contributing more than 48% of global market share as of 2020. The region is expected to continue its leadership, supported by a CAGR of 6.19% from 2019 to 2023 and 8.26% from 2024 to 2030. Demand is primarily fueled by consumer electronics production—including smartphones, laptops, and tablets—as well as increasing adoption in electric vehicle battery systems and power modules. Regional manufacturers such as Mecc. Al. srl and Miba Cooling have gained competitive advantage through vertical integration and strong alignment with downstream OEMs. South America has exhibited slower but stable expansion, with a projected CAGR of 4.22% from 2019 to 2023. Revenue is expected to grow from USD 0.54 billion in 2019 to USD 0.72 billion in 2024, largely supported by applications in automotive and industrial electronics. Despite positive growth, the region remains a relatively small component of the global market. The Middle East and Africa constitute a niche but gradually emerging market, contributing less than 2% of total global revenue. However, ongoing investment in industrial electronics and telecommunications infrastructure—particularly in Gulf states and selected Sub-Saharan economies—is expected to yield a CAGR of 3.72% through 2029, suggesting latent potential for long-term expansion.
The global Heat Sinks market is projected to grow from US$ million in 2026 to US$ million by 2032, at a Compound Annual Growth Rate (CAGR) of % during the forecast period.
Heat Sinks's global sales reached XX (M Pcs) with a value of US$ XX Million, marking an change of XX% compared to the previous year. This performance has positioned Aavid Thermalloy (Boyd Corporation) as the global sales leader, a title it has maintained for several consecutive years. Notably, Aavid Thermalloy (Boyd Corporation)'s performance in primary markets is also remarkable. In the Chinese market, sales were XX (M Pcs), a change of XX% from the previous year. In Europe, sales were XX (M Pcs), showing a year-on-year of XX%. In the US, sales were XX (M Pcs), a year-on-year change of XX%.
The major global manufacturers in the Heat Sinks market include Aavid Thermalloy (Boyd Corporation), Alpha Novatech, Wakefield-Vette, Radian Thermal Products, Delta Electronics, Mecc.Al srl, Ohmite, LemTech and Miba Cooling (Former DAU Austria), etc. In 2025, the top three vendors accounted for approximately % of the revenue.
In terms of production side, this report researches the Heat Sinks production, growth rate, market share by manufacturers and by region (region level and country level), from 2021 to 2026, and forecast to 2032.
In terms of consumption side, this report focuses on the sales of Heat Sinks by region (region level and country level), by Company, by Type and by Application. from 2021 to 2026 and forecast to 2032.
This report presents an overview of global market for Heat Sinks, capacity, output, revenue and price. Analyses of the global market trends, with historic market revenue or sales data for 2021 - 2025, estimates for 2026, and projections of CAGR through 2032.
This report researches the key producers of Heat Sinks, also provides the consumption of main regions and countries. Of the upcoming market potential for Heat Sinks, and key regions or countries of focus to forecast this market into various segments and sub-segments. Country specific data and market value analysis for the U.S., Canada, Mexico, Brazil, China, Japan, South Korea, Southeast Asia, India, Germany, the U.K., Italy, Middle East, Africa, and Other Countries.
This report focuses on the Heat Sinks sales, revenue, market share and industry ranking of main manufacturers, data from 2021 to 2026. Identification of the major stakeholders in the global Heat Sinks market, and analysis of their competitive landscape and market positioning based on recent developments and segmental revenues. This report will help stakeholders to understand the competitive landscape and gain more insights and position their businesses and market strategies in a better way.
This report analyzes the segments data by Type and by Application, sales, revenue, and price, from 2021 to 2032. Evaluation and forecast the market size for Heat Sinks sales, projected growth trends, production technology, application and end-user industry.
Heat Sinks Segment by Company
Aavid Thermalloy (Boyd Corporation)
Alpha Novatech
Wakefield-Vette
Radian Thermal Products
Delta Electronics
Mecc.Al srl
Ohmite
LemTech
Miba Cooling (Former DAU Austria)
Sunonwealth Electric Machine Industry
Fischer Elektronik
Cool Innovations
TE Connectivity
T-Global Technology
Same Sky (formerly CUI Devices)
Malico
Heat Sinks Segment by Type
Aluminum Heat Sink
Copper Heat Sink
Copper Aluminum Heat Sink
Others
Heat Sinks Segment by Application
Consumer Electronics
Automotive Electronics
Computing & Data Center
Telecommunications
Industrial Electronics
Medical Electronics
Power Electronics
Other
Heat Sinks Segment by Region
North America
United States
Canada
Mexico
Europe
Germany
France
U.K.
Italy
Russia
Spain
Netherlands
Switzerland
Sweden
Poland
Asia-Pacific
China
Japan
South Korea
India
Australia
Taiwan
Southeast Asia
South America
Brazil
Argentina
Chile
Middle East & Africa
Egypt
South Africa
Israel
Türkiye
GCC Countries
Study Objectives
1. To analyze and research the global status and future forecast, involving, production, value, consumption, growth rate (CAGR), market share, historical and forecast.
2. To present the key manufacturers, capacity, production, revenue, market share, and Recent Developments.
3. To split the breakdown data by regions, type, manufacturers, and Application.
4. To analyze the global and key regions market potential and advantage, opportunity and challenge, restraints, and risks.
5. To identify significant trends, drivers, influence factors in global and regions.
6. To analyze competitive developments such as expansions, agreements, new product launches, and acquisitions in the market.
Reasons to Buy This Report
1. This report will help the readers to understand the competition within the industries and strategies for the competitive environment to enhance the potential profit. The report also focuses on the competitive landscape of the global Heat Sinks market, and introduces in detail the market share, industry ranking, competitor ecosystem, market performance, new product development, operation situation, expansion, and acquisition. etc. of the main players, which helps the readers to identify the main competitors and deeply understand the competition pattern of the market.
2. This report will help stakeholders to understand the global industry status and trends of Heat Sinks and provides them with information on key market drivers, restraints, challenges, and opportunities.
3. This report will help stakeholders to understand competitors better and gain more insights to strengthen their position in their businesses. The competitive landscape section includes the market share and rank (in volume and value), competitor ecosystem, new product development, expansion, and acquisition.
4. This report stays updated with novel technology integration, features, and the latest developments in the market.
5. This report helps stakeholders to gain insights into which regions to target globally.
6. This report helps stakeholders to gain insights into the end-user perception concerning the adoption of Heat Sinks.
7. This report helps stakeholders to identify some of the key players in the market and understand their valuable contribution.
Chapter Outline
Chapter 1: Introduces the report scope of the report, executive summary of different market segments (by type and by application, etc), including the market size of each market segment, future development potential, and so on. It offers a high-level view of the current state of the market and its likely evolution in the short to mid-term, and long term.
Chapter 2: Introduces the market dynamics, latest developments of the market, the driving factors and restrictive factors of the market, the challenges and risks faced by manufacturers in the industry, and the analysis of relevant policies in the industry.
Chapter 3: Heat Sinks production/output of global and key producers (regions/countries). It provides a quantitative analysis of the production, and development potential of each producer in the next six years.
Chapter 4: Sales (consumption), revenue of Heat Sinks in global, regional level and country level. It provides a quantitative analysis of the market size and development potential of each region and its main countries and introduces the market development, future development prospects, market space of each country in the world.
Chapter 5: Detailed analysis of Heat Sinks manufacturers competitive landscape, price, sales, revenue, market share and industry ranking, latest development plan, merger, and acquisition information, etc.
Chapter 6: Provides the analysis of various market segments by type, covering the sales, revenue, average price, and development potential of each market segment, to help readers find the blue ocean market in different market segments.
Chapter 7: Provides the analysis of various market segments by application, covering the sales, revenue, average price, and development potential of each market segment, to help readers find the blue ocean market in different downstream markets.
Chapter 8: Provides profiles of key manufacturers, introducing the basic situation of the main companies in the market in detail, including product descriptions and specifications, Heat Sinks sales, revenue, price, gross margin, and recent development, etc.
Chapter 9: North America by type, by application and by country, sales, and revenue for each segment.
Chapter 10: Europe by type, by application and by country, sales, and revenue for each segment.
Chapter 11: China by type, by application, sales, and revenue for each segment.
Chapter 12: Asia (Excluding China) by type, by application and by region, sales, and revenue for each segment.
Chapter 13: South America, Middle East and Africa by type, by application and by country, sales, and revenue for each segment.
Chapter 14: Analysis of industrial chain, sales channel, key raw materials, distributors and customers.
Chapter 15: The main concluding insights of the report.
More report detail
Tables and figures
Scope & coverage.
Types
- Aluminum Heat Sink
- Copper Heat Sink
- Copper Aluminum Heat Sink
- Others
Applications
- Consumer Electronics
- Automotive Electronics
- Computing & Data Center
- Telecommunications
- Industrial Electronics
- Medical Electronics
- Power Electronics
- Other
Companies covered
- Aavid Thermalloy (Boyd Corporation)
- Alpha Novatech
- Wakefield-Vette
- Radian Thermal Products
- Delta Electronics
- Mecc.Al srl
- Ohmite
- LemTech
- Miba Cooling (Former DAU Austria)
- Sunonwealth Electric Machine Industry
- Fischer Elektronik
- Cool Innovations
- TE Connectivity
- T-Global Technology
- Same Sky (formerly CUI Devices)
- Malico
Inside the report.
1 Market Overview
- 1.1 Product Definition
- 1.2 Heat Sinks Market by Type
- 1.2.1 Global Heat Sinks Market Size by Type, 2021 VS 2025 VS 2032
- 1.2.2 Aluminum Heat Sink
- 1.2.3 Copper Heat Sink
- 1.2.4 Copper Aluminum Heat Sink
- 1.2.5 Others
- 1.3 Heat Sinks Market by Application
- 1.3.1 Global Heat Sinks Market Size by Application, 2021 VS 2025 VS 2032
- 1.3.2 Consumer Electronics
- 1.3.3 Automotive Electronics
- 1.3.4 Computing & Data Center
- 1.3.5 Telecommunications
- 1.3.6 Industrial Electronics
- 1.3.7 Medical Electronics
- 1.3.8 Power Electronics
- 1.3.9 Other
- 1.4 Assumptions and Limitations
- 1.5 Study Goals and Objectives
2 Heat Sinks Market Dynamics
- 2.1 Heat Sinks Industry Trends
- 2.2 Heat Sinks Industry Drivers
- 2.3 Heat Sinks Industry Opportunities and Challenges
- 2.4 Heat Sinks Industry Restraints
3 Global Heat Sinks Production Overview
- 3.1 Global Heat Sinks Production Capacity (2021-2032)
- 3.2 Global Heat Sinks Production by Region: 2021 VS 2025 VS 2032
- 3.3 Global Heat Sinks Production by Region
- 3.3.1 Global Heat Sinks Production by Region (2021-2026)
- 3.3.2 Global Heat Sinks Production by Region (2027-2032)
- 3.3.3 Global Heat Sinks Production Market Share by Region (2021-2032)
- 3.4 North America
- 3.5 Europe
- 3.6 China
- 3.7 Japan
4 Global Market Growth Prospects
- 4.1 Global Heat Sinks Revenue Estimates and Forecasts (2021-2032)
- 4.2 Global Heat Sinks Revenue by Region
- 4.2.1 Global Heat Sinks Revenue by Region: 2021 VS 2025 VS 2032
- 4.2.2 Global Heat Sinks Revenue by Region (2021-2026)
- 4.2.3 Global Heat Sinks Revenue by Region (2027-2032)
- 4.2.4 Global Heat Sinks Revenue Market Share by Region (2021-2032)
- 4.3 Global Heat Sinks Sales Estimates and Forecasts 2021-2032
- 4.4 Global Heat Sinks Sales by Region
- 4.4.1 Global Heat Sinks Sales by Region: 2021 VS 2025 VS 2032
- 4.4.2 Global Heat Sinks Sales by Region (2021-2026)
- 4.4.3 Global Heat Sinks Sales by Region (2027-2032)
- 4.4.4 Global Heat Sinks Sales Market Share by Region (2021-2032)
- 4.5 North America
- 4.6 Europe
- 4.7 China
- 4.8 Asia (Excluding China)
- 4.9 South America, Middle East and Africa
5 Market Competitive Landscape by Manufacturers
- 5.1 Global Heat Sinks Revenue by Manufacturers
- 5.1.1 Global Heat Sinks Revenue by Manufacturers (2021-2026)
- 5.1.2 Global Heat Sinks Revenue Market Share by Manufacturers (2021-2026)
- 5.1.3 Global Heat Sinks Manufacturers Revenue Share Top 10 and Top 5 in 2025
- 5.2 Global Heat Sinks Sales by Manufacturers
- 5.2.1 Global Heat Sinks Sales by Manufacturers (2021-2026)
- 5.2.2 Global Heat Sinks Sales Market Share by Manufacturers (2021-2026)
- 5.2.3 Global Heat Sinks Manufacturers Sales Share Top 10 and Top 5 in 2025
- 5.3 Global Heat Sinks Sales Price by Manufacturers (2021-2026)
- 5.4 Global Heat Sinks Key Manufacturers Ranking, 2024 VS 2025 VS 2026
- 5.5 Global Heat Sinks Key Manufacturers Manufacturing Sites & Headquarters
- 5.6 Global Heat Sinks Manufacturers, Product Type & Application
- 5.7 Global Heat Sinks Manufacturers Commercialization Time
- 5.8 Market Competitive Analysis
- 5.8.1 Global Heat Sinks Market CR5 and HHI
- 5.8.2 2025 Heat Sinks Tier 1, Tier 2, and Tier 3
6 Heat Sinks Market by Type
- 6.1 Global Heat Sinks Revenue by Type
- 6.1.1 Global Heat Sinks Revenue by Type (2021-2032) & (US$ Million)
- 6.1.2 Global Heat Sinks Revenue Market Share by Type (2021-2032)
- 6.2 Global Heat Sinks Sales by Type
- 6.2.1 Global Heat Sinks Sales by Type (2021-2032) & (M Pcs)
- 6.2.2 Global Heat Sinks Sales Market Share by Type (2021-2032)
- 6.3 Global Heat Sinks Price by Type
7 Heat Sinks Market by Application
- 7.1 Global Heat Sinks Revenue by Application
- 7.1.1 Global Heat Sinks Revenue by Application (2021-2032) & (US$ Million)
- 7.1.2 Global Heat Sinks Revenue Market Share by Application (2021-2032)
- 7.2 Global Heat Sinks Sales by Application
- 7.2.1 Global Heat Sinks Sales by Application (2021-2032) & (M Pcs)
- 7.2.2 Global Heat Sinks Sales Market Share by Application (2021-2032)
- 7.3 Global Heat Sinks Price by Application
8 Company Profiles
- 8.1 Aavid Thermalloy (Boyd Corporation)
- 8.1.1 Aavid Thermalloy (Boyd Corporation) Company Information
- 8.1.2 Aavid Thermalloy (Boyd Corporation) Business Overview
- 8.1.3 Aavid Thermalloy (Boyd Corporation) Heat Sinks Sales, Revenue, Price and Gross Margin (2021-2026)
- 8.1.4 Aavid Thermalloy (Boyd Corporation) Heat Sinks Product Portfolio
- 8.1.5 Aavid Thermalloy (Boyd Corporation) Recent Developments
- 8.2 Alpha Novatech
- 8.2.1 Alpha Novatech Company Information
- 8.2.2 Alpha Novatech Business Overview
- 8.2.3 Alpha Novatech Heat Sinks Sales, Revenue, Price and Gross Margin (2021-2026)
- 8.2.4 Alpha Novatech Heat Sinks Product Portfolio
- 8.2.5 Alpha Novatech Recent Developments
- 8.3 Wakefield-Vette
- 8.3.1 Wakefield-Vette Company Information
- 8.3.2 Wakefield-Vette Business Overview
- 8.3.3 Wakefield-Vette Heat Sinks Sales, Revenue, Price and Gross Margin (2021-2026)
- 8.3.4 Wakefield-Vette Heat Sinks Product Portfolio
- 8.3.5 Wakefield-Vette Recent Developments
- 8.4 Radian Thermal Products
- 8.4.1 Radian Thermal Products Company Information
- 8.4.2 Radian Thermal Products Business Overview
- 8.4.3 Radian Thermal Products Heat Sinks Sales, Revenue, Price and Gross Margin (2021-2026)
- 8.4.4 Radian Thermal Products Heat Sinks Product Portfolio
- 8.4.5 Radian Thermal Products Recent Developments
- 8.5 Delta Electronics
- 8.5.1 Delta Electronics Company Information
- 8.5.2 Delta Electronics Business Overview
- 8.5.3 Delta Electronics Heat Sinks Sales, Revenue, Price and Gross Margin (2021-2026)
- 8.5.4 Delta Electronics Heat Sinks Product Portfolio
- 8.5.5 Delta Electronics Recent Developments
- 8.6 Mecc.Al srl
- 8.6.1 Mecc.Al srl Company Information
- 8.6.2 Mecc.Al srl Business Overview
- 8.6.3 Mecc.Al srl Heat Sinks Sales, Revenue, Price and Gross Margin (2021-2026)
- 8.6.4 Mecc.Al srl Heat Sinks Product Portfolio
- 8.6.5 Mecc.Al srl Recent Developments
- 8.7 Ohmite
- 8.7.1 Ohmite Company Information
- 8.7.2 Ohmite Business Overview
- 8.7.3 Ohmite Heat Sinks Sales, Revenue, Price and Gross Margin (2021-2026)
- 8.7.4 Ohmite Heat Sinks Product Portfolio
- 8.7.5 Ohmite Recent Developments
- 8.8 LemTech
- 8.8.1 LemTech Company Information
- 8.8.2 LemTech Business Overview
- 8.8.3 LemTech Heat Sinks Sales, Revenue, Price and Gross Margin (2021-2026)
- 8.8.4 LemTech Heat Sinks Product Portfolio
- 8.8.5 LemTech Recent Developments
- 8.9 Miba Cooling (Former DAU Austria)
- 8.9.1 Miba Cooling (Former DAU Austria) Company Information
- 8.9.2 Miba Cooling (Former DAU Austria) Business Overview
- 8.9.3 Miba Cooling (Former DAU Austria) Heat Sinks Sales, Revenue, Price and Gross Margin (2021-2026)
- 8.9.4 Miba Cooling (Former DAU Austria) Heat Sinks Product Portfolio
- 8.9.5 Miba Cooling (Former DAU Austria) Recent Developments
- 8.10 Sunonwealth Electric Machine Industry
- 8.10.1 Sunonwealth Electric Machine Industry Company Information
- 8.10.2 Sunonwealth Electric Machine Industry Business Overview
- 8.10.3 Sunonwealth Electric Machine Industry Heat Sinks Sales, Revenue, Price and Gross Margin (2021-2026)
- 8.10.4 Sunonwealth Electric Machine Industry Heat Sinks Product Portfolio
- 8.10.5 Sunonwealth Electric Machine Industry Recent Developments
- 8.11 Fischer Elektronik
- 8.11.1 Fischer Elektronik Company Information
- 8.11.2 Fischer Elektronik Business Overview
- 8.11.3 Fischer Elektronik Heat Sinks Sales, Revenue, Price and Gross Margin (2021-2026)
- 8.11.4 Fischer Elektronik Heat Sinks Product Portfolio
- 8.11.5 Fischer Elektronik Recent Developments
- 8.12 Cool Innovations
- 8.12.1 Cool Innovations Company Information
- 8.12.2 Cool Innovations Business Overview
- 8.12.3 Cool Innovations Heat Sinks Sales, Revenue, Price and Gross Margin (2021-2026)
- 8.12.4 Cool Innovations Heat Sinks Product Portfolio
- 8.12.5 Cool Innovations Recent Developments
- 8.13 TE Connectivity
- 8.13.1 TE Connectivity Company Information
- 8.13.2 TE Connectivity Business Overview
- 8.13.3 TE Connectivity Heat Sinks Sales, Revenue, Price and Gross Margin (2021-2026)
- 8.13.4 TE Connectivity Heat Sinks Product Portfolio
- 8.13.5 TE Connectivity Recent Developments
- 8.14 T-Global Technology
- 8.14.1 T-Global Technology Company Information
- 8.14.2 T-Global Technology Business Overview
- 8.14.3 T-Global Technology Heat Sinks Sales, Revenue, Price and Gross Margin (2021-2026)
- 8.14.4 T-Global Technology Heat Sinks Product Portfolio
- 8.14.5 T-Global Technology Recent Developments
- 8.15 Same Sky (formerly CUI Devices)
- 8.15.1 Same Sky (formerly CUI Devices) Company Information
- 8.15.2 Same Sky (formerly CUI Devices) Business Overview
- 8.15.3 Same Sky (formerly CUI Devices) Heat Sinks Sales, Revenue, Price and Gross Margin (2021-2026)
- 8.15.4 Same Sky (formerly CUI Devices) Heat Sinks Product Portfolio
- 8.15.5 Same Sky (formerly CUI Devices) Recent Developments
- 8.16 Malico
- 8.16.1 Malico Company Information
- 8.16.2 Malico Business Overview
- 8.16.3 Malico Heat Sinks Sales, Revenue, Price and Gross Margin (2021-2026)
- 8.16.4 Malico Heat Sinks Product Portfolio
- 8.16.5 Malico Recent Developments
9 North America
- 9.1 North America Heat Sinks Market Size by Type
- 9.1.1 North America Heat Sinks Revenue by Type (2021-2032)
- 9.1.2 North America Heat Sinks Sales by Type (2021-2032)
- 9.1.3 North America Heat Sinks Price by Type (2021-2032)
- 9.2 North America Heat Sinks Market Size by Application
- 9.2.1 North America Heat Sinks Revenue by Application (2021-2032)
- 9.2.2 North America Heat Sinks Sales by Application (2021-2032)
- 9.2.3 North America Heat Sinks Price by Application (2021-2032)
- 9.3 North America Heat Sinks Market Size by Country
- 9.3.1 North America Heat Sinks Revenue Grow Rate by Country (2021 VS 2025 VS 2032)
- 9.3.2 North America Heat Sinks Sales by Country (2021 VS 2025 VS 2032)
- 9.3.3 North America Heat Sinks Price by Country (2021-2032)
- 9.3.4 United States
- 9.3.5 Canada
- 9.3.6 Mexico
10 Europe
- 10.1 Europe Heat Sinks Market Size by Type
- 10.1.1 Europe Heat Sinks Revenue by Type (2021-2032)
- 10.1.2 Europe Heat Sinks Sales by Type (2021-2032)
- 10.1.3 Europe Heat Sinks Price by Type (2021-2032)
- 10.2 Europe Heat Sinks Market Size by Application
- 10.2.1 Europe Heat Sinks Revenue by Application (2021-2032)
- 10.2.2 Europe Heat Sinks Sales by Application (2021-2032)
- 10.2.3 Europe Heat Sinks Price by Application (2021-2032)
- 10.3 Europe Heat Sinks Market Size by Country
- 10.3.1 Europe Heat Sinks Revenue Grow Rate by Country (2021 VS 2025 VS 2032)
- 10.3.2 Europe Heat Sinks Sales by Country (2021 VS 2025 VS 2032)
- 10.3.3 Europe Heat Sinks Price by Country (2021-2032)
- 10.3.4 Germany
- 10.3.5 France
- 10.3.6 U.K.
- 10.3.7 Italy
- 10.3.8 Russia
- 10.3.9 Spain
- 10.3.10 Netherlands
- 10.3.11 Switzerland
- 10.3.12 Sweden
11 China
- 11.1 China Heat Sinks Market Size by Type
- 11.1.1 China Heat Sinks Revenue by Type (2021-2032)
- 11.1.2 China Heat Sinks Sales by Type (2021-2032)
- 11.1.3 China Heat Sinks Price by Type (2021-2032)
- 11.2 China Heat Sinks Market Size by Application
- 11.2.1 China Heat Sinks Revenue by Application (2021-2032)
- 11.2.2 China Heat Sinks Sales by Application (2021-2032)
- 11.2.3 China Heat Sinks Price by Application (2021-2032)
12 Asia (Excluding China)
- 12.1 Asia Heat Sinks Market Size by Type
- 12.1.1 Asia Heat Sinks Revenue by Type (2021-2032)
- 12.1.2 Asia Heat Sinks Sales by Type (2021-2032)
- 12.1.3 Asia Heat Sinks Price by Type (2021-2032)
- 12.2 Asia Heat Sinks Market Size by Application
- 12.2.1 Asia Heat Sinks Revenue by Application (2021-2032)
- 12.2.2 Asia Heat Sinks Sales by Application (2021-2032)
- 12.2.3 Asia Heat Sinks Price by Application (2021-2032)
- 12.3 Asia Heat Sinks Market Size by Country
- 12.3.1 Asia Heat Sinks Revenue Grow Rate by Country (2021 VS 2025 VS 2032)
- 12.3.2 Asia Heat Sinks Sales by Country (2021 VS 2025 VS 2032)
- 12.3.3 Asia Heat Sinks Price by Country (2021-2032)
- 12.3.4 Japan
- 12.3.5 South Korea
- 12.3.6 India
- 12.3.7 Australia
- 12.3.8 Taiwan
- 12.3.9 Southeast Asia
13 South America, Middle East and Africa
- 13.1 SAMEA Heat Sinks Market Size by Type
- 13.1.1 SAMEA Heat Sinks Revenue by Type (2021-2032)
- 13.1.2 SAMEA Heat Sinks Sales by Type (2021-2032)
- 13.1.3 SAMEA Heat Sinks Price by Type (2021-2032)
- 13.2 SAMEA Heat Sinks Market Size by Application
- 13.2.1 SAMEA Heat Sinks Revenue by Application (2021-2032)
- 13.2.2 SAMEA Heat Sinks Sales by Application (2021-2032)
- 13.2.3 SAMEA Heat Sinks Price by Application (2021-2032)
- 13.3 SAMEA Heat Sinks Market Size by Country
- 13.3.1 SAMEA Heat Sinks Revenue Grow Rate by Country (2021 VS 2025 VS 2032)
- 13.3.2 SAMEA Heat Sinks Sales by Country (2021 VS 2025 VS 2032)
- 13.3.3 SAMEA Heat Sinks Price by Country (2021-2032)
- 13.3.4 Brazil
- 13.3.5 Argentina
- 13.3.6 Chile
- 13.3.7 Colombia
- 13.3.8 Peru
- 13.3.9 Saudi Arabia
- 13.3.10 Israel
- 13.3.11 UAE
- 13.3.12 Turkey
- 13.3.13 Iran
- 13.3.14 Egypt
14 Value Chain and Sales Channels Analysis
- 14.1 Heat Sinks Value Chain Analysis
- 14.1.1 Heat Sinks Key Raw Materials
- 14.1.2 Raw Materials Key Suppliers
- 14.1.3 Manufacturing Cost Structure
- 14.1.4 Heat Sinks Production Mode & Process
- 14.2 Heat Sinks Sales Channels Analysis
- 14.2.1 Direct Comparison with Distribution Share
- 14.2.2 Heat Sinks Distributors
- 14.2.3 Heat Sinks Customers
15 Concluding Insights
16 Appendix
- 16.1 Reasons for Doing This Study
- 16.2 Research Methodology
- 16.3 Research Process
- 16.4 Authors List of This Report
- 16.5 Data Source
- 16.5.1 Secondary Sources
- 16.5.2 Primary Sources
- 16.6 Disclaimer
GET THE RESEARCH
Choose your license.
Choose who needs access.
All options are for this report and research series.
PDF by email within 3–5 working days after payment confirmation.
Talk to an analyst