APO RESEARCH · REPORT
Automotive Jounce Bumper
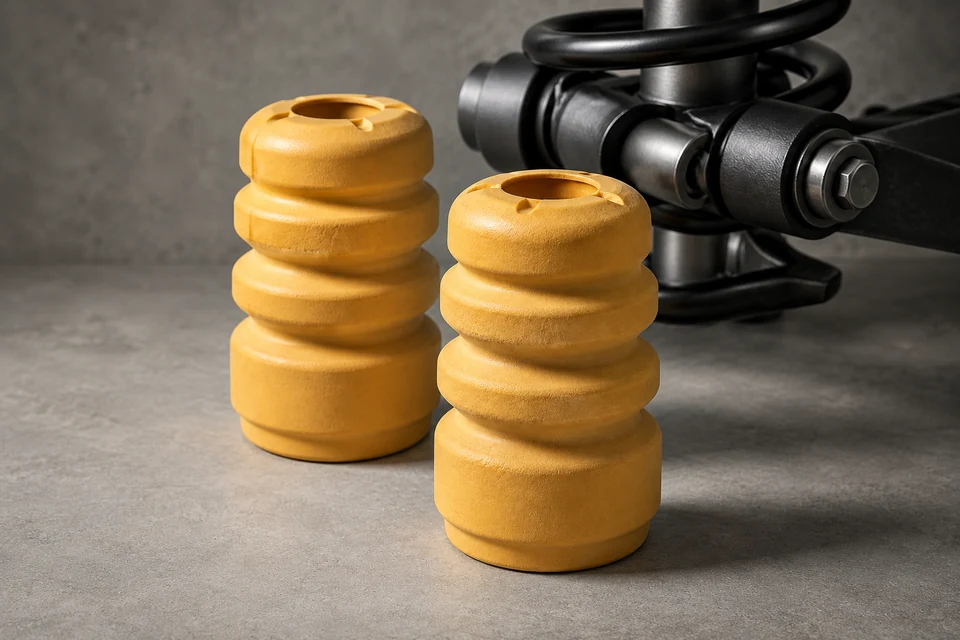
A jounce bumper is a compressible suspension component that controls loads as wheel travel approaches the compression limit.
Product & engineering
Understand the product.
Automotive Jounce Bumper is an elastomeric auxiliary spring and compression travel limiting component integrated into the suspension load path, typically around the damper piston rod, within strut and shock absorber assemblies, or at dedicated axle and suspension stops. Engagement occurs during increasing jounce travel, where the component adds a strongly progressive spring characteristic to the primary suspension and controls terminal compression before mechanical contact or excessive damper travel. The resulting force versus displacement curve is governed by material modulus, cellular structure, apparent density, free height, external contour, internal cavities, effective compressed volume, contact area progression and geometric confinement. These parameters determine engagement point, rate progression, maximum compression, block height, peak force and energy absorption. In chassis calibration, the jounce bumper therefore forms part of the total suspension spring curve and directly influences impact load transfer, damper protection, body acceleration, wheel control and NVH response under large wheel displacement, braking load transfer, cornering, pothole impact and payload variation.
Microcellular polyurethane is the principal material system used in automotive jounce bumpers. Automotive MCU grades combine high volumetric compressibility, limited lateral expansion, controlled cellular collapse and progressive stiffness development under large compressive strain. Representative molded MCU systems used for suspension applications typically operate at apparent densities of approximately 350 to 650 kg per cubic meter with cellular volume fractions of roughly 50 to 70 percent. Polymer chemistry, density, cell size distribution, closed cell content and crosslink structure are adjusted together with component geometry to obtain the specified load curve, rebound response, compression set and fatigue life. BASF Cellasto, Vibracoustic MCU systems, NOK foamed polyurethane products and multiple Asian suspension suppliers use this material architecture at production scale. Rubber remains in use for bound bumpers and related suspension stops, particularly where conventional molded elastomer construction is retained. Thermoplastic elastomer systems are also commercially established, including copolyester ether structures used in hollow jounce bumper and dust protection configurations. Material selection therefore spans cellular polyurethane, molded rubber and thermoplastic elastomer systems, with MCU accounting for the dominant technical architecture in modern passenger vehicle suspension applications.
MCU jounce bumpers are generally manufactured by reactive molding with controlled polyurethane foaming inside closed tooling, where formulation, mold temperature, shot mass, reaction profile and cavity geometry determine apparent density, cellular morphology and dimensional characteristics. Component architecture ranges from single material molded elements to assemblies incorporating support rings, cups, spacers, retainers and dust protection elements. Rubber designs rely on molded compound deformation and geometric strain distribution, while thermoplastic versions can use hollow blow molded structures in which wall thickness, section profile and cavity geometry contribute materially to the progressive compression characteristic. The functional load curve is therefore generated by the combined effects of material constitutive behavior and component geometry. Changes in density, axial length, radial profile, cavity shape or contact sequence can materially alter engagement stiffness and terminal load without changing the nominal suspension interface.
Installation architecture varies with suspension design. Passenger vehicle MacPherson struts and coil spring damper systems commonly place the jounce bumper concentrically around the piston rod or inside the upper damper module, while multi link, rigid axle and commercial vehicle suspensions may use separate axle mounted or body mounted stops. The bumper must accommodate repeated high strain compression while retaining dynamic stiffness, rebound behavior and dimensional stability under temperature cycling, moisture, road contamination and exposure to automotive fluids. Its engineering specification is therefore closely coupled to available wheel travel, damper stroke, spring rate, axle load, target engagement position, allowable peak structural load and vehicle specific ride calibration.
A jounce bumper is a compressible suspension component that controls loads as wheel travel approaches the compression limit. Its geometry and material response shape the force-displacement characteristic and energy absorption. Microcellular polyurethane is one established material route; the catalogue also lists rubber and thermoplastic elastomer products. The bumper works within a suspension assembly with components such as a damper, dust cover, spring isolator and top mount.
What turns activity into demand
Vehicle output is only the starting point. Fitment, force-displacement requirements and the supplier selected for the platform determine a component manufacturer's opportunity. A bumper, a damper assembly and a complete suspension system are different sold items. Keep original-equipment fitment and replacement sales on separate timelines.
The commercial boundary
A bumper, a damper assembly and a complete suspension system are different sold items. Keep original-equipment fitment and replacement sales on separate timelines.
Technical reading
Selected research
Market Outlook & Growth Opportunities
Global Automotive Jounce Bumper Market Outlook and Growth Opportunities 2026
Market perspective
Automotive Jounce Bumper is an elastomeric auxiliary spring and compression travel limiting component integrated into the suspension load path, typically around the damper piston rod, within strut and shock absorber assemblies, or at dedicated axle and suspension stops. Engagement occurs during increasing jounce travel, where the component adds a strongly progressive spring characteristic to the primary suspension and controls terminal compression before mechanical contact or excessive damper travel. The resulting force versus displacement curve is governed by material modulus, cellular structure, apparent density, free height, external contour, internal cavities, effective compressed volume, contact area progression and geometric confinement. These parameters determine engagement point, rate progression, maximum compression, block height, peak force and energy absorption. In chassis calibration, the jounce bumper therefore forms part of the total suspension spring curve and directly influences impact load transfer, damper protection, body acceleration, wheel control and NVH response under large wheel displacement, braking load transfer, cornering, pothole impact and payload variation.
Microcellular polyurethane is the principal material system used in automotive jounce bumpers. Automotive MCU grades combine high volumetric compressibility, limited lateral expansion, controlled cellular collapse and progressive stiffness development under large compressive strain. Representative molded MCU systems used for suspension applications typically operate at apparent densities of approximately 350 to 650 kg per cubic meter with cellular volume fractions of roughly 50 to 70 percent. Polymer chemistry, density, cell size distribution, closed cell content and crosslink structure are adjusted together with component geometry to obtain the specified load curve, rebound response, compression set and fatigue life. BASF Cellasto, Vibracoustic MCU systems, NOK foamed polyurethane products and multiple Asian suspension suppliers use this material architecture at production scale. Rubber remains in use for bound bumpers and related suspension stops, particularly where conventional molded elastomer construction is retained. Thermoplastic elastomer systems are also commercially established, including copolyester ether structures used in hollow jounce bumper and dust protection configurations. Material selection therefore spans cellular polyurethane, molded rubber and thermoplastic elastomer systems, with MCU accounting for the dominant technical architecture in modern passenger vehicle suspension applications.
MCU jounce bumpers are generally manufactured by reactive molding with controlled polyurethane foaming inside closed tooling, where formulation, mold temperature, shot mass, reaction profile and cavity geometry determine apparent density, cellular morphology and dimensional characteristics. Component architecture ranges from single material molded elements to assemblies incorporating support rings, cups, spacers, retainers and dust protection elements. Rubber designs rely on molded compound deformation and geometric strain distribution, while thermoplastic versions can use hollow blow molded structures in which wall thickness, section profile and cavity geometry contribute materially to the progressive compression characteristic. The functional load curve is therefore generated by the combined effects of material constitutive behavior and component geometry. Changes in density, axial length, radial profile, cavity shape or contact sequence can materially alter engagement stiffness and terminal load without changing the nominal suspension interface.
Read the full market overview
Installation architecture varies with suspension design. Passenger vehicle MacPherson struts and coil spring damper systems commonly place the jounce bumper concentrically around the piston rod or inside the upper damper module, while multi link, rigid axle and commercial vehicle suspensions may use separate axle mounted or body mounted stops. The bumper must accommodate repeated high strain compression while retaining dynamic stiffness, rebound behavior and dimensional stability under temperature cycling, moisture, road contamination and exposure to automotive fluids. Its engineering specification is therefore closely coupled to available wheel travel, damper stroke, spring rate, axle load, target engagement position, allowable peak structural load and vehicle specific ride calibration.
According to APO Research, Inc, the global Automotive Jounce Bumper market was valued at approximately USD 814.22 million in 2025 and is estimated at USD 835.10 million in 2026. Market revenue is forecast to reach about USD 1,010.00 million by 2032, representing a CAGR of 3.22% from 2026 to 2032. Global demand is closely linked to light vehicle and commercial vehicle production, with conventional passenger vehicle suspension architectures commonly using four jounce bumpers per vehicle. Total unit demand is estimated at approximately 400 million pieces in 2025 and 405 million pieces in 2026, with gradual growth toward roughly 445 million to 450 million pieces by 2032. Revenue growth reflects moderate vehicle production expansion, higher load requirements, increasing specification content in suspension systems and gradual improvement in the global product mix and weighted ex factory pricing.
Microcellular polyurethane remains the dominant material system because its progressive compression characteristic, high volumetric deformation capability, low lateral expansion and fatigue resistance are well suited to compact suspension packaging and high strain cyclic loading. Rubber remains established in bound bumpers, axle stops and selected conventional suspension designs, while thermoplastic elastomers have entered commercial applications through hollow and integrated structures. Passenger cars account for the majority of global demand, while commercial vehicles contribute a smaller unit base with generally higher load capacity and component mass. Electrification is increasing vehicle curb weight and axle loads across many passenger vehicle segments, raising required bumper load capacity and energy absorption without materially changing the typical number of components per vehicle. The competitive structure includes BASF Cellasto, Vibracoustic, Sumitomo Riko, NOK, Prospira, Shanghai Carthane, DONGYANG P&C, BASF INOAC Polyurethanes, Trelleborg, AirBoss Engineered Products and several regional Tier 1 suspension component suppliers. OEM annual cost reduction programs, localization of Asian production and mature suspension architectures constrain price expansion, keeping long term market growth in the low single digit range.
This report provides an overview of the global Automotive Jounce Bumper market in terms of sales, revenue, and price, analyzing global market trends using historical revenue and sales data for 2021-2025, estimates for 2026, and projected CAGRs through 2032.
The study covers key producers of Automotive Jounce Bumper and sales in major regions and countries, assesses future market potential, and highlights priority regions and countries for segmenting the market into sub-sectors, with country-specific market value data for the U.S., Canada, Mexico, Brazil, China, Japan, South Korea, Southeast Asia, India, Germany, the U.K., Italy, the Middle East, Africa, and other countries.
The report also presents Automotive Jounce Bumper sales, revenue, market share, and industry ranking for the main manufacturers for 2021-2026, identifies the major stakeholders in the global market, and analyzes their competitive landscape and market positioning based on recent developments and segmental revenues.
In addition, the report analyzes segment data by Type and Application—covering sales, revenue, and price—for 2021-2032, and evaluates and forecasts the Automotive Jounce Bumper market size, projected growth trends, production technologies, key applications, and end-use industries.
Automotive Jounce Bumper Segment by Company
BASF
Vibracoustic SE
Trelleborg
Prospira Corporation
Sumitomo Riko
NOK Corporation
Kinugawa Rubber Industrial Holdings
DONGYANG P&C
BASF INOAC Polyurethanes
Shanghai Carthane
Anand Motor Products
AirBoss Engineered Products
Zhuzhou Times New Material Technology
Automotive Jounce Bumper Segment by Type
Polyurethane
Rubber
Thermoplastic Elastomer
Automotive Jounce Bumper Segment by Application
Passenger Cars
Commercial Vehicles
Automotive Jounce Bumper Segment by Region
North America
United States
Canada
Mexico
Europe
Germany
France
U.K.
Italy
Russia
Spain
Netherlands
Switzerland
Sweden
Poland
Asia-Pacific
China
Japan
South Korea
India
Australia
Taiwan
Southeast Asia
South America
Brazil
Argentina
Chile
Colombia
Middle East & Africa
Egypt
South Africa
Israel
Türkiye
GCC Countries
Study Objectives
1. To analyze and research the global Automotive Jounce Bumper status and future forecast, involving, sales, revenue, growth rate (CAGR), market share, historical and forecast.
2. To present the key manufacturers, sales, revenue, market share, and Recent Developments.
3. To split the breakdown data by regions, type, manufacturers, and Application.
4. To analyze the global and key regions Automotive Jounce Bumper market potential and advantage, opportunity and challenge, restraints, and risks.
5. To identify Automotive Jounce Bumper significant trends, drivers, influence factors in global and regions.
6. To analyze Automotive Jounce Bumper competitive developments such as expansions, agreements, new product launches, and acquisitions in the market.
Reasons to Buy This Report
1. This report will help the readers to understand the competition within the industries and strategies for the competitive environment to enhance the potential profit. The report also focuses on the competitive landscape of the global Automotive Jounce Bumper market, and introduces in detail the market share, industry ranking, competitor ecosystem, market performance, new product development, operation situation, expansion, and acquisition. etc. of the main players, which helps the readers to identify the main competitors and deeply understand the competition pattern of the market.
2. This report will help stakeholders to understand the global industry status and trends of Automotive Jounce Bumper and provides them with information on key market drivers, restraints, challenges, and opportunities.
3. This report will help stakeholders to understand competitors better and gain more insights to strengthen their position in their businesses. The competitive landscape section includes the market share and rank (in sales and value), competitor ecosystem, new product development, expansion, and acquisition.
4. This report stays updated with novel technology integration, features, and the latest developments in the market.
5. This report helps stakeholders to gain insights into which regions to target globally.
6. This report helps stakeholders to gain insights into the end-user perception concerning the adoption of Automotive Jounce Bumper.
7. This report helps stakeholders to identify some of the key players in the market and understand their valuable contribution.
Chapter Outline
Chapter 1: Provides an overview of the Automotive Jounce Bumper market, including product definition, global market growth prospects, sales value, sales volume, and average price forecasts (2021-2032).
Chapter 2: Analysis key trends, drivers, challenges, and opportunities within the global Automotive Jounce Bumper industry.
Chapter 3: Detailed analysis of Automotive Jounce Bumper manufacturers competitive landscape, price, sales and revenue market share, latest development plan, merger, and acquisition information, etc.
Chapter 4: Provides the analysis of various market segments by type, covering the market size and development potential of each market segment, to help readers find the blue ocean market in different market segments.
Chapter 5: Provides the analysis of various market segments by application, covering the market size and development potential of each market segment, to help readers find the blue ocean market in different downstream markets.
Chapter 6: Sales and value of Automotive Jounce Bumper in regional level. It provides a quantitative analysis of the market size and development potential of each region and introduces the market development, future development prospects, market space, and market size of each country in the world.
Chapter 7: Sales and value of Automotive Jounce Bumper in country level. It provides sigmate data by type, and by application for each country/region.
Chapter 8: Provides profiles of key players, introducing the basic situation of the main companies in the market in detail, including product sales, revenue, price, gross margin, product introduction, recent development, etc.
Chapter 9: Analysis of industrial chain, including the upstream and downstream of the industry.
Chapter 10: Concluding Insights.
More report detail
Tables and figures
Scope & coverage.
Types
- Polyurethane
- Rubber
- Thermoplastic Elastomer
Applications
- Passenger Cars
- Commercial Vehicles
Companies covered
- BASF
- Vibracoustic SE
- Trelleborg
- Prospira Corporation
- Sumitomo Riko
- NOK Corporation
- Kinugawa Rubber Industrial Holdings
- DONGYANG P&C
- BASF INOAC Polyurethanes
- Shanghai Carthane
- Anand Motor Products
- AirBoss Engineered Products
- Zhuzhou Times New Material Technology
Inside the report.
1 Market Overview
- 1.1 Product Definition
- 1.2 Global Market Growth Prospects
- 1.2.1 Global Automotive Jounce Bumper Sales Value (2021-2032)
- 1.2.2 Global Automotive Jounce Bumper Sales Volume (2021-2032)
- 1.2.3 Global Automotive Jounce Bumper Sales Average Price (2021-2032)
- 1.3 Assumptions and Limitations
- 1.4 Study Goals and Objectives
2 Automotive Jounce Bumper Market Dynamics
- 2.1 Automotive Jounce Bumper Industry Trends
- 2.2 Automotive Jounce Bumper Industry Drivers
- 2.3 Automotive Jounce Bumper Industry Opportunities and Challenges
- 2.4 Automotive Jounce Bumper Industry Restraints
3 Automotive Jounce Bumper Market by Company
- 3.1 Global Automotive Jounce Bumper Company Revenue Ranking in 2025
- 3.2 Global Automotive Jounce Bumper Revenue by Company (2021-2026)
- 3.3 Global Automotive Jounce Bumper Sales Volume by Company (2021-2026)
- 3.4 Global Automotive Jounce Bumper Average Price by Company (2021-2026)
- 3.5 Global Automotive Jounce Bumper Company Ranking (2024-2026)
- 3.6 Global Automotive Jounce Bumper Company Manufacturing Base and Headquarters
- 3.7 Global Automotive Jounce Bumper Company Product Type and Application
- 3.8 Global Automotive Jounce Bumper Company Establishment Date
- 3.9 Market Competitive Analysis
- 3.9.1 Global Automotive Jounce Bumper Market Concentration Ratio (CR5 and HHI)
- 3.9.2 Global Top 5 and 10 Company Market Share by Revenue in 2025
- 3.9.3 2025 Automotive Jounce Bumper Tier 1, Tier 2, and Tier 3 Companies
- 3.10 Mergers and Acquisitions Expansion
4 Automotive Jounce Bumper Market by Type
- 4.1 Automotive Jounce Bumper Type Introduction
- 4.1.1 Polyurethane
- 4.1.2 Rubber
- 4.1.3 Thermoplastic Elastomer
- 4.2 Global Automotive Jounce Bumper Sales Volume by Type
- 4.2.1 Global Automotive Jounce Bumper Sales Volume by Type (2021 VS 2025 VS 2032)
- 4.2.2 Global Automotive Jounce Bumper Sales Volume by Type (2021-2032)
- 4.2.3 Global Automotive Jounce Bumper Sales Volume Share by Type (2021-2032)
- 4.3 Global Automotive Jounce Bumper Sales Value by Type
- 4.3.1 Global Automotive Jounce Bumper Sales Value by Type (2021 VS 2025 VS 2032)
- 4.3.2 Global Automotive Jounce Bumper Sales Value by Type (2021-2032)
- 4.3.3 Global Automotive Jounce Bumper Sales Value Share by Type (2021-2032)
5 Automotive Jounce Bumper Market by Application
- 5.1 Automotive Jounce Bumper Application Introduction
- 5.1.1 Passenger Cars
- 5.1.2 Commercial Vehicles
- 5.2 Global Automotive Jounce Bumper Sales Volume by Application
- 5.2.1 Global Automotive Jounce Bumper Sales Volume by Application (2021 VS 2025 VS 2032)
- 5.2.2 Global Automotive Jounce Bumper Sales Volume by Application (2021-2032)
- 5.2.3 Global Automotive Jounce Bumper Sales Volume Share by Application (2021-2032)
- 5.3 Global Automotive Jounce Bumper Sales Value by Application
- 5.3.1 Global Automotive Jounce Bumper Sales Value by Application (2021 VS 2025 VS 2032)
- 5.3.2 Global Automotive Jounce Bumper Sales Value by Application (2021-2032)
- 5.3.3 Global Automotive Jounce Bumper Sales Value Share by Application (2021-2032)
6 Automotive Jounce Bumper Regional Sales and Value Analysis
- 6.1 Global Automotive Jounce Bumper Sales by Region: 2021 VS 2025 VS 2032
- 6.2 Global Automotive Jounce Bumper Sales by Region (2021-2032)
- 6.2.1 Global Automotive Jounce Bumper Sales by Region: 2021-2026
- 6.2.2 Global Automotive Jounce Bumper Sales by Region (2027-2032)
- 6.3 Global Automotive Jounce Bumper Sales Value by Region: 2021 VS 2025 VS 2032
- 6.4 Global Automotive Jounce Bumper Sales Value by Region (2021-2032)
- 6.4.1 Global Automotive Jounce Bumper Sales Value by Region: 2021-2026
- 6.4.2 Global Automotive Jounce Bumper Sales Value by Region (2027-2032)
- 6.5 Global Automotive Jounce Bumper Market Price Analysis by Region (2021-2026)
- 6.6 North America
- 6.6.1 North America Automotive Jounce Bumper Sales Value (2021-2032)
- 6.6.2 North America Automotive Jounce Bumper Sales Value Share by Country, 2025 VS 2032
- 6.7 Europe
- 6.7.1 Europe Automotive Jounce Bumper Sales Value (2021-2032)
- 6.7.2 Europe Automotive Jounce Bumper Sales Value Share by Country, 2025 VS 2032
- 6.8 Asia-Pacific
- 6.8.1 Asia-Pacific Automotive Jounce Bumper Sales Value (2021-2032)
- 6.8.2 Asia-Pacific Automotive Jounce Bumper Sales Value Share by Country, 2025 VS 2032
- 6.9 South America
- 6.9.1 South America Automotive Jounce Bumper Sales Value (2021-2032)
- 6.9.2 South America Automotive Jounce Bumper Sales Value Share by Country, 2025 VS 2032
- 6.10 Middle East & Africa
- 6.10.1 Middle East & Africa Automotive Jounce Bumper Sales Value (2021-2032)
- 6.10.2 Middle East & Africa Automotive Jounce Bumper Sales Value Share by Country, 2025 VS 2032
7 Automotive Jounce Bumper Country-level Sales and Value Analysis
- 7.1 Global Automotive Jounce Bumper Sales by Country: 2021 VS 2025 VS 2032
- 7.2 Global Automotive Jounce Bumper Sales Value by Country: 2021 VS 2025 VS 2032
- 7.3 Global Automotive Jounce Bumper Sales by Country (2021-2032)
- 7.3.1 Global Automotive Jounce Bumper Sales by Country (2021-2026)
- 7.3.2 Global Automotive Jounce Bumper Sales by Country (2027-2032)
- 7.4 Global Automotive Jounce Bumper Sales Value by Country (2021-2032)
- 7.4.1 Global Automotive Jounce Bumper Sales Value by Country (2021-2026)
- 7.4.2 Global Automotive Jounce Bumper Sales Value by Country (2027-2032)
- 7.5 USA
- 7.5.1 USA Automotive Jounce Bumper Sales Value Growth Rate (2021-2032)
- 7.5.2 USA Automotive Jounce Bumper Sales Value Share by Type, 2025 VS 2032
- 7.5.3 USA Automotive Jounce Bumper Sales Value Share by Application, 2025 VS 2032
- 7.6 Canada
- 7.6.1 Canada Automotive Jounce Bumper Sales Value Growth Rate (2021-2032)
- 7.6.2 Canada Automotive Jounce Bumper Sales Value Share by Type, 2025 VS 2032
- 7.6.3 Canada Automotive Jounce Bumper Sales Value Share by Application, 2025 VS 2032
- 7.7 Mexico
- 7.6.1 Mexico Automotive Jounce Bumper Sales Value Growth Rate (2021-2032)
- 7.6.2 Mexico Automotive Jounce Bumper Sales Value Share by Type, 2025 VS 2032
- 7.6.3 Mexico Automotive Jounce Bumper Sales Value Share by Application, 2025 VS 2032
- 7.8 Germany
- 7.8.1 Germany Automotive Jounce Bumper Sales Value Growth Rate (2021-2032)
- 7.8.2 Germany Automotive Jounce Bumper Sales Value Share by Type, 2025 VS 2032
- 7.8.3 Germany Automotive Jounce Bumper Sales Value Share by Application, 2025 VS 2032
- 7.9 France
- 7.9.1 France Automotive Jounce Bumper Sales Value Growth Rate (2021-2032)
- 7.9.2 France Automotive Jounce Bumper Sales Value Share by Type, 2025 VS 2032
- 7.9.3 France Automotive Jounce Bumper Sales Value Share by Application, 2025 VS 2032
- 7.10 U.K.
- 7.10.1 U.K. Automotive Jounce Bumper Sales Value Growth Rate (2021-2032)
- 7.10.2 U.K. Automotive Jounce Bumper Sales Value Share by Type, 2025 VS 2032
- 7.10.3 U.K. Automotive Jounce Bumper Sales Value Share by Application, 2025 VS 2032
- 7.11 Italy
- 7.11.1 Italy Automotive Jounce Bumper Sales Value Growth Rate (2021-2032)
- 7.11.2 Italy Automotive Jounce Bumper Sales Value Share by Type, 2025 VS 2032
- 7.11.3 Italy Automotive Jounce Bumper Sales Value Share by Application, 2025 VS 2032
- 7.12 Spain
- 7.12.1 Spain Automotive Jounce Bumper Sales Value Growth Rate (2021-2032)
- 7.12.2 Spain Automotive Jounce Bumper Sales Value Share by Type, 2025 VS 2032
- 7.12.3 Spain Automotive Jounce Bumper Sales Value Share by Application, 2025 VS 2032
- 7.13 Russia
- 7.13.1 Russia Automotive Jounce Bumper Sales Value Growth Rate (2021-2032)
- 7.13.2 Russia Automotive Jounce Bumper Sales Value Share by Type, 2025 VS 2032
- 7.13.3 Russia Automotive Jounce Bumper Sales Value Share by Application, 2025 VS 2032
- 7.14 Netherlands
- 7.14.1 Netherlands Automotive Jounce Bumper Sales Value Growth Rate (2021-2032)
- 7.14.2 Netherlands Automotive Jounce Bumper Sales Value Share by Type, 2025 VS 2032
- 7.14.3 Netherlands Automotive Jounce Bumper Sales Value Share by Application, 2025 VS 2032
- 7.15 Nordic Countries
- 7.15.1 Nordic Countries Automotive Jounce Bumper Sales Value Growth Rate (2021-2032)
- 7.15.2 Nordic Countries Automotive Jounce Bumper Sales Value Share by Type, 2025 VS 2032
- 7.15.3 Nordic Countries Automotive Jounce Bumper Sales Value Share by Application, 2025 VS 2032
- 7.16 China
- 7.16.1 China Automotive Jounce Bumper Sales Value Growth Rate (2021-2032)
- 7.16.2 China Automotive Jounce Bumper Sales Value Share by Type, 2025 VS 2032
- 7.16.3 China Automotive Jounce Bumper Sales Value Share by Application, 2025 VS 2032
- 7.17 Japan
- 7.17.1 Japan Automotive Jounce Bumper Sales Value Growth Rate (2021-2032)
- 7.17.2 Japan Automotive Jounce Bumper Sales Value Share by Type, 2025 VS 2032
- 7.17.3 Japan Automotive Jounce Bumper Sales Value Share by Application, 2025 VS 2032
- 7.18 South Korea
- 7.18.1 South Korea Automotive Jounce Bumper Sales Value Growth Rate (2021-2032)
- 7.18.2 South Korea Automotive Jounce Bumper Sales Value Share by Type, 2025 VS 2032
- 7.18.3 South Korea Automotive Jounce Bumper Sales Value Share by Application, 2025 VS 2032
- 7.19 India
- 7.19.1 India Automotive Jounce Bumper Sales Value Growth Rate (2021-2032)
- 7.19.2 India Automotive Jounce Bumper Sales Value Share by Type, 2025 VS 2032
- 7.19.3 India Automotive Jounce Bumper Sales Value Share by Application, 2025 VS 2032
- 7.20 Australia
- 7.20.1 Australia Automotive Jounce Bumper Sales Value Growth Rate (2021-2032)
- 7.20.2 Australia Automotive Jounce Bumper Sales Value Share by Type, 2025 VS 2032
- 7.20.3 Australia Automotive Jounce Bumper Sales Value Share by Application, 2025 VS 2032
- 7.21 Southeast Asia
- 7.21.1 Southeast Asia Automotive Jounce Bumper Sales Value Growth Rate (2021-2032)
- 7.21.2 Southeast Asia Automotive Jounce Bumper Sales Value Share by Type, 2025 VS 2032
- 7.21.3 Southeast Asia Automotive Jounce Bumper Sales Value Share by Application, 2025 VS 2032
- 7.22 Brazil
- 7.22.1 Brazil Automotive Jounce Bumper Sales Value Growth Rate (2021-2032)
- 7.22.2 Brazil Automotive Jounce Bumper Sales Value Share by Type, 2025 VS 2032
- 7.22.3 Brazil Automotive Jounce Bumper Sales Value Share by Application, 2025 VS 2032
- 7.23 Argentina
- 7.23.1 Argentina Automotive Jounce Bumper Sales Value Growth Rate (2021-2032)
- 7.23.2 Argentina Automotive Jounce Bumper Sales Value Share by Type, 2025 VS 2032
- 7.23.3 Argentina Automotive Jounce Bumper Sales Value Share by Application, 2025 VS 2032
- 7.24 Chile
- 7.24.1 Chile Automotive Jounce Bumper Sales Value Growth Rate (2021-2032)
- 7.24.2 Chile Automotive Jounce Bumper Sales Value Share by Type, 2025 VS 2032
- 7.24.3 Chile Automotive Jounce Bumper Sales Value Share by Application, 2025 VS 2032
- 7.25 Colombia
- 7.25.1 Colombia Automotive Jounce Bumper Sales Value Growth Rate (2021-2032)
- 7.25.2 Colombia Automotive Jounce Bumper Sales Value Share by Type, 2025 VS 2032
- 7.25.3 Colombia Automotive Jounce Bumper Sales Value Share by Application, 2025 VS 2032
- 7.26 Peru
- 7.26.1 Peru Automotive Jounce Bumper Sales Value Growth Rate (2021-2032)
- 7.26.2 Peru Automotive Jounce Bumper Sales Value Share by Type, 2025 VS 2032
- 7.26.3 Peru Automotive Jounce Bumper Sales Value Share by Application, 2025 VS 2032
- 7.27 Saudi Arabia
- 7.27.1 Saudi Arabia Automotive Jounce Bumper Sales Value Growth Rate (2021-2032)
- 7.27.2 Saudi Arabia Automotive Jounce Bumper Sales Value Share by Type, 2025 VS 2032
- 7.27.3 Saudi Arabia Automotive Jounce Bumper Sales Value Share by Application, 2025 VS 2032
- 7.28 Israel
- 7.28.1 Israel Automotive Jounce Bumper Sales Value Growth Rate (2021-2032)
- 7.28.2 Israel Automotive Jounce Bumper Sales Value Share by Type, 2025 VS 2032
- 7.28.3 Israel Automotive Jounce Bumper Sales Value Share by Application, 2025 VS 2032
- 7.29 UAE
- 7.29.1 UAE Automotive Jounce Bumper Sales Value Growth Rate (2021-2032)
- 7.29.2 UAE Automotive Jounce Bumper Sales Value Share by Type, 2025 VS 2032
- 7.29.3 UAE Automotive Jounce Bumper Sales Value Share by Application, 2025 VS 2032
- 7.30 Turkey
- 7.30.1 Turkey Automotive Jounce Bumper Sales Value Growth Rate (2021-2032)
- 7.30.2 Turkey Automotive Jounce Bumper Sales Value Share by Type, 2025 VS 2032
- 7.30.3 Turkey Automotive Jounce Bumper Sales Value Share by Application, 2025 VS 2032
- 7.31 Iran
- 7.31.1 Iran Automotive Jounce Bumper Sales Value Growth Rate (2021-2032)
- 7.31.2 Iran Automotive Jounce Bumper Sales Value Share by Type, 2025 VS 2032
- 7.31.3 Iran Automotive Jounce Bumper Sales Value Share by Application, 2025 VS 2032
- 7.32 Egypt
- 7.32.1 Egypt Automotive Jounce Bumper Sales Value Growth Rate (2021-2032)
- 7.32.2 Egypt Automotive Jounce Bumper Sales Value Share by Type, 2025 VS 2032
- 7.32.3 Egypt Automotive Jounce Bumper Sales Value Share by Application, 2025 VS 2032
8 Company Profiles
- 8.1 BASF
- 8.1.1 BASF Company Information
- 8.1.2 BASF Business Overview
- 8.1.3 BASF Automotive Jounce Bumper Sales, Value and Gross Margin (2021-2026)
- 8.1.4 BASF Automotive Jounce Bumper Product Portfolio
- 8.1.5 BASF Recent Developments
- 8.2 Vibracoustic SE
- 8.2.1 Vibracoustic SE Company Information
- 8.2.2 Vibracoustic SE Business Overview
- 8.2.3 Vibracoustic SE Automotive Jounce Bumper Sales, Value and Gross Margin (2021-2026)
- 8.2.4 Vibracoustic SE Automotive Jounce Bumper Product Portfolio
- 8.2.5 Vibracoustic SE Recent Developments
- 8.3 Trelleborg
- 8.3.1 Trelleborg Company Information
- 8.3.2 Trelleborg Business Overview
- 8.3.3 Trelleborg Automotive Jounce Bumper Sales, Value and Gross Margin (2021-2026)
- 8.3.4 Trelleborg Automotive Jounce Bumper Product Portfolio
- 8.3.5 Trelleborg Recent Developments
- 8.4 Prospira Corporation
- 8.4.1 Prospira Corporation Company Information
- 8.4.2 Prospira Corporation Business Overview
- 8.4.3 Prospira Corporation Automotive Jounce Bumper Sales, Value and Gross Margin (2021-2026)
- 8.4.4 Prospira Corporation Automotive Jounce Bumper Product Portfolio
- 8.4.5 Prospira Corporation Recent Developments
- 8.5 Sumitomo Riko
- 8.5.1 Sumitomo Riko Company Information
- 8.5.2 Sumitomo Riko Business Overview
- 8.5.3 Sumitomo Riko Automotive Jounce Bumper Sales, Value and Gross Margin (2021-2026)
- 8.5.4 Sumitomo Riko Automotive Jounce Bumper Product Portfolio
- 8.5.5 Sumitomo Riko Recent Developments
- 8.6 NOK Corporation
- 8.6.1 NOK Corporation Company Information
- 8.6.2 NOK Corporation Business Overview
- 8.6.3 NOK Corporation Automotive Jounce Bumper Sales, Value and Gross Margin (2021-2026)
- 8.6.4 NOK Corporation Automotive Jounce Bumper Product Portfolio
- 8.6.5 NOK Corporation Recent Developments
- 8.7 Kinugawa Rubber Industrial Holdings
- 8.7.1 Kinugawa Rubber Industrial Holdings Company Information
- 8.7.2 Kinugawa Rubber Industrial Holdings Business Overview
- 8.7.3 Kinugawa Rubber Industrial Holdings Automotive Jounce Bumper Sales, Value and Gross Margin (2021-2026)
- 8.7.4 Kinugawa Rubber Industrial Holdings Automotive Jounce Bumper Product Portfolio
- 8.7.5 Kinugawa Rubber Industrial Holdings Recent Developments
- 8.8 DONGYANG P&C
- 8.8.1 DONGYANG P&C Company Information
- 8.8.2 DONGYANG P&C Business Overview
- 8.8.3 DONGYANG P&C Automotive Jounce Bumper Sales, Value and Gross Margin (2021-2026)
- 8.8.4 DONGYANG P&C Automotive Jounce Bumper Product Portfolio
- 8.8.5 DONGYANG P&C Recent Developments
- 8.9 BASF INOAC Polyurethanes
- 8.9.1 BASF INOAC Polyurethanes Company Information
- 8.9.2 BASF INOAC Polyurethanes Business Overview
- 8.9.3 BASF INOAC Polyurethanes Automotive Jounce Bumper Sales, Value and Gross Margin (2021-2026)
- 8.9.4 BASF INOAC Polyurethanes Automotive Jounce Bumper Product Portfolio
- 8.9.5 BASF INOAC Polyurethanes Recent Developments
- 8.10 Shanghai Carthane
- 8.10.1 Shanghai Carthane Company Information
- 8.10.2 Shanghai Carthane Business Overview
- 8.10.3 Shanghai Carthane Automotive Jounce Bumper Sales, Value and Gross Margin (2021-2026)
- 8.10.4 Shanghai Carthane Automotive Jounce Bumper Product Portfolio
- 8.10.5 Shanghai Carthane Recent Developments
- 8.11 Anand Motor Products
- 8.11.1 Anand Motor Products Company Information
- 8.11.2 Anand Motor Products Business Overview
- 8.11.3 Anand Motor Products Automotive Jounce Bumper Sales, Value and Gross Margin (2021-2026)
- 8.11.4 Anand Motor Products Automotive Jounce Bumper Product Portfolio
- 8.11.5 Anand Motor Products Recent Developments
- 8.12 AirBoss Engineered Products
- 8.12.1 AirBoss Engineered Products Company Information
- 8.12.2 AirBoss Engineered Products Business Overview
- 8.12.3 AirBoss Engineered Products Automotive Jounce Bumper Sales, Value and Gross Margin (2021-2026)
- 8.12.4 AirBoss Engineered Products Automotive Jounce Bumper Product Portfolio
- 8.12.5 AirBoss Engineered Products Recent Developments
- 8.13 Zhuzhou Times New Material Technology
- 8.13.1 Zhuzhou Times New Material Technology Company Information
- 8.13.2 Zhuzhou Times New Material Technology Business Overview
- 8.13.3 Zhuzhou Times New Material Technology Automotive Jounce Bumper Sales, Value and Gross Margin (2021-2026)
- 8.13.4 Zhuzhou Times New Material Technology Automotive Jounce Bumper Product Portfolio
- 8.13.5 Zhuzhou Times New Material Technology Recent Developments
9 Value Chain and Sales Channels Analysis
- 9.1 Automotive Jounce Bumper Value Chain Analysis
- 9.1.1 Automotive Jounce Bumper Key Raw Materials
- 9.1.2 Raw Materials Key Suppliers
- 9.1.3 Manufacturing Cost Structure
- 9.1.4 Automotive Jounce Bumper Sales Mode & Process
- 9.2 Automotive Jounce Bumper Sales Channels Analysis
- 9.2.1 Direct Comparison with Distribution Share
- 9.2.2 Automotive Jounce Bumper Distributors
- 9.2.3 Automotive Jounce Bumper Customers
10 Concluding Insights
11 Appendix
- 11.1 Reasons for Doing This Study
- 11.2 Research Methodology
- 11.3 Research Process
- 11.4 Authors List of This Report
- 11.5 Data Source
- 11.5.1 Secondary Sources
- 11.5.2 Primary Sources
GET THE RESEARCH
Choose your license.
Choose who needs access.
All options are for this report and research series.
PDF by email within 3–5 working days after payment confirmation.
Talk to an analyst