
High Purity Alumina Ceramics for Semiconductor Industry Research Report 2026
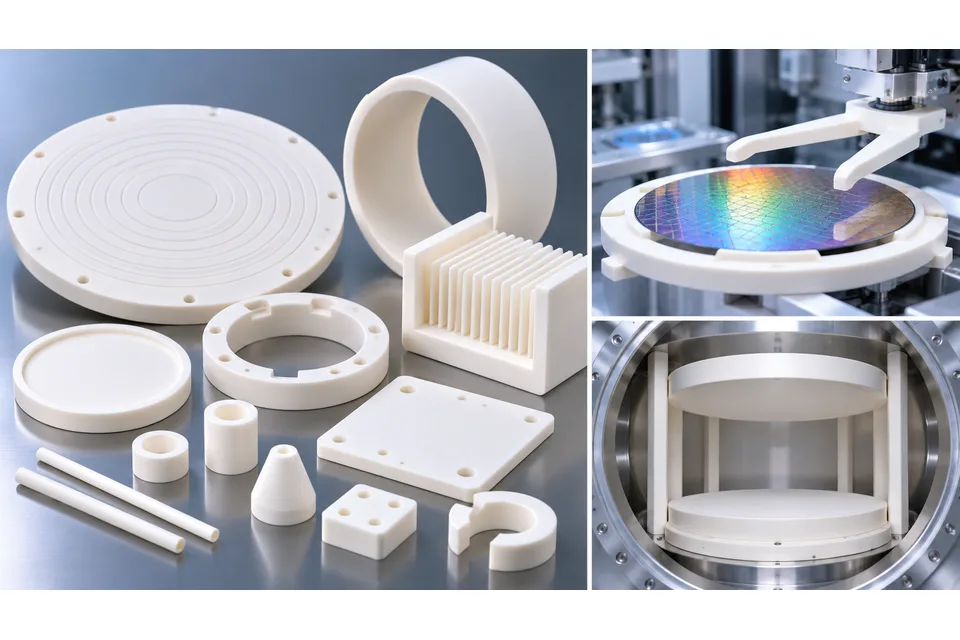
High Purity Alumina Ceramics for Semiconductor refers to dense, precision engineered ceramic components composed predominantly of high purity aluminum oxide (Al₂O₃) and manufactured for use in semiconductor substrate production, wafer fabrication equipment, and associated vacuum processing systems. The material consists primarily of polycrystalline alpha alumina with a corundum crystal structure, in which strong aluminum and oxygen bonding produces high hardness, elastic stiffness, electrical resistivity, thermal stability, and resistance to mechanical wear and chemical corrosion. Commercial semiconductor grades generally contain at least approximately 99.5% Al₂O₃ by weight, with specialized compositions reaching 99.8%, 99.9%, and 99.99% purity. Material performance depends on the combined effects of oxide purity, trace metallic and alkali impurities, grain size and distribution, grain boundary chemistry, residual porosity, crystalline phase composition, and sintering density. These microstructural characteristics govern dielectric loss, electrical insulation at elevated temperatures, mechanical strength, thermal conductivity, vacuum outgassing, and the release of contaminating particles or ionic species. High density and controlled grain boundary phases are particularly important in plasma processing environments, where energetic ion bombardment, reactive halogen species, thermal cycling, and repeated surface exposure can cause localized erosion, chemical reaction, and particle generation. The relationship between purity, grain structure, surface condition, and plasma chemistry determines the suitability of individual alumina compositions for direct process chamber exposure.
Commercial products comprise sintered and precision machined ceramic rings, chamber liners, domes, shields, gas distribution components, nozzles, electrical insulators, vacuum feedthrough bodies, wafer carriers, handling arms, support plates, polishing plates, and alumina based structural or dielectric elements incorporated into electrostatic chucks and other semiconductor processing assemblies. Depending on component geometry and operating conditions, manufacturing may employ isostatic pressing, dry pressing, injection molding, slip casting, or other ceramic forming methods followed by controlled densification and precision machining. Grinding, lapping, and polishing establish dimensional accuracy, surface roughness, flatness, and surface integrity, which influence mechanical contact, particle generation, sealing interfaces, and dimensional stability under operating temperatures. Alumina components can incorporate metallized interfaces, embedded conductive elements, ceramic to metal joints, or protective surface treatments while retaining a high purity alumina ceramic body as the principal structural material. Electrical insulation, dielectric behavior under radio frequency fields, chemical compatibility with process gases, mechanical loading, and thermal expansion interactions determine component configuration and material selection. The commercial product scope covers finished high purity alumina ceramic components and ceramic based assemblies supplied for semiconductor manufacturing equipment, including process facing and replaceable equipment parts. High purity alumina powders, standalone surface coatings, deposited alumina thin films, ceramic raw materials, independent processing services, conventional electronic packaging substrates, and components primarily manufactured from aluminum nitride, silicon carbide, silicon nitride, quartz, yttria, or monocrystalline sapphire constitute separate product categories.
Product & engineering
Understand the product.
High Purity Alumina Ceramics for Semiconductor refers to dense, precision engineered ceramic components composed predominantly of high purity aluminum oxide (Al₂O₃) and manufactured for use in semiconductor substrate production, wafer fabrication equipment, and associated vacuum processing systems. The material consists primarily of polycrystalline alpha alumina with a corundum crystal structure, in which strong aluminum and oxygen bonding produces high hardness, elastic stiffness, electrical resistivity, thermal stability, and resistance to mechanical wear and chemical corrosion. Commercial semiconductor grades generally contain at least approximately 99.5% Al₂O₃ by weight, with specialized compositions reaching 99.8%, 99.9%, and 99.99% purity. Material performance depends on the combined effects of oxide purity, trace metallic and alkali impurities, grain size and distribution, grain boundary chemistry, residual porosity, crystalline phase composition, and sintering density. These microstructural characteristics govern dielectric loss, electrical insulation at elevated temperatures, mechanical strength, thermal conductivity, vacuum outgassing, and the release of contaminating particles or ionic species. High density and controlled grain boundary phases are particularly important in plasma processing environments, where energetic ion bombardment, reactive halogen species, thermal cycling, and repeated surface exposure can cause localized erosion, chemical reaction, and particle generation. The relationship between purity, grain structure, surface condition, and plasma chemistry determines the suitability of individual alumina compositions for direct process chamber exposure.
Commercial products comprise sintered and precision machined ceramic rings, chamber liners, domes, shields, gas distribution components, nozzles, electrical insulators, vacuum feedthrough bodies, wafer carriers, handling arms, support plates, polishing plates, and alumina based structural or dielectric elements incorporated into electrostatic chucks and other semiconductor processing assemblies. Depending on component geometry and operating conditions, manufacturing may employ isostatic pressing, dry pressing, injection molding, slip casting, or other ceramic forming methods followed by controlled densification and precision machining. Grinding, lapping, and polishing establish dimensional accuracy, surface roughness, flatness, and surface integrity, which influence mechanical contact, particle generation, sealing interfaces, and dimensional stability under operating temperatures. Alumina components can incorporate metallized interfaces, embedded conductive elements, ceramic to metal joints, or protective surface treatments while retaining a high purity alumina ceramic body as the principal structural material. Electrical insulation, dielectric behavior under radio frequency fields, chemical compatibility with process gases, mechanical loading, and thermal expansion interactions determine component configuration and material selection. The commercial product scope covers finished high purity alumina ceramic components and ceramic based assemblies supplied for semiconductor manufacturing equipment, including process facing and replaceable equipment parts. High purity alumina powders, standalone surface coatings, deposited alumina thin films, ceramic raw materials, independent processing services, conventional electronic packaging substrates, and components primarily manufactured from aluminum nitride, silicon carbide, silicon nitride, quartz, yttria, or monocrystalline sapphire constitute separate product categories.
Selected research
Industry Research
High Purity Alumina Ceramics for Semiconductor Industry Research Report 2026
MARKET AT A GLANCE
Scale & outlook
- 2025
- ≈ 1,090USD million
- 2032
- 1,820USD million
Select a bar to inspect its value.
Source: APO Research, Inc.
Market perspective
According to APO Research, Inc, the global High Purity Alumina Ceramics for Semiconductor market was valued at approximately USD 1.09 billion in 2025 and is estimated to reach USD 1.22 billion in 2026 and USD 1.82 billion by 2032, representing a CAGR of 6.89% from 2026 to 2032. Market revenue comprises manufacturer sales of finished high purity alumina ceramic components used in semiconductor manufacturing equipment, with demand arising from new equipment installations, replacement of process exposed components, and changes in ceramic material specifications. SEMI reported worldwide wafer fab equipment sales of USD 116.9 billion in 2025 and projected an increase to USD 143.9 billion in 2026, reflecting accelerated investment in advanced logic and memory manufacturing. Etching and thin film deposition equipment generate recurring requirements for ceramic chamber liners, rings, gas distribution components, dielectric structures, and precision supports. New processing chambers create initial component demand, while plasma erosion, chemical exposure, thermal cycling, and particle contamination constraints generate replacement purchases throughout equipment operating life. Increasing process complexity can raise the number and value of specialized ceramic components required per chamber, although changes in equipment architecture and material selection prevent a proportional relationship between total equipment spending and alumina ceramic revenue.
Material purity and component geometry determine the commercial differentiation of semiconductor alumina ceramics. CoorsTek identifies commercial alumina compositions containing 99.5%, 99.8%, and 99.9% Al₂O₃, including its PlasmaPure and PlasmaPure UC grades for demanding semiconductor processing environments. Specialized materials containing 99.99% alumina are also commercially available for applications requiring more restrictive impurity control. Higher purity reduces potential sources of metallic and ionic contamination, while grain boundary chemistry, residual porosity, surface integrity, and plasma erosion characteristics determine the performance of finished components. Semiconductor equipment manufacturers purchase ceramic parts according to individual chamber conditions, including reactive gas composition, radio frequency exposure, operating temperature, dimensional tolerances, and mechanical loading. Components with tighter impurity limits, complex internal passages, larger dimensions, and extensive precision machining generally carry higher manufacturing costs and selling prices. Silicon carbide, aluminum nitride, and yttria remain competing materials in selected plasma processing and thermal applications, limiting the proportion of incremental equipment expenditure captured by alumina ceramics. Revenue growth therefore depends on the actual material content of new equipment configurations, component replacement frequency, and the sales mix of qualified ceramic grades.
China represents a significant source of incremental demand through domestic semiconductor equipment manufacturing, expansion of wafer fabrication capacity, and increased local procurement of precision ceramic components. Suzhou Kema Material Technology reported RMB 875.84 million in revenue from advanced ceramic components for semiconductor equipment in 2025, an increase of 26.58% from 2024. Revenue from this business reached RMB 478.71 million during the first half of 2026, increasing 9.47% from the corresponding period of the previous year. The disclosed business includes alumina, aluminum nitride, silicon carbide, and other advanced ceramic materials, with the high purity alumina segment accounting for a subset of total reported revenue. The company supplies structural components and integrated ceramic assemblies for etching, deposition, ion implantation, lithography, and thermal processing equipment, with domestic equipment manufacturers including NAURA and AMEC among its disclosed customers. Its Suzhou advanced manufacturing facility began operations in 2025, expanding manufacturing and precision processing capabilities for semiconductor ceramic components and assemblies. Local manufacturing capacity, equipment specific material qualification, and established customer relationships determine the extent to which domestic suppliers can replace imported ceramic components. China's installed equipment base also generates continuing replacement demand, providing an additional revenue source beyond purchases associated with new fabrication facilities.
Full market overview
Taiwan and South Korea contribute substantial demand through advanced logic, DRAM, and NAND manufacturing investments. TSMC reaffirmed its 2026 capital expenditure budget of USD 60 billion to USD 64 billion in October 2026, reflecting capacity expansion for advanced semiconductor processes in Taiwan and overseas facilities. The company's expansion of advanced logic production and additional fabrication capacity increases the potential installed base of etching, deposition, and other processing equipment requiring precision ceramic components. SK hynix announced approximately KRW 54 trillion in investment for its Yongin Y2 and Cheongju M17 fabrication projects in August 2026, with initial cleanroom openings scheduled for June 2029 and December 2028, respectively. These projects establish identifiable future equipment installation requirements within the forecast period, particularly for memory manufacturing processes involving repeated deposition and etching operations. Higher equipment utilization subsequently increases exposure cycles for chamber components and can shorten replacement intervals where plasma erosion or particle generation limits operating life. Thermal processing and wafer handling equipment provide additional demand for alumina insulating structures, carriers, and precision supports, generally subject to different replacement conditions from components directly exposed to plasma. The projected market expansion is consequently associated with additional processing chamber installations, increasing demand from the existing equipment population, and changes in ceramic component specifications, with manufacturing capacity and pricing dependent on material purity, sintering capability, precision machining requirements, and customer qualification cycles.
Report Scope
This report quantifies the global High Purity Alumina Ceramics for Semiconductor market in revenue (US$ million) and, where applicable, sales volume (k pcs), using 2025 as the base year and providing annual historical and forecast data for 2021–2032.
It standardizes definitions of types and applications, harmonizes vendor attribution, and presents comparable time series by company, type, application, and region/country, including indicative price bands (US$/k pcs) and concentration ratios (CR5/CR10).
The outputs are intended to support strategy development, budgeting, and performance benchmarking for manufacturers, new entrants, channel partners, and investors; the report also reviews technology shifts and notable product introductions relevant to High Purity Alumina Ceramics for Semiconductor.
Key Companies & Market Share Insights
This section profiles leading manufacturers, combining 2021–2025 results with a 2026–2032 outlook. It reports revenue, market share, price bands, product and application mix, regional and channel mix, and key developments (M&A, capacity additions, certifications). It also provides global revenue, average price, and—where applicable—sales volume by manufacturer, and calculates CR5/CR10 and rank changes to support comparative benchmarking.
High Purity Alumina Ceramics for Semiconductor Market by Company
- Kyocera
- CoorsTek
- Ferrotec
- NGK
- NTK CERATEC
- TOTO
- Morgan Advanced Materials
- CeramTec
- MiCo Ceramics
- Suzhou KemaTek
- Materion
- STC Material Solutions
- Japan Fine Ceramics
- ASUZAC
- Precision Ceramics
- KCM Technology
- Top Seiko
- Nishimura Advanced Ceramics
- Touch-Down Technology
- HK TECH
- St.Cera
- Innovacera
High Purity Alumina Ceramics for Semiconductor Segment by Type
- <99.8%
- 99.8%–99.9%
- >99.9%
High Purity Alumina Ceramics for Semiconductor Segment by Application
- Etching Equipment
- Deposition Equipment
- Thermal Processing Equipment
- Wafer Handling Equipment
- Lithography and Inspection Equipment
- Wafer Substrate Manufacturing Equipment
- Others
High Purity Alumina Ceramics for Semiconductor Segment by Region
- North America
- United States
- Canada
- Mexico
- Europe
- Germany
- France
- U.K.
- Italy
- Russia
- Spain
- Netherlands
- Switzerland
- Sweden
- Poland
- Asia-Pacific
- China
- Japan
- South Korea
- India
- Australia
- Taiwan
- Southeast Asia
- South America
- Brazil
- Argentina
- Chile
- Middle East & Africa
- Egypt
- South Africa
- Israel
- Türkiye
- GCC Countries
Key Drivers & Barriers
High-impact rendering factors and drivers have been studied in this report to aid the readers to understand the general development. Moreover, the report includes restraints and challenges that may act as stumbling blocks on the way of the players. This will assist the users to be attentive and make informed decisions related to business. Specialists have also laid their focus on the upcoming business prospects.
Reasons to Buy This Report
- This report will help the readers to understand the competition within the industries and strategies for the competitive environment to enhance the potential profit. The report also focuses on the competitive landscape of the global High Purity Alumina Ceramics for Semiconductor market, and introduces in detail the market share, industry ranking, competitor ecosystem, market performance, new product development, operation situation, expansion, and acquisition. etc. of the main players, which helps the readers to identify the main competitors and deeply understand the competition pattern of the market.
- This report will help stakeholders to understand the global industry status and trends of High Purity Alumina Ceramics for Semiconductor and provides them with information on key market drivers, restraints, challenges, and opportunities.
- This report will help stakeholders to understand competitors better and gain more insights to strengthen their position in their businesses. The competitive landscape section includes the market share and rank (in volume and value), competitor ecosystem, new product development, expansion, and acquisition.
- This report stays updated with novel technology integration, features, and the latest developments in the market
- This report helps stakeholders to gain insights into which regions to target globally
- This report helps stakeholders to gain insights into the end-user perception concerning the adoption of High Purity Alumina Ceramics for Semiconductor.
- This report helps stakeholders to identify some of the key players in the market and understand their valuable contribution.
Chapter Outline
- Chapter 1: Research objectives, research methods, data sources, data cross-validation;
- Chapter 2: Introduces the report scope of the report, executive summary of different market segments (by region, product type, application, etc), including the market size of each market segment, future development potential, and so on. It offers a high-level view of the current state of the market and its likely evolution in the short to mid-term, and long term.
- Chapter 3: Detailed analysis of High Purity Alumina Ceramics for Semiconductor manufacturers competitive landscape, price, production and value market share, latest development plan, merger, and acquisition information, etc.
- Chapter 4: Provides profiles of key players, introducing the basic situation of the main companies in the market in detail, including product production/output, value, price, gross margin, product introduction, recent development, etc.
- Chapter 5: Production/output, value of High Purity Alumina Ceramics for Semiconductor by region/country. It provides a quantitative analysis of the market size and development potential of each region in the next six years.
- Chapter 6: Consumption of High Purity Alumina Ceramics for Semiconductor in regional level and country level. It provides a quantitative analysis of the market size and development potential of each region and its main countries and introduces the market development, future development prospects, market space, and production of each country in the world.
- Chapter 7: Provides the analysis of various market segments by type, covering the market size and development potential of each market segment, to help readers find the blue ocean market in different market segments.
- Chapter 8: Provides the analysis of various market segments by application, covering the market size and development potential of each market segment, to help readers find the blue ocean market in different downstream markets.
- Chapter 9: Analysis of industrial chain, including the upstream and downstream of the industry.
- Chapter 10: Introduces the market dynamics, latest developments of the market, the driving factors and restrictive factors of the market, the challenges and risks faced by manufacturers in the industry, and the analysis of relevant policies in the industry.
- Chapter 11: The main points and conclusions of the report.
More report detail
Tables and figures
List of Tables
- Table 1. Secondary Sources
- Table 2. Primary Sources
- Table 3. Market Value Comparison by Type (2021 VS 2025 VS 2032) & (US$ Million)
- Table 4. Market Value Comparison by Application (2021 VS 2025 VS 2032) & (US$ Million)
- Table 5. Global High Purity Alumina Ceramics for Semiconductor Production by Manufacturers (k pcs) & (2021-2026)
- Table 6. Global High Purity Alumina Ceramics for Semiconductor Production Market Share by Manufacturers
- Table 7. Global High Purity Alumina Ceramics for Semiconductor Production Value by Manufacturers (US$ Million) & (2021-2026)
- Table 8. Global High Purity Alumina Ceramics for Semiconductor Production Value Market Share by Manufacturers (2021-2026)
- Table 9. Global High Purity Alumina Ceramics for Semiconductor Average Price (USD/pcs) of Manufacturers (2021-2026)
- Table 10. Global High Purity Alumina Ceramics for Semiconductor Industry Manufacturers Ranking, 2024 VS 2025 VS 2026
- Table 11. Global High Purity Alumina Ceramics for Semiconductor Key Manufacturers, Manufacturing Sites & Headquarters
- Table 12. Global High Purity Alumina Ceramics for Semiconductor Manufacturers, Product Type & Application
- Table 13. Global High Purity Alumina Ceramics for Semiconductor Manufacturers Established Date
- Table 14. Global Manufacturers Market Concentration Ratio (CR5 and HHI)
- Table 15. Global High Purity Alumina Ceramics for Semiconductor by Manufacturers Type (Tier 1, Tier 2, and Tier 3) & (based on the Production Value of 2025)
- Table 16. Manufacturers Mergers & Acquisitions, Expansion Plans
- Table 17. Kyocera Company Information
- Table 18. Kyocera Business Overview
- Table 19. Kyocera High Purity Alumina Ceramics for Semiconductor Production (k pcs), Value (US$ Million), Price (USD/pcs) and Gross Margin (2021-2026)
- Table 20. Kyocera High Purity Alumina Ceramics for Semiconductor Product Portfolio
- Table 21. Kyocera Recent Development
- Table 22. CoorsTek Company Information
- Table 23. CoorsTek Business Overview
- Table 24. CoorsTek High Purity Alumina Ceramics for Semiconductor Production (k pcs), Value (US$ Million), Price (USD/pcs) and Gross Margin (2021-2026)
- Table 25. CoorsTek High Purity Alumina Ceramics for Semiconductor Product Portfolio
- Table 26. CoorsTek Recent Development
- Table 27. Ferrotec Company Information
- Table 28. Ferrotec Business Overview
- Table 29. Ferrotec High Purity Alumina Ceramics for Semiconductor Production (k pcs), Value (US$ Million), Price (USD/pcs) and Gross Margin (2021-2026)
- Table 30. Ferrotec High Purity Alumina Ceramics for Semiconductor Product Portfolio
- Table 31. Ferrotec Recent Development
- Table 32. NGK Company Information
- Table 33. NGK Business Overview
- Table 34. NGK High Purity Alumina Ceramics for Semiconductor Production (k pcs), Value (US$ Million), Price (USD/pcs) and Gross Margin (2021-2026)
- Table 35. NGK High Purity Alumina Ceramics for Semiconductor Product Portfolio
- Table 36. NGK Recent Development
- Table 37. NTK CERATEC Company Information
- Table 38. NTK CERATEC Business Overview
- Table 39. NTK CERATEC High Purity Alumina Ceramics for Semiconductor Production (k pcs), Value (US$ Million), Price (USD/pcs) and Gross Margin (2021-2026)
- Table 40. NTK CERATEC High Purity Alumina Ceramics for Semiconductor Product Portfolio
- Table 41. NTK CERATEC Recent Development
- Table 42. TOTO Company Information
- Table 43. TOTO Business Overview
- Table 44. TOTO High Purity Alumina Ceramics for Semiconductor Production (k pcs), Value (US$ Million), Price (USD/pcs) and Gross Margin (2021-2026)
- Table 45. TOTO High Purity Alumina Ceramics for Semiconductor Product Portfolio
- Table 46. TOTO Recent Development
- Table 47. Morgan Advanced Materials Company Information
- Table 48. Morgan Advanced Materials Business Overview
- Table 49. Morgan Advanced Materials High Purity Alumina Ceramics for Semiconductor Production (k pcs), Value (US$ Million), Price (USD/pcs) and Gross Margin (2021-2026)
- Table 50. Morgan Advanced Materials High Purity Alumina Ceramics for Semiconductor Product Portfolio
- Table 51. Morgan Advanced Materials Recent Development
- Table 52. CeramTec Company Information
- Table 53. CeramTec Business Overview
- Table 54. CeramTec High Purity Alumina Ceramics for Semiconductor Production (k pcs), Value (US$ Million), Price (USD/pcs) and Gross Margin (2021-2026)
- Table 55. CeramTec High Purity Alumina Ceramics for Semiconductor Product Portfolio
- Table 56. CeramTec Recent Development
- Table 57. MiCo Ceramics Company Information
- Table 58. MiCo Ceramics Business Overview
- Table 59. MiCo Ceramics High Purity Alumina Ceramics for Semiconductor Production (k pcs), Value (US$ Million), Price (USD/pcs) and Gross Margin (2021-2026)
- Table 60. MiCo Ceramics High Purity Alumina Ceramics for Semiconductor Product Portfolio
- Table 61. MiCo Ceramics Recent Development
- Table 62. Suzhou KemaTek Company Information
- Table 63. Suzhou KemaTek Business Overview
- Table 64. Suzhou KemaTek High Purity Alumina Ceramics for Semiconductor Production (k pcs), Value (US$ Million), Price (USD/pcs) and Gross Margin (2021-2026)
- Table 65. Suzhou KemaTek High Purity Alumina Ceramics for Semiconductor Product Portfolio
- Table 66. Suzhou KemaTek Recent Development
- Table 67. Materion Company Information
- Table 68. Materion Business Overview
- Table 69. Materion High Purity Alumina Ceramics for Semiconductor Production (k pcs), Value (US$ Million), Price (USD/pcs) and Gross Margin (2021-2026)
- Table 70. Materion High Purity Alumina Ceramics for Semiconductor Product Portfolio
- Table 71. Materion Recent Development
- Table 72. STC Material Solutions Company Information
- Table 73. STC Material Solutions Business Overview
- Table 74. STC Material Solutions High Purity Alumina Ceramics for Semiconductor Production (k pcs), Value (US$ Million), Price (USD/pcs) and Gross Margin (2021-2026)
- Table 75. STC Material Solutions High Purity Alumina Ceramics for Semiconductor Product Portfolio
- Table 76. STC Material Solutions Recent Development
- Table 77. Japan Fine Ceramics Company Information
- Table 78. Japan Fine Ceramics Business Overview
- Table 79. Japan Fine Ceramics High Purity Alumina Ceramics for Semiconductor Production (k pcs), Value (US$ Million), Price (USD/pcs) and Gross Margin (2021-2026)
- Table 80. Japan Fine Ceramics High Purity Alumina Ceramics for Semiconductor Product Portfolio
- Table 81. Japan Fine Ceramics Recent Development
- Table 82. ASUZAC Company Information
- Table 83. ASUZAC Business Overview
- Table 84. ASUZAC High Purity Alumina Ceramics for Semiconductor Production (k pcs), Value (US$ Million), Price (USD/pcs) and Gross Margin (2021-2026)
- Table 85. ASUZAC High Purity Alumina Ceramics for Semiconductor Product Portfolio
- Table 86. ASUZAC Recent Development
- Table 87. Precision Ceramics Company Information
- Table 88. Precision Ceramics Business Overview
- Table 89. Precision Ceramics High Purity Alumina Ceramics for Semiconductor Production (k pcs), Value (US$ Million), Price (USD/pcs) and Gross Margin (2021-2026)
- Table 90. Precision Ceramics High Purity Alumina Ceramics for Semiconductor Product Portfolio
- Table 91. Precision Ceramics Recent Development
- Table 92. KCM Technology Company Information
- Table 93. KCM Technology Business Overview
- Table 94. KCM Technology High Purity Alumina Ceramics for Semiconductor Production (k pcs), Value (US$ Million), Price (USD/pcs) and Gross Margin (2021-2026)
- Table 95. KCM Technology High Purity Alumina Ceramics for Semiconductor Product Portfolio
- Table 96. KCM Technology Recent Development
- Table 97. Top Seiko Company Information
- Table 98. Top Seiko Business Overview
- Table 99. Top Seiko High Purity Alumina Ceramics for Semiconductor Production (k pcs), Value (US$ Million), Price (USD/pcs) and Gross Margin (2021-2026)
- Table 100. Top Seiko High Purity Alumina Ceramics for Semiconductor Product Portfolio
- Table 101. Top Seiko Recent Development
- Table 102. Nishimura Advanced Ceramics Company Information
- Table 103. Nishimura Advanced Ceramics Business Overview
- Table 104. Nishimura Advanced Ceramics High Purity Alumina Ceramics for Semiconductor Production (k pcs), Value (US$ Million), Price (USD/pcs) and Gross Margin (2021-2026)
- Table 105. Nishimura Advanced Ceramics High Purity Alumina Ceramics for Semiconductor Product Portfolio
- Table 106. Nishimura Advanced Ceramics Recent Development
- Table 107. Touch-Down Technology Company Information
- Table 108. Touch-Down Technology Business Overview
- Table 109. Touch-Down Technology High Purity Alumina Ceramics for Semiconductor Production (k pcs), Value (US$ Million), Price (USD/pcs) and Gross Margin (2021-2026)
- Table 110. Touch-Down Technology High Purity Alumina Ceramics for Semiconductor Product Portfolio
- Table 111. Touch-Down Technology Recent Development
- Table 112. HK TECH Company Information
- Table 113. HK TECH Business Overview
- Table 114. HK TECH High Purity Alumina Ceramics for Semiconductor Production (k pcs), Value (US$ Million), Price (USD/pcs) and Gross Margin (2021-2026)
- Table 115. HK TECH High Purity Alumina Ceramics for Semiconductor Product Portfolio
- Table 116. HK TECH Recent Development
- Table 117. St.Cera Company Information
- Table 118. St.Cera Business Overview
- Table 119. St.Cera High Purity Alumina Ceramics for Semiconductor Production (k pcs), Value (US$ Million), Price (USD/pcs) and Gross Margin (2021-2026)
- Table 120. St.Cera High Purity Alumina Ceramics for Semiconductor Product Portfolio
- Table 121. St.Cera Recent Development
- Table 122. Innovacera Company Information
- Table 123. Innovacera Business Overview
- Table 124. Innovacera High Purity Alumina Ceramics for Semiconductor Production (k pcs), Value (US$ Million), Price (USD/pcs) and Gross Margin (2021-2026)
- Table 125. Innovacera High Purity Alumina Ceramics for Semiconductor Product Portfolio
- Table 126. Innovacera Recent Development
- Table 127. Global High Purity Alumina Ceramics for Semiconductor Production Comparison by Region: 2021 VS 2025 VS 2032 (k pcs)
- Table 128. Global High Purity Alumina Ceramics for Semiconductor Production by Region (2021-2026) & (k pcs)
- Table 129. Global High Purity Alumina Ceramics for Semiconductor Production Market Share by Region (2021-2026)
- Table 130. Global High Purity Alumina Ceramics for Semiconductor Production Forecast by Region (2027-2032) & (k pcs)
- Table 131. Global High Purity Alumina Ceramics for Semiconductor Production Market Share Forecast by Region (2027-2032)
- Table 132. Global High Purity Alumina Ceramics for Semiconductor Production Value Comparison by Region: 2021 VS 2025 VS 2032 (US$ Million)
- Table 133. Global High Purity Alumina Ceramics for Semiconductor Production Value by Region (2021-2026) & (US$ Million)
- Table 134. Global High Purity Alumina Ceramics for Semiconductor Production Value Market Share by Region (2021-2026)
- Table 135. Global High Purity Alumina Ceramics for Semiconductor Production Value Forecast by Region (2027-2032) & (US$ Million)
- Table 136. Global High Purity Alumina Ceramics for Semiconductor Market Average Price (USD/pcs) by Region (2021-2026)
- Table 137. Global High Purity Alumina Ceramics for Semiconductor Market Average Price (USD/pcs) by Region (2027-2032)
- Table 138. Global High Purity Alumina Ceramics for Semiconductor Consumption Comparison by Region: 2021 VS 2025 VS 2032 (k pcs)
- Table 139. Global High Purity Alumina Ceramics for Semiconductor Consumption by Region (2021-2026) & (k pcs)
- Table 140. Global High Purity Alumina Ceramics for Semiconductor Consumption Market Share by Region (2021-2026)
- Table 141. Global High Purity Alumina Ceramics for Semiconductor Forecasted Consumption by Region (2027-2032) & (k pcs)
- Table 142. Global High Purity Alumina Ceramics for Semiconductor Forecasted Consumption Market Share by Region (2027-2032)
- Table 143. North America High Purity Alumina Ceramics for Semiconductor Consumption Growth Rate by Country: 2021 VS 2025 VS 2032 (k pcs)
- Table 144. North America High Purity Alumina Ceramics for Semiconductor Consumption by Country (2021-2026) & (k pcs)
- Table 145. North America High Purity Alumina Ceramics for Semiconductor Consumption by Country (2027-2032) & (k pcs)
- Table 146. Europe High Purity Alumina Ceramics for Semiconductor Consumption Growth Rate by Country: 2021 VS 2025 VS 2032 (k pcs)
- Table 147. Europe High Purity Alumina Ceramics for Semiconductor Consumption by Country (2021-2026) & (k pcs)
- Table 148. Europe High Purity Alumina Ceramics for Semiconductor Consumption by Country (2027-2032) & (k pcs)
- Table 149. Asia Pacific High Purity Alumina Ceramics for Semiconductor Consumption Growth Rate by Country: 2021 VS 2025 VS 2032 (k pcs)
- Table 150. Asia Pacific High Purity Alumina Ceramics for Semiconductor Consumption by Country (2021-2026) & (k pcs)
- Table 151. Asia Pacific High Purity Alumina Ceramics for Semiconductor Consumption by Country (2027-2032) & (k pcs)
- Table 152. South America, Middle East & Africa High Purity Alumina Ceramics for Semiconductor Consumption Growth Rate by Country: 2021 VS 2025 VS 2032 (k pcs)
- Table 153. South America, Middle East & Africa High Purity Alumina Ceramics for Semiconductor Consumption by Country (2021-2026) & (k pcs)
- Table 154. South America, Middle East & Africa High Purity Alumina Ceramics for Semiconductor Consumption by Country (2027-2032) & (k pcs)
- Table 155. Global High Purity Alumina Ceramics for Semiconductor Production by Type (2021-2026) & (k pcs)
- Table 156. Global High Purity Alumina Ceramics for Semiconductor Production by Type (2027-2032) & (k pcs)
- Table 157. Global High Purity Alumina Ceramics for Semiconductor Production Market Share by Type (2021-2026)
- Table 158. Global High Purity Alumina Ceramics for Semiconductor Production Market Share by Type (2027-2032)
- Table 159. Global High Purity Alumina Ceramics for Semiconductor Production Value by Type (2021-2026) & (US$ Million)
- Table 160. Global High Purity Alumina Ceramics for Semiconductor Production Value by Type (2027-2032) & (US$ Million)
- Table 161. Global High Purity Alumina Ceramics for Semiconductor Production Value Market Share by Type (2021-2026)
- Table 162. Global High Purity Alumina Ceramics for Semiconductor Production Value Market Share by Type (2027-2032)
- Table 163. Global High Purity Alumina Ceramics for Semiconductor Price by Type (2021-2026) & (USD/pcs)
- Table 164. Global High Purity Alumina Ceramics for Semiconductor Price by Type (2027-2032) & (USD/pcs)
- Table 165. Global High Purity Alumina Ceramics for Semiconductor Production by Application (2021-2026) & (k pcs)
- Table 166. Global High Purity Alumina Ceramics for Semiconductor Production by Application (2027-2032) & (k pcs)
- Table 167. Global High Purity Alumina Ceramics for Semiconductor Production Market Share by Application (2021-2026)
- Table 168. Global High Purity Alumina Ceramics for Semiconductor Production Market Share by Application (2027-2032)
- Table 169. Global High Purity Alumina Ceramics for Semiconductor Production Value by Application (2021-2026) & (US$ Million)
- Table 170. Global High Purity Alumina Ceramics for Semiconductor Production Value by Application (2027-2032) & (US$ Million)
- Table 171. Global High Purity Alumina Ceramics for Semiconductor Production Value Market Share by Application (2021-2026)
- Table 172. Global High Purity Alumina Ceramics for Semiconductor Production Value Market Share by Application (2027-2032)
- Table 173. Global High Purity Alumina Ceramics for Semiconductor Price by Application (2021-2026) & (USD/pcs)
- Table 174. Global High Purity Alumina Ceramics for Semiconductor Price by Application (2027-2032) & (USD/pcs)
- Table 175. Key Raw Materials
- Table 176. Raw Materials Key Suppliers
- Table 177. High Purity Alumina Ceramics for Semiconductor Distributors List
- Table 178. High Purity Alumina Ceramics for Semiconductor Customers List
- Table 179. High Purity Alumina Ceramics for Semiconductor Industry Trends
- Table 180. High Purity Alumina Ceramics for Semiconductor Industry Drivers
- Table 181. High Purity Alumina Ceramics for Semiconductor Industry Restraints
- Table 182. Authors List of This Report
List of Figures
- Figure 1. Research Methodology
- Figure 2. Research Process
- Figure 3. Key Executives Interviewed
- Figure 4. High Purity Alumina Ceramics for Semiconductor Product Image
- Figure 5. Market Value Comparison by Type (2021 VS 2025 VS 2032) & (US$ Million)
- Figure 6. <99.8% Product Image
- Figure 7. 99.8%–99.9% Product Image
- Figure 8. >99.9% Product Image
- Figure 9. Etching Equipment Product Image
- Figure 10. Deposition Equipment Product Image
- Figure 11. Thermal Processing Equipment Product Image
- Figure 12. Wafer Handling Equipment Product Image
- Figure 13. Lithography and Inspection Equipment Product Image
- Figure 14. Wafer Substrate Manufacturing Equipment Product Image
- Figure 15. Others Product Image
- Figure 16. Global High Purity Alumina Ceramics for Semiconductor Production Value (US$ Million), 2021 VS 2025 VS 2032
- Figure 17. Global High Purity Alumina Ceramics for Semiconductor Production Value (2021-2032) & (US$ Million)
- Figure 18. Global High Purity Alumina Ceramics for Semiconductor Production Capacity (2021-2032) & (k pcs)
- Figure 19. Global High Purity Alumina Ceramics for Semiconductor Production (2021-2032) & (k pcs)
- Figure 20. Global High Purity Alumina Ceramics for Semiconductor Average Price (USD/pcs) & (2021-2032)
- Figure 21. Global High Purity Alumina Ceramics for Semiconductor Key Manufacturers, Manufacturing Sites & Headquarters
- Figure 22. Global Top 5 and 10 High Purity Alumina Ceramics for Semiconductor Players Market Share by Production Value in 2025
- Figure 23. Manufacturers Type (Tier 1, Tier 2, and Tier 3): 2021 VS 2025
- Figure 24. Global High Purity Alumina Ceramics for Semiconductor Production Comparison by Region: 2021 VS 2025 VS 2032 (k pcs)
- Figure 25. Global High Purity Alumina Ceramics for Semiconductor Production Market Share by Region: 2021 VS 2025 VS 2032
- Figure 26. Global High Purity Alumina Ceramics for Semiconductor Production Value Comparison by Region: 2021 VS 2025 VS 2032 (US$ Million)
- Figure 27. Global High Purity Alumina Ceramics for Semiconductor Production Value Market Share by Region: 2021 VS 2025 VS 2032
- Figure 28. North America High Purity Alumina Ceramics for Semiconductor Production Value (US$ Million) Growth Rate (2021-2032)
- Figure 29. Europe High Purity Alumina Ceramics for Semiconductor Production Value (US$ Million) Growth Rate (2021-2032)
- Figure 30. China High Purity Alumina Ceramics for Semiconductor Production Value (US$ Million) Growth Rate (2021-2032)
- Figure 31. Japan High Purity Alumina Ceramics for Semiconductor Production Value (US$ Million) Growth Rate (2021-2032)
- Figure 32. Global High Purity Alumina Ceramics for Semiconductor Consumption Comparison by Region: 2021 VS 2025 VS 2032 (k pcs)
- Figure 33. Global High Purity Alumina Ceramics for Semiconductor Consumption Market Share by Region: 2021 VS 2025 VS 2032
- Figure 34. North America High Purity Alumina Ceramics for Semiconductor Consumption and Growth Rate (2021-2032) & (k pcs)
- Figure 35. North America High Purity Alumina Ceramics for Semiconductor Consumption Market Share by Country (2021-2032)
- Figure 36. United States High Purity Alumina Ceramics for Semiconductor Consumption and Growth Rate (2021-2032) & (k pcs)
- Figure 37. United States High Purity Alumina Ceramics for Semiconductor Consumption and Growth Rate (2021-2032) & (k pcs)
- Figure 38. Canada High Purity Alumina Ceramics for Semiconductor Consumption and Growth Rate (2021-2032) & (k pcs)
- Figure 39. Mexico High Purity Alumina Ceramics for Semiconductor Consumption and Growth Rate (2021-2032) & (k pcs)
- Figure 40. Europe High Purity Alumina Ceramics for Semiconductor Consumption and Growth Rate (2021-2032) & (k pcs)
- Figure 41. Europe High Purity Alumina Ceramics for Semiconductor Consumption Market Share by Country (2021-2032)
- Figure 42. Germany High Purity Alumina Ceramics for Semiconductor Consumption and Growth Rate (2021-2032) & (k pcs)
- Figure 43. France High Purity Alumina Ceramics for Semiconductor Consumption and Growth Rate (2021-2032) & (k pcs)
- Figure 44. U.K. High Purity Alumina Ceramics for Semiconductor Consumption and Growth Rate (2021-2032) & (k pcs)
- Figure 45. Italy High Purity Alumina Ceramics for Semiconductor Consumption and Growth Rate (2021-2032) & (k pcs)
- Figure 46. Russia High Purity Alumina Ceramics for Semiconductor Consumption and Growth Rate (2021-2032) & (k pcs)
- Figure 47. Spain High Purity Alumina Ceramics for Semiconductor Consumption and Growth Rate (2021-2032) & (k pcs)
- Figure 48. Netherlands High Purity Alumina Ceramics for Semiconductor Consumption and Growth Rate (2021-2032) & (k pcs)
- Figure 49. Switzerland High Purity Alumina Ceramics for Semiconductor Consumption and Growth Rate (2021-2032) & (k pcs)
- Figure 50. Sweden High Purity Alumina Ceramics for Semiconductor Consumption and Growth Rate (2021-2032) & (k pcs)
- Figure 51. Poland High Purity Alumina Ceramics for Semiconductor Consumption and Growth Rate (2021-2032) & (k pcs)
- Figure 52. Asia Pacific High Purity Alumina Ceramics for Semiconductor Consumption and Growth Rate (2021-2032) & (k pcs)
- Figure 53. Asia Pacific High Purity Alumina Ceramics for Semiconductor Consumption Market Share by Country (2021-2032)
- Figure 54. China High Purity Alumina Ceramics for Semiconductor Consumption and Growth Rate (2021-2032) & (k pcs)
- Figure 55. Japan High Purity Alumina Ceramics for Semiconductor Consumption and Growth Rate (2021-2032) & (k pcs)
- Figure 56. South Korea High Purity Alumina Ceramics for Semiconductor Consumption and Growth Rate (2021-2032) & (k pcs)
- Figure 57. India High Purity Alumina Ceramics for Semiconductor Consumption and Growth Rate (2021-2032) & (k pcs)
- Figure 58. Australia High Purity Alumina Ceramics for Semiconductor Consumption and Growth Rate (2021-2032) & (k pcs)
- Figure 59. Taiwan High Purity Alumina Ceramics for Semiconductor Consumption and Growth Rate (2021-2032) & (k pcs)
- Figure 60. Southeast Asia High Purity Alumina Ceramics for Semiconductor Consumption and Growth Rate (2021-2032) & (k pcs)
- Figure 61. South America, Middle East & Africa High Purity Alumina Ceramics for Semiconductor Consumption and Growth Rate (2021-2032) & (k pcs)
- Figure 62. South America, Middle East & Africa High Purity Alumina Ceramics for Semiconductor Consumption Market Share by Country (2021-2032)
- Figure 63. Brazil High Purity Alumina Ceramics for Semiconductor Consumption and Growth Rate (2021-2032) & (k pcs)
- Figure 64. Argentina High Purity Alumina Ceramics for Semiconductor Consumption and Growth Rate (2021-2032) & (k pcs)
- Figure 65. Chile High Purity Alumina Ceramics for Semiconductor Consumption and Growth Rate (2021-2032) & (k pcs)
- Figure 66. Turkey High Purity Alumina Ceramics for Semiconductor Consumption and Growth Rate (2021-2032) & (k pcs)
- Figure 67. GCC Countries High Purity Alumina Ceramics for Semiconductor Consumption and Growth Rate (2021-2032) & (k pcs)
- Figure 68. Global High Purity Alumina Ceramics for Semiconductor Production Market Share by Type (2021-2032)
- Figure 69. Global High Purity Alumina Ceramics for Semiconductor Production Value Market Share by Type (2021-2032)
- Figure 70. Global High Purity Alumina Ceramics for Semiconductor Price (USD/pcs) by Type (2021-2032)
- Figure 71. Global High Purity Alumina Ceramics for Semiconductor Production Market Share by Application (2021-2032)
- Figure 72. Global High Purity Alumina Ceramics for Semiconductor Production Value Market Share by Application (2021-2032)
- Figure 73. Global High Purity Alumina Ceramics for Semiconductor Price (USD/pcs) by Application (2021-2032)
- Figure 74. High Purity Alumina Ceramics for Semiconductor Value Chain
- Figure 75. High Purity Alumina Ceramics for Semiconductor Production Mode & Process
- Figure 76. Direct Comparison with Distribution Share
- Figure 77. Distributors Profiles
- Figure 78. High Purity Alumina Ceramics for Semiconductor Industry Opportunities and Challenges
Scope & coverage.
By Type
- <99.8%
- 99.8%–99.9%
- >99.9%
By Application
- Etching Equipment
- Deposition Equipment
- Thermal Processing Equipment
- Wafer Handling Equipment
- Lithography and Inspection Equipment
- Wafer Substrate Manufacturing Equipment
- Others
Companies covered
- Kyocera
- CoorsTek
- Ferrotec
- NGK
- NTK CERATEC
- TOTO
- Morgan Advanced Materials
- CeramTec
- MiCo Ceramics
- Suzhou KemaTek
- Materion
- STC Material Solutions
- Japan Fine Ceramics
- ASUZAC
- Precision Ceramics
- KCM Technology
- Top Seiko
- Nishimura Advanced Ceramics
- Touch-Down Technology
- HK TECH
- St.Cera
- Innovacera
Inside the report.
1 Preface
- 1.1 Scope of Report
- 1.2 Reasons for Doing This Study
- 1.3 Research Methodology
- 1.4 Research Process
- 1.5 Data Source
- 1.5.1 Secondary Sources
- 1.5.2 Primary Sources
2 Market Overview
- 2.1 Product Definition
- 2.2 High Purity Alumina Ceramics for Semiconductor by Type
- 2.2.1 Market Value Comparison by Type (2021 VS 2025 VS 2032) & (US$ Million)
- 2.2.2 <99.8%
- 2.2.3 99.8%–99.9%
- 2.2.4 >99.9%
- 2.3 High Purity Alumina Ceramics for Semiconductor by Application
- 2.3.1 Market Value Comparison by Application (2021 VS 2025 VS 2032) & (US$ Million)
- 2.3.2 Etching Equipment
- 2.3.3 Deposition Equipment
- 2.3.4 Thermal Processing Equipment
- 2.3.5 Wafer Handling Equipment
- 2.3.6 Lithography and Inspection Equipment
- 2.3.7 Wafer Substrate Manufacturing Equipment
- 2.3.8 Others
- 2.4 Global Market Growth Prospects
- 2.4.1 Global High Purity Alumina Ceramics for Semiconductor Production Value Estimates and Forecasts (2021-2032)
- 2.4.2 Global High Purity Alumina Ceramics for Semiconductor Production Capacity Estimates and Forecasts (2021-2032)
- 2.4.3 Global High Purity Alumina Ceramics for Semiconductor Production Estimates and Forecasts (2021-2032)
- 2.4.4 Global High Purity Alumina Ceramics for Semiconductor Market Average Price (2021-2032)
3 Market Competitive Landscape by Manufacturers
- 3.1 Global High Purity Alumina Ceramics for Semiconductor Production by Manufacturers (2021-2026)
- 3.2 Global High Purity Alumina Ceramics for Semiconductor Production Value by Manufacturers (2021-2026)
- 3.3 Global High Purity Alumina Ceramics for Semiconductor Average Price by Manufacturers (2021-2026)
- 3.4 Global High Purity Alumina Ceramics for Semiconductor Industry Manufacturers Ranking, 2024 VS 2025 VS 2026
- 3.5 Global High Purity Alumina Ceramics for Semiconductor Key Manufacturers, Manufacturing Sites & Headquarters
- 3.6 Global High Purity Alumina Ceramics for Semiconductor Manufacturers, Product Type & Application
- 3.7 Global High Purity Alumina Ceramics for Semiconductor Manufacturers Established Date
- 3.8 Global High Purity Alumina Ceramics for Semiconductor Market CR5 and HHI
- 3.9 Global Manufacturers Mergers & Acquisition
4 Manufacturers Profiled
- 4.1 Kyocera
- 4.1.1 Kyocera High Purity Alumina Ceramics for Semiconductor Company Information
- 4.1.2 Kyocera High Purity Alumina Ceramics for Semiconductor Business Overview
- 4.1.3 Kyocera High Purity Alumina Ceramics for Semiconductor Production Capacity, Value and Gross Margin (2021-2026)
- 4.1.4 Kyocera Product Portfolio
- 4.1.5 Kyocera Recent Developments
- 4.2 CoorsTek
- 4.2.1 CoorsTek High Purity Alumina Ceramics for Semiconductor Company Information
- 4.2.2 CoorsTek High Purity Alumina Ceramics for Semiconductor Business Overview
- 4.2.3 CoorsTek High Purity Alumina Ceramics for Semiconductor Production Capacity, Value and Gross Margin (2021-2026)
- 4.2.4 CoorsTek Product Portfolio
- 4.2.5 CoorsTek Recent Developments
- 4.3 Ferrotec
- 4.3.1 Ferrotec High Purity Alumina Ceramics for Semiconductor Company Information
- 4.3.2 Ferrotec High Purity Alumina Ceramics for Semiconductor Business Overview
- 4.3.3 Ferrotec High Purity Alumina Ceramics for Semiconductor Production Capacity, Value and Gross Margin (2021-2026)
- 4.3.4 Ferrotec Product Portfolio
- 4.3.5 Ferrotec Recent Developments
- 4.4 NGK
- 4.4.1 NGK High Purity Alumina Ceramics for Semiconductor Company Information
- 4.4.2 NGK High Purity Alumina Ceramics for Semiconductor Business Overview
- 4.4.3 NGK High Purity Alumina Ceramics for Semiconductor Production Capacity, Value and Gross Margin (2021-2026)
- 4.4.4 NGK Product Portfolio
- 4.4.5 NGK Recent Developments
- 4.5 NTK CERATEC
- 4.5.1 NTK CERATEC High Purity Alumina Ceramics for Semiconductor Company Information
- 4.5.2 NTK CERATEC High Purity Alumina Ceramics for Semiconductor Business Overview
- 4.5.3 NTK CERATEC High Purity Alumina Ceramics for Semiconductor Production Capacity, Value and Gross Margin (2021-2026)
- 4.5.4 NTK CERATEC Product Portfolio
- 4.5.5 NTK CERATEC Recent Developments
- 4.6 TOTO
- 4.6.1 TOTO High Purity Alumina Ceramics for Semiconductor Company Information
- 4.6.2 TOTO High Purity Alumina Ceramics for Semiconductor Business Overview
- 4.6.3 TOTO High Purity Alumina Ceramics for Semiconductor Production Capacity, Value and Gross Margin (2021-2026)
- 4.6.4 TOTO Product Portfolio
- 4.6.5 TOTO Recent Developments
- 4.7 Morgan Advanced Materials
- 4.7.1 Morgan Advanced Materials High Purity Alumina Ceramics for Semiconductor Company Information
- 4.7.2 Morgan Advanced Materials High Purity Alumina Ceramics for Semiconductor Business Overview
- 4.7.3 Morgan Advanced Materials High Purity Alumina Ceramics for Semiconductor Production Capacity, Value and Gross Margin (2021-2026)
- 4.7.4 Morgan Advanced Materials Product Portfolio
- 4.7.5 Morgan Advanced Materials Recent Developments
- 4.8 CeramTec
- 4.8.1 CeramTec High Purity Alumina Ceramics for Semiconductor Company Information
- 4.8.2 CeramTec High Purity Alumina Ceramics for Semiconductor Business Overview
- 4.8.3 CeramTec High Purity Alumina Ceramics for Semiconductor Production Capacity, Value and Gross Margin (2021-2026)
- 4.8.4 CeramTec Product Portfolio
- 4.8.5 CeramTec Recent Developments
- 4.9 MiCo Ceramics
- 4.9.1 MiCo Ceramics High Purity Alumina Ceramics for Semiconductor Company Information
- 4.9.2 MiCo Ceramics High Purity Alumina Ceramics for Semiconductor Business Overview
- 4.9.3 MiCo Ceramics High Purity Alumina Ceramics for Semiconductor Production Capacity, Value and Gross Margin (2021-2026)
- 4.9.4 MiCo Ceramics Product Portfolio
- 4.9.5 MiCo Ceramics Recent Developments
- 4.10 Suzhou KemaTek
- 4.10.1 Suzhou KemaTek High Purity Alumina Ceramics for Semiconductor Company Information
- 4.10.2 Suzhou KemaTek High Purity Alumina Ceramics for Semiconductor Business Overview
- 4.10.3 Suzhou KemaTek High Purity Alumina Ceramics for Semiconductor Production Capacity, Value and Gross Margin (2021-2026)
- 4.10.4 Suzhou KemaTek Product Portfolio
- 4.10.5 Suzhou KemaTek Recent Developments
- 4.11 Materion
- 4.11.1 Materion High Purity Alumina Ceramics for Semiconductor Company Information
- 4.11.2 Materion High Purity Alumina Ceramics for Semiconductor Business Overview
- 4.11.3 Materion High Purity Alumina Ceramics for Semiconductor Production Capacity, Value and Gross Margin (2021-2026)
- 4.11.4 Materion Product Portfolio
- 4.11.5 Materion Recent Developments
- 4.12 STC Material Solutions
- 4.12.1 STC Material Solutions High Purity Alumina Ceramics for Semiconductor Company Information
- 4.12.2 STC Material Solutions High Purity Alumina Ceramics for Semiconductor Business Overview
- 4.12.3 STC Material Solutions High Purity Alumina Ceramics for Semiconductor Production Capacity, Value and Gross Margin (2021-2026)
- 4.12.4 STC Material Solutions Product Portfolio
- 4.12.5 STC Material Solutions Recent Developments
- 4.13 Japan Fine Ceramics
- 4.13.1 Japan Fine Ceramics High Purity Alumina Ceramics for Semiconductor Company Information
- 4.13.2 Japan Fine Ceramics High Purity Alumina Ceramics for Semiconductor Business Overview
- 4.13.3 Japan Fine Ceramics High Purity Alumina Ceramics for Semiconductor Production Capacity, Value and Gross Margin (2021-2026)
- 4.13.4 Japan Fine Ceramics Product Portfolio
- 4.13.5 Japan Fine Ceramics Recent Developments
- 4.14 ASUZAC
- 4.14.1 ASUZAC High Purity Alumina Ceramics for Semiconductor Company Information
- 4.14.2 ASUZAC High Purity Alumina Ceramics for Semiconductor Business Overview
- 4.14.3 ASUZAC High Purity Alumina Ceramics for Semiconductor Production Capacity, Value and Gross Margin (2021-2026)
- 4.14.4 ASUZAC Product Portfolio
- 4.14.5 ASUZAC Recent Developments
- 4.15 Precision Ceramics
- 4.15.1 Precision Ceramics High Purity Alumina Ceramics for Semiconductor Company Information
- 4.15.2 Precision Ceramics High Purity Alumina Ceramics for Semiconductor Business Overview
- 4.15.3 Precision Ceramics High Purity Alumina Ceramics for Semiconductor Production Capacity, Value and Gross Margin (2021-2026)
- 4.15.4 Precision Ceramics Product Portfolio
- 4.15.5 Precision Ceramics Recent Developments
- 4.16 KCM Technology
- 4.16.1 KCM Technology High Purity Alumina Ceramics for Semiconductor Company Information
- 4.16.2 KCM Technology High Purity Alumina Ceramics for Semiconductor Business Overview
- 4.16.3 KCM Technology High Purity Alumina Ceramics for Semiconductor Production Capacity, Value and Gross Margin (2021-2026)
- 4.16.4 KCM Technology Product Portfolio
- 4.16.5 KCM Technology Recent Developments
- 4.17 Top Seiko
- 4.17.1 Top Seiko High Purity Alumina Ceramics for Semiconductor Company Information
- 4.17.2 Top Seiko High Purity Alumina Ceramics for Semiconductor Business Overview
- 4.17.3 Top Seiko High Purity Alumina Ceramics for Semiconductor Production Capacity, Value and Gross Margin (2021-2026)
- 4.17.4 Top Seiko Product Portfolio
- 4.17.5 Top Seiko Recent Developments
- 4.18 Nishimura Advanced Ceramics
- 4.18.1 Nishimura Advanced Ceramics High Purity Alumina Ceramics for Semiconductor Company Information
- 4.18.2 Nishimura Advanced Ceramics High Purity Alumina Ceramics for Semiconductor Business Overview
- 4.18.3 Nishimura Advanced Ceramics High Purity Alumina Ceramics for Semiconductor Production Capacity, Value and Gross Margin (2021-2026)
- 4.18.4 Nishimura Advanced Ceramics Product Portfolio
- 4.18.5 Nishimura Advanced Ceramics Recent Developments
- 4.19 Touch-Down Technology
- 4.19.1 Touch-Down Technology High Purity Alumina Ceramics for Semiconductor Company Information
- 4.19.2 Touch-Down Technology High Purity Alumina Ceramics for Semiconductor Business Overview
- 4.19.3 Touch-Down Technology High Purity Alumina Ceramics for Semiconductor Production Capacity, Value and Gross Margin (2021-2026)
- 4.19.4 Touch-Down Technology Product Portfolio
- 4.19.5 Touch-Down Technology Recent Developments
- 4.20 HK TECH
- 4.20.1 HK TECH High Purity Alumina Ceramics for Semiconductor Company Information
- 4.20.2 HK TECH High Purity Alumina Ceramics for Semiconductor Business Overview
- 4.20.3 HK TECH High Purity Alumina Ceramics for Semiconductor Production Capacity, Value and Gross Margin (2021-2026)
- 4.20.4 HK TECH Product Portfolio
- 4.20.5 HK TECH Recent Developments
- 4.21 St.Cera
- 4.21.1 St.Cera High Purity Alumina Ceramics for Semiconductor Company Information
- 4.21.2 St.Cera High Purity Alumina Ceramics for Semiconductor Business Overview
- 4.21.3 St.Cera High Purity Alumina Ceramics for Semiconductor Production Capacity, Value and Gross Margin (2021-2026)
- 4.21.4 St.Cera Product Portfolio
- 4.21.5 St.Cera Recent Developments
- 4.22 Innovacera
- 4.22.1 Innovacera High Purity Alumina Ceramics for Semiconductor Company Information
- 4.22.2 Innovacera High Purity Alumina Ceramics for Semiconductor Business Overview
- 4.22.3 Innovacera High Purity Alumina Ceramics for Semiconductor Production Capacity, Value and Gross Margin (2021-2026)
- 4.22.4 Innovacera Product Portfolio
- 4.22.5 Innovacera Recent Developments
5 Global High Purity Alumina Ceramics for Semiconductor Production by Region
- 5.1 Global High Purity Alumina Ceramics for Semiconductor Production Estimates and Forecasts by Region: 2021 VS 2025 VS 2032
- 5.2 Global High Purity Alumina Ceramics for Semiconductor Production by Region: 2021-2032
- 5.2.1 Global High Purity Alumina Ceramics for Semiconductor Production by Region: 2021-2026
- 5.2.2 Global High Purity Alumina Ceramics for Semiconductor Production Forecast by Region (2027-2032)
- 5.3 Global High Purity Alumina Ceramics for Semiconductor Production Value Estimates and Forecasts by Region: 2021 VS 2025 VS 2032
- 5.4 Global High Purity Alumina Ceramics for Semiconductor Production Value by Region: 2021-2032
- 5.4.1 Global High Purity Alumina Ceramics for Semiconductor Production Value by Region: 2021-2026
- 5.4.2 Global High Purity Alumina Ceramics for Semiconductor Production Value Forecast by Region (2027-2032)
- 5.5 Global High Purity Alumina Ceramics for Semiconductor Market Price Analysis by Region (2021-2026)
- 5.6 Global High Purity Alumina Ceramics for Semiconductor Production and Value, YOY Growth
- 5.6.1 North America High Purity Alumina Ceramics for Semiconductor Production Value Estimates and Forecasts (2021-2032)
- 5.6.2 Europe High Purity Alumina Ceramics for Semiconductor Production Value Estimates and Forecasts (2021-2032)
- 5.6.3 China High Purity Alumina Ceramics for Semiconductor Production Value Estimates and Forecasts (2021-2032)
- 5.6.4 Japan High Purity Alumina Ceramics for Semiconductor Production Value Estimates and Forecasts (2021-2032)
6 Global High Purity Alumina Ceramics for Semiconductor Consumption by Region
- 6.1 Global High Purity Alumina Ceramics for Semiconductor Consumption Estimates and Forecasts by Region: 2021 VS 2025 VS 2032
- 6.2 Global High Purity Alumina Ceramics for Semiconductor Consumption by Region (2021-2032)
- 6.2.1 Global High Purity Alumina Ceramics for Semiconductor Consumption by Region: 2021-2026
- 6.2.2 Global High Purity Alumina Ceramics for Semiconductor Forecasted Consumption by Region (2027-2032)
- 6.3 North America
- 6.3.1 North America High Purity Alumina Ceramics for Semiconductor Consumption Growth Rate by Country: 2021 VS 2025 VS 2032
- 6.3.2 North America High Purity Alumina Ceramics for Semiconductor Consumption by Country (2021-2032)
- 6.3.3 United States
- 6.3.4 Canada
- 6.3.5 Mexico
- 6.4 Europe
- 6.4.1 Europe High Purity Alumina Ceramics for Semiconductor Consumption Growth Rate by Country: 2021 VS 2025 VS 2032
- 6.4.2 Europe High Purity Alumina Ceramics for Semiconductor Consumption by Country (2021-2032)
- 6.4.3 Germany
- 6.4.4 France
- 6.4.5 U.K.
- 6.4.6 Italy
- 6.4.7 Russia
- 6.4.8 Spain
- 6.4.9 Netherlands
- 6.4.10 Switzerland
- 6.4.11 Sweden
- 6.4.12 Poland
- 6.5 Asia Pacific
- 6.5.1 Asia Pacific High Purity Alumina Ceramics for Semiconductor Consumption Growth Rate by Country: 2021 VS 2025 VS 2032
- 6.5.2 Asia Pacific High Purity Alumina Ceramics for Semiconductor Consumption by Country (2021-2032)
- 6.5.3 China
- 6.5.4 Japan
- 6.5.5 South Korea
- 6.5.6 India
- 6.5.7 Australia
- 6.5.8 Taiwan
- 6.5.9 Southeast Asia
- 6.6 South America, Middle East & Africa
- 6.6.1 South America, Middle East & Africa High Purity Alumina Ceramics for Semiconductor Consumption Growth Rate by Country: 2021 VS 2025 VS 2032
- 6.6.2 South America, Middle East & Africa High Purity Alumina Ceramics for Semiconductor Consumption by Country (2021-2032)
- 6.6.3 Brazil
- 6.6.4 Argentina
- 6.6.5 Chile
- 6.6.6 Turkey
- 6.6.7 GCC Countries
7 Segment by Type
- 7.1 Global High Purity Alumina Ceramics for Semiconductor Production by Type (2021-2032)
- 7.1.1 Global High Purity Alumina Ceramics for Semiconductor Production by Type (2021-2032) & (k pcs)
- 7.1.2 Global High Purity Alumina Ceramics for Semiconductor Production Market Share by Type (2021-2032)
- 7.2 Global High Purity Alumina Ceramics for Semiconductor Production Value by Type (2021-2032)
- 7.2.1 Global High Purity Alumina Ceramics for Semiconductor Production Value by Type (2021-2032) & (US$ Million)
- 7.2.2 Global High Purity Alumina Ceramics for Semiconductor Production Value Market Share by Type (2021-2032)
- 7.3 Global High Purity Alumina Ceramics for Semiconductor Price by Type (2021-2032)
8 Segment by Application
- 8.1 Global High Purity Alumina Ceramics for Semiconductor Production by Application (2021-2032)
- 8.1.1 Global High Purity Alumina Ceramics for Semiconductor Production by Application (2021-2032) & (k pcs)
- 8.1.2 Global High Purity Alumina Ceramics for Semiconductor Production Market Share by Application (2021-2032)
- 8.2 Global High Purity Alumina Ceramics for Semiconductor Production Value by Application (2021-2032)
- 8.2.1 Global High Purity Alumina Ceramics for Semiconductor Production Value by Application (2021-2032) & (US$ Million)
- 8.2.2 Global High Purity Alumina Ceramics for Semiconductor Production Value Market Share by Application (2021-2032)
- 8.3 Global High Purity Alumina Ceramics for Semiconductor Price by Application (2021-2032)
9 Value Chain and Sales Channels Analysis of the Market
- 9.1 High Purity Alumina Ceramics for Semiconductor Value Chain Analysis
- 9.1.1 High Purity Alumina Ceramics for Semiconductor Key Raw Materials
- 9.1.2 Raw Materials Key Suppliers
- 9.1.3 High Purity Alumina Ceramics for Semiconductor Production Mode & Process
- 9.2 High Purity Alumina Ceramics for Semiconductor Sales Channels Analysis
- 9.2.1 Direct Comparison with Distribution Share
- 9.2.2 High Purity Alumina Ceramics for Semiconductor Distributors
- 9.2.3 High Purity Alumina Ceramics for Semiconductor Customers
10 Global High Purity Alumina Ceramics for Semiconductor Analyzing Market Dynamics
- 10.1 High Purity Alumina Ceramics for Semiconductor Industry Trends
- 10.2 High Purity Alumina Ceramics for Semiconductor Industry Drivers
- 10.3 High Purity Alumina Ceramics for Semiconductor Industry Opportunities and Challenges
- 10.4 High Purity Alumina Ceramics for Semiconductor Industry Restraints
11 Report Conclusion
12 Disclaimer
GET THE RESEARCH
Choose your license.
PDF by email within 3–5 working days after payment confirmation.
Talk to an analyst