APO RESEARCH · REPORT
Ethylene n Butyl Acrylate Copolymer (EnBA)
Ethylene n Butyl Acrylate Copolymer (EnBA), also commonly designated EBA in commercial polymer literature, is a thermoplastic ethylene acrylate copolymer formed from ethylene and n butyl acrylate monomer units.
Product & engineering
Understand the product.
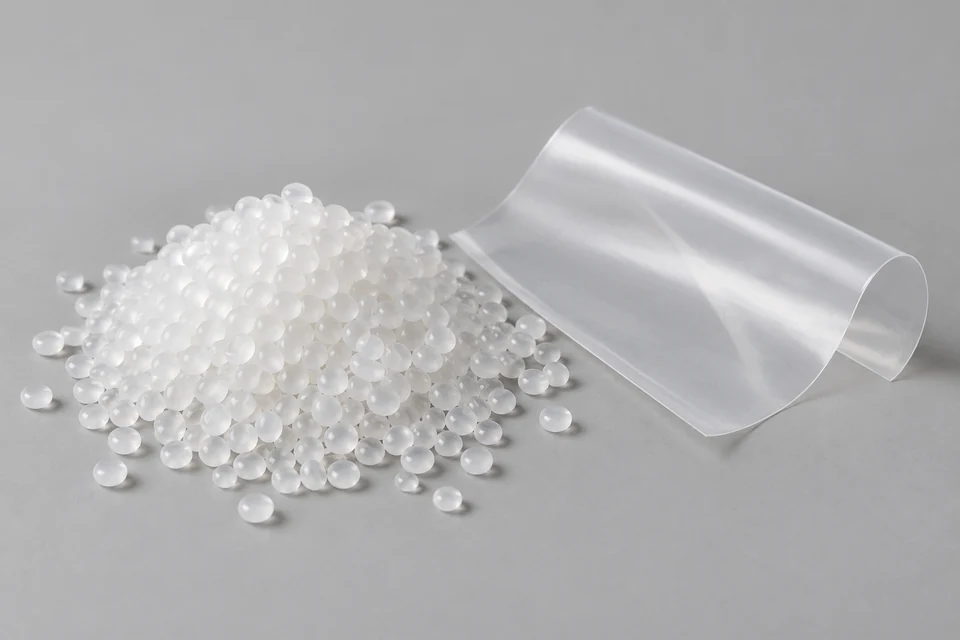
Ethylene n Butyl Acrylate Copolymer (EnBA), also commonly designated EBA in commercial polymer literature, is a thermoplastic ethylene acrylate copolymer formed from ethylene and n butyl acrylate monomer units. Its molecular structure consists predominantly of polyethylene chain segments containing randomly incorporated n butyl acrylate units with pendant ester groups. Incorporation of n butyl acrylate disrupts polyethylene crystallinity and molecular packing, reducing stiffness and melting temperature while increasing flexibility, toughness, polarity and low temperature ductility. The magnitude of these effects is governed primarily by n butyl acrylate concentration and molecular weight distribution. Commercial EnBA grades therefore span a wide range of comonomer contents and melt flow characteristics, allowing the material to range from relatively high molecular weight extrusion resins to very high flow adhesive resins. These variables determine crystallinity, modulus, thermal behavior, melt viscosity, filler acceptance, compatibility with polar and nonpolar polymers, interfacial adhesion and conversion behavior. The ester functionality gives EnBA greater polarity than conventional polyethylene while the ethylene rich backbone retains thermoplastic melt processing capability, chemical resistance and polyolefin compatibility.
EnBA is commonly manufactured by high pressure free radical copolymerization and supplied as pelletized resin for extrusion, film conversion, coating, compounding, blending and adhesive formulation. Commercial grades illustrate the breadth of the chemistry. Repsol Ebantix E1770 contains approximately 17% butyl acrylate with a melt flow index of about 7 g per 10 min and is used in extrusion coating and coextrusion applications, representing the lower comonomer portion of the commercial EnBA range. Westlake EBAC SP1802 contains approximately 22.5 wt% butyl acrylate with a melt index of 0.5 g per 10 min and a melting point of about 87°C, providing a relatively high molecular weight, flexible resin for films, compatibilization and impact modification. Dow ELVALOY AC 3427 contains approximately 27% butyl acrylate with a melt index of 4 g per 10 min and a melting point of about 94°C, and is used in polymer modification, compounding and hot melt adhesive formulations. ExxonMobil ENBA330033 contains approximately 32.5 wt% n butyl acrylate and has a melt index of about 330 g per 10 min, giving very high melt flow for hot melt adhesives, sealants and wax blends. These grades demonstrate how increasing comonomer level and changing molecular weight can produce materially different rheological, mechanical and interfacial behavior within the same EnBA chemistry.
The combination of adjustable polarity, flexibility, melt rheology, filler compatibility and adhesion gives EnBA established use in wire and cable compounds, packaging films, extrusion coating, adhesive formulations, masterbatch systems and polymer modification. In wire and cable applications, EnBA is used in compounds and semiconductive materials where polymer compatibility, dispersion of conductive fillers, flexibility and processing stability are critical. In packaging and film applications, lower and intermediate n butyl acrylate grades provide flexibility, low temperature performance, transparency and adhesion to polar substrates. Higher n butyl acrylate and higher flow grades are particularly suited to hot melt adhesive and sealant formulations where melt viscosity and substrate wetting are important formulation parameters. Repsol currently markets EBA grades for film, cable and adhesive applications, while ExxonMobil, Dow and Westlake maintain commercial EnBA or EBA grades spanning adhesive, film, compounding and modification uses.
EnBA is chemically distinct from Ethylene Acrylic Acid Copolymer. EnBA contains ester groups derived from n butyl acrylate. EAA contains free carboxylic acid groups derived from acrylic acid. This difference changes polarity, acid functionality, adhesion mechanism, compatibility, moisture response and downstream formulation behavior, and places EnBA within the functional ethylene acrylate copolymer family used where controlled flexibility and moderate polarity are required.
Composition, supplied form and processing history determine the usable material. Evaluate the property required by the actual application with the specified test method; a chemistry name alone does not define a finished grade.
What turns activity into demand
Qualified formulation or component output creates material purchases through loading, process yield and the supplied mass basis. Raw material, formulated blend and finished-part revenues describe separate transaction stages.
The commercial boundary
For Ethylene n Butyl Acrylate Copolymer (EnBA), distinguish the supplied product from its inputs and the complete application. Report types and applications may overlap; retain the selected edition's product definition, geography, period, unit and transaction basis when comparing estimates.
Which conditions determine usable ethylene n butyl acrylate copolymer (enba) performance?
Ethylene n Butyl Acrylate Copolymer (EnBA), also commonly designated EBA in commercial polymer literature, is a thermoplastic ethylene acrylate copolymer formed from ethylene and n butyl acrylate monomer units. Match formulation and impurity limits to the converting process, then verify the property after processing or curing. Compare like-for-like dry or as-supplied quantities; a finished component and its raw material represent different transaction stages.
Selected research
Market Outlook & Growth Opportunities
Global Ethylene n Butyl Acrylate Copolymer (EnBA) Market Outlook and Growth Opportunities 2026
Market perspective
According to APO Research, Inc, global ethylene n butyl acrylate copolymer demand reached approximately 101,003.83 tons in 2025, with market revenue of about USD 221.38 million and a weighted factory gate net price of approximately USD 2,191.80 per ton. Sales volume is expected to increase to 106,741.51 tons in 2026, while revenue rises to USD 258.75 million and average price recovers to about USD 2,424.08 per ton. By 2032, global sales volume is projected to reach 126,062.59 tons, with revenue of approximately USD 309.57 million and an average price of about USD 2,455.68 per ton. From 2026 to 2032, volume and revenue are expected to expand at compound annual growth rates of approximately 2.81% and 3.03%, respectively. The limited gap between revenue and volume growth indicates that long range market expansion will rely primarily on additional physical consumption, a gradual normalization of pricing and a richer mix of higher value applications. The global average price reached USD 2,875.15 per ton in 2022 and subsequently declined through 2025 as feedstock, energy, inventory and regional supply conditions normalized. The relatively small scale of EnBA compared with LDPE and EVA also limits the economic case for continuous large capacity additions, favoring staged expansion through flexible high pressure assets, selective retrofits and a limited number of dedicated additions.
The industrial barrier in EnBA lies in the combination of high pressure polymerization assets, repeatable commercial operation and downstream qualification. Production requires high pressure ethylene compression, autoclave or tubular polymerization, precise nBA metering and injection, monomer recycle, separation and pelletizing, while commercial consistency depends on maintaining narrow ranges for nBA content, melt index, molecular weight distribution, gel level, impurities and batch variation. Most major suppliers operate EnBA within shared high pressure ethylene copolymer systems that also manufacture LDPE, EVA, EMA, EEA and related specialty materials. Total high pressure reactor capability therefore differs materially from effective annual EnBA capacity. Reactor time is allocated according to order size, contribution economics, transition losses, minimum campaign size and customer delivery commitments. In 2025, the five largest producers accounted for approximately 62.00% of global sales volume and the ten largest for approximately 98.56%. Established suppliers retain structural advantages from long operating histories, stable process windows, broad grade ranges and customer formulations developed around qualified materials. Hanwha Solutions materially increased Asian supply after commercial production began in 2022, while Chinese capacity is entering the industrial ramp phase. Future share redistribution will depend on sustained qualified output and the speed at which new production is converted into approved customer demand.
Application economics provide a clear direction for future demand. Wire and cable was the largest EnBA application in 2025, consuming approximately 42,522.61 tons and representing about 42.10% of global volume, with revenue of approximately USD 96.37 million. Consumption in this segment is projected to reach 56,980.29 tons by 2032, raising its volume share to approximately 45.20%. High voltage and extra high voltage cable compounds, semiconductive shielding materials, highly filled halogen free flame retardant systems, offshore wind transmission and grid expansion require stable filler loading, carbon black dispersion, flexibility, low temperature performance and extrusion behavior. Qualification cycles are lengthy because changes in base resin can affect compounding, carbon black network formation, extrusion surface, crosslinking behavior and long duration electrical performance. This gives established grades stronger commercial persistence than materials used in less demanding applications. Adhesives and sealants remain the second largest application, with 2025 demand of approximately 24,240.92 tons, although EVA, POE and APAO continue to create substitution pressure. Film and packaging consumed approximately 18,180.69 tons in 2025, while downgauging, multilayer optimization and material efficiency limit the conversion of packaging area growth into resin volume. Polymer modification accounted for approximately 10.20% of global volume in 2025. Products with nBA content of at least 20% represented approximately 52,495.35 tons, or 51.97% of global volume, and continue to command a higher average selling price because of their value in flexible, highly filled and specialized formulations.
Read the full market overview
Regional supply and demand are gradually shifting from a predominantly European and North American structure toward a more balanced system that includes a larger Asian contribution. Europe remains the largest production base, although its share of global output is expected to decline over the forecast period. North America retains a significant role through competitive ethylene supply, established high pressure assets and stable cable, packaging and adhesive demand. Korea has become a meaningful Asian production center, while China is experiencing simultaneous demand growth and the initial development of domestic commercial supply. Chinese EnBA sales are expected to increase from approximately 21,331.03 tons in 2025 to 23,356.48 tons in 2026 and 31,085.16 tons by 2032, placing China slightly above North America and Europe in volume by the end of the forecast period. Growth is being driven by power grid investment, high voltage cable production, industrial materials and functional polymer demand, while domestic commercial production remains in the ramp phase and imports continue to play a significant role. Global production and sales remain closely aligned over time, with annual differences largely reflecting inventory movement, campaign timing and sales recognition. Industry profitability will continue to depend on ethylene and nBA costs, effective asset utilization, transition losses, qualified yield, customer approval, high value application mix and regional supply efficiency. Producers with mature high pressure operating capability, consistent product quality, deep customer qualification and flexible multi product scheduling are expected to retain the strongest competitive economics as Asian supply continues to expand.
This report provides an overview of the global Ethylene n Butyl Acrylate Copolymer (EnBA) market in terms of sales, revenue, and price, analyzing global market trends using historical revenue and sales data for 2021-2025, estimates for 2026, and projected CAGRs through 2032.
The study covers key producers of Ethylene n Butyl Acrylate Copolymer (EnBA) and sales in major regions and countries, assesses future market potential, and highlights priority regions and countries for segmenting the market into sub-sectors, with country-specific market value data for the U.S., Canada, Mexico, Brazil, China, Japan, South Korea, Southeast Asia, India, Germany, the U.K., Italy, the Middle East, Africa, and other countries.
The report also presents Ethylene n Butyl Acrylate Copolymer (EnBA) sales, revenue, market share, and industry ranking for the main manufacturers for 2021-2026, identifies the major stakeholders in the global market, and analyzes their competitive landscape and market positioning based on recent developments and segmental revenues.
In addition, the report analyzes segment data by Type and Application—covering sales, revenue, and price—for 2021-2032, and evaluates and forecasts the Ethylene n Butyl Acrylate Copolymer (EnBA) market size, projected growth trends, production technologies, key applications, and end-use industries.
Ethylene n Butyl Acrylate Copolymer (EnBA) Segment by Company
Dow Inc.
SK Functional Polymer
ExxonMobil
Repsol
Borealis
Hanwha Solutions
LUCOBIT
LyondellBasell
Westlake
INEOS
Ethylene n Butyl Acrylate Copolymer (EnBA) Segment by Type
nBA Content ≥20%
nBA Content <20%
Ethylene n Butyl Acrylate Copolymer (EnBA) Segment by Application
Wire & Cable
Adhesives & Sealants
Films & Packaging
Polymer Modification
Others
Ethylene n Butyl Acrylate Copolymer (EnBA) Segment by Region
North America
United States
Canada
Mexico
Europe
Germany
France
U.K.
Italy
Russia
Spain
Netherlands
Switzerland
Sweden
Poland
Asia-Pacific
China
Japan
South Korea
India
Australia
Taiwan
Southeast Asia
South America
Brazil
Argentina
Chile
Colombia
Middle East & Africa
Egypt
South Africa
Israel
Türkiye
GCC Countries
Study Objectives
1. To analyze and research the global Ethylene n Butyl Acrylate Copolymer (EnBA) status and future forecast, involving, sales, revenue, growth rate (CAGR), market share, historical and forecast.
2. To present the key manufacturers, sales, revenue, market share, and Recent Developments.
3. To split the breakdown data by regions, type, manufacturers, and Application.
4. To analyze the global and key regions Ethylene n Butyl Acrylate Copolymer (EnBA) market potential and advantage, opportunity and challenge, restraints, and risks.
5. To identify Ethylene n Butyl Acrylate Copolymer (EnBA) significant trends, drivers, influence factors in global and regions.
6. To analyze Ethylene n Butyl Acrylate Copolymer (EnBA) competitive developments such as expansions, agreements, new product launches, and acquisitions in the market.
Reasons to Buy This Report
1. This report will help the readers to understand the competition within the industries and strategies for the competitive environment to enhance the potential profit. The report also focuses on the competitive landscape of the global Ethylene n Butyl Acrylate Copolymer (EnBA) market, and introduces in detail the market share, industry ranking, competitor ecosystem, market performance, new product development, operation situation, expansion, and acquisition. etc. of the main players, which helps the readers to identify the main competitors and deeply understand the competition pattern of the market.
2. This report will help stakeholders to understand the global industry status and trends of Ethylene n Butyl Acrylate Copolymer (EnBA) and provides them with information on key market drivers, restraints, challenges, and opportunities.
3. This report will help stakeholders to understand competitors better and gain more insights to strengthen their position in their businesses. The competitive landscape section includes the market share and rank (in sales and value), competitor ecosystem, new product development, expansion, and acquisition.
4. This report stays updated with novel technology integration, features, and the latest developments in the market.
5. This report helps stakeholders to gain insights into which regions to target globally.
6. This report helps stakeholders to gain insights into the end-user perception concerning the adoption of Ethylene n Butyl Acrylate Copolymer (EnBA).
7. This report helps stakeholders to identify some of the key players in the market and understand their valuable contribution.
Chapter Outline
Chapter 1: Provides an overview of the Ethylene n Butyl Acrylate Copolymer (EnBA) market, including product definition, global market growth prospects, sales value, sales volume, and average price forecasts (2021-2032).
Chapter 2: Analysis key trends, drivers, challenges, and opportunities within the global Ethylene n Butyl Acrylate Copolymer (EnBA) industry.
Chapter 3: Detailed analysis of Ethylene n Butyl Acrylate Copolymer (EnBA) manufacturers competitive landscape, price, sales and revenue market share, latest development plan, merger, and acquisition information, etc.
Chapter 4: Provides the analysis of various market segments by type, covering the market size and development potential of each market segment, to help readers find the blue ocean market in different market segments.
Chapter 5: Provides the analysis of various market segments by application, covering the market size and development potential of each market segment, to help readers find the blue ocean market in different downstream markets.
Chapter 6: Sales and value of Ethylene n Butyl Acrylate Copolymer (EnBA) in regional level. It provides a quantitative analysis of the market size and development potential of each region and introduces the market development, future development prospects, market space, and market size of each country in the world.
Chapter 7: Sales and value of Ethylene n Butyl Acrylate Copolymer (EnBA) in country level. It provides sigmate data by type, and by application for each country/region.
Chapter 8: Provides profiles of key players, introducing the basic situation of the main companies in the market in detail, including product sales, revenue, price, gross margin, product introduction, recent development, etc.
Chapter 9: Analysis of industrial chain, including the upstream and downstream of the industry.
Chapter 10: Concluding Insights.
More report detail
Tables and figures
Scope & coverage.
Types
- nBA Content ≥20%
- nBA Content <20%
Applications
- Wire & Cable
- Adhesives & Sealants
- Films & Packaging
- Polymer Modification
- Others
Companies covered
- Dow Inc.
- SK Functional Polymer
- ExxonMobil
- Repsol
- Borealis
- Hanwha Solutions
- LUCOBIT
- LyondellBasell
- Westlake
- INEOS
Inside the report.
1 Market Overview
- 1.1 Product Definition
- 1.2 Global Market Growth Prospects
- 1.2.1 Global Ethylene n Butyl Acrylate Copolymer (EnBA) Sales Value (2021-2032)
- 1.2.2 Global Ethylene n Butyl Acrylate Copolymer (EnBA) Sales Volume (2021-2032)
- 1.2.3 Global Ethylene n Butyl Acrylate Copolymer (EnBA) Sales Average Price (2021-2032)
- 1.3 Assumptions and Limitations
- 1.4 Study Goals and Objectives
2 Ethylene n Butyl Acrylate Copolymer (EnBA) Market Dynamics
- 2.1 Ethylene n Butyl Acrylate Copolymer (EnBA) Industry Trends
- 2.2 Ethylene n Butyl Acrylate Copolymer (EnBA) Industry Drivers
- 2.3 Ethylene n Butyl Acrylate Copolymer (EnBA) Industry Opportunities and Challenges
- 2.4 Ethylene n Butyl Acrylate Copolymer (EnBA) Industry Restraints
3 Ethylene n Butyl Acrylate Copolymer (EnBA) Market by Company
- 3.1 Global Ethylene n Butyl Acrylate Copolymer (EnBA) Company Revenue Ranking in 2025
- 3.2 Global Ethylene n Butyl Acrylate Copolymer (EnBA) Revenue by Company (2021-2026)
- 3.3 Global Ethylene n Butyl Acrylate Copolymer (EnBA) Sales Volume by Company (2021-2026)
- 3.4 Global Ethylene n Butyl Acrylate Copolymer (EnBA) Average Price by Company (2021-2026)
- 3.5 Global Ethylene n Butyl Acrylate Copolymer (EnBA) Company Ranking (2024-2026)
- 3.6 Global Ethylene n Butyl Acrylate Copolymer (EnBA) Company Manufacturing Base and Headquarters
- 3.7 Global Ethylene n Butyl Acrylate Copolymer (EnBA) Company Product Type and Application
- 3.8 Global Ethylene n Butyl Acrylate Copolymer (EnBA) Company Establishment Date
- 3.9 Market Competitive Analysis
- 3.9.1 Global Ethylene n Butyl Acrylate Copolymer (EnBA) Market Concentration Ratio (CR5 and HHI)
- 3.9.2 Global Top 5 and 10 Company Market Share by Revenue in 2025
- 3.9.3 2025 Ethylene n Butyl Acrylate Copolymer (EnBA) Tier 1, Tier 2, and Tier 3 Companies
- 3.10 Mergers and Acquisitions Expansion
4 Ethylene n Butyl Acrylate Copolymer (EnBA) Market by Type
- 4.1 Ethylene n Butyl Acrylate Copolymer (EnBA) Type Introduction
- 4.1.1 nBA Content ≥20%
- 4.1.2 nBA Content <20%
- 4.2 Global Ethylene n Butyl Acrylate Copolymer (EnBA) Sales Volume by Type
- 4.2.1 Global Ethylene n Butyl Acrylate Copolymer (EnBA) Sales Volume by Type (2021 VS 2025 VS 2032)
- 4.2.2 Global Ethylene n Butyl Acrylate Copolymer (EnBA) Sales Volume by Type (2021-2032)
- 4.2.3 Global Ethylene n Butyl Acrylate Copolymer (EnBA) Sales Volume Share by Type (2021-2032)
- 4.3 Global Ethylene n Butyl Acrylate Copolymer (EnBA) Sales Value by Type
- 4.3.1 Global Ethylene n Butyl Acrylate Copolymer (EnBA) Sales Value by Type (2021 VS 2025 VS 2032)
- 4.3.2 Global Ethylene n Butyl Acrylate Copolymer (EnBA) Sales Value by Type (2021-2032)
- 4.3.3 Global Ethylene n Butyl Acrylate Copolymer (EnBA) Sales Value Share by Type (2021-2032)
5 Ethylene n Butyl Acrylate Copolymer (EnBA) Market by Application
- 5.1 Ethylene n Butyl Acrylate Copolymer (EnBA) Application Introduction
- 5.1.1 Wire & Cable
- 5.1.2 Adhesives & Sealants
- 5.1.3 Films & Packaging
- 5.1.4 Polymer Modification
- 5.1.5 Others
- 5.2 Global Ethylene n Butyl Acrylate Copolymer (EnBA) Sales Volume by Application
- 5.2.1 Global Ethylene n Butyl Acrylate Copolymer (EnBA) Sales Volume by Application (2021 VS 2025 VS 2032)
- 5.2.2 Global Ethylene n Butyl Acrylate Copolymer (EnBA) Sales Volume by Application (2021-2032)
- 5.2.3 Global Ethylene n Butyl Acrylate Copolymer (EnBA) Sales Volume Share by Application (2021-2032)
- 5.3 Global Ethylene n Butyl Acrylate Copolymer (EnBA) Sales Value by Application
- 5.3.1 Global Ethylene n Butyl Acrylate Copolymer (EnBA) Sales Value by Application (2021 VS 2025 VS 2032)
- 5.3.2 Global Ethylene n Butyl Acrylate Copolymer (EnBA) Sales Value by Application (2021-2032)
- 5.3.3 Global Ethylene n Butyl Acrylate Copolymer (EnBA) Sales Value Share by Application (2021-2032)
6 Ethylene n Butyl Acrylate Copolymer (EnBA) Regional Sales and Value Analysis
- 6.1 Global Ethylene n Butyl Acrylate Copolymer (EnBA) Sales by Region: 2021 VS 2025 VS 2032
- 6.2 Global Ethylene n Butyl Acrylate Copolymer (EnBA) Sales by Region (2021-2032)
- 6.2.1 Global Ethylene n Butyl Acrylate Copolymer (EnBA) Sales by Region: 2021-2026
- 6.2.2 Global Ethylene n Butyl Acrylate Copolymer (EnBA) Sales by Region (2027-2032)
- 6.3 Global Ethylene n Butyl Acrylate Copolymer (EnBA) Sales Value by Region: 2021 VS 2025 VS 2032
- 6.4 Global Ethylene n Butyl Acrylate Copolymer (EnBA) Sales Value by Region (2021-2032)
- 6.4.1 Global Ethylene n Butyl Acrylate Copolymer (EnBA) Sales Value by Region: 2021-2026
- 6.4.2 Global Ethylene n Butyl Acrylate Copolymer (EnBA) Sales Value by Region (2027-2032)
- 6.5 Global Ethylene n Butyl Acrylate Copolymer (EnBA) Market Price Analysis by Region (2021-2026)
- 6.6 North America
- 6.6.1 North America Ethylene n Butyl Acrylate Copolymer (EnBA) Sales Value (2021-2032)
- 6.6.2 North America Ethylene n Butyl Acrylate Copolymer (EnBA) Sales Value Share by Country, 2025 VS 2032
- 6.7 Europe
- 6.7.1 Europe Ethylene n Butyl Acrylate Copolymer (EnBA) Sales Value (2021-2032)
- 6.7.2 Europe Ethylene n Butyl Acrylate Copolymer (EnBA) Sales Value Share by Country, 2025 VS 2032
- 6.8 Asia-Pacific
- 6.8.1 Asia-Pacific Ethylene n Butyl Acrylate Copolymer (EnBA) Sales Value (2021-2032)
- 6.8.2 Asia-Pacific Ethylene n Butyl Acrylate Copolymer (EnBA) Sales Value Share by Country, 2025 VS 2032
- 6.9 South America
- 6.9.1 South America Ethylene n Butyl Acrylate Copolymer (EnBA) Sales Value (2021-2032)
- 6.9.2 South America Ethylene n Butyl Acrylate Copolymer (EnBA) Sales Value Share by Country, 2025 VS 2032
- 6.10 Middle East & Africa
- 6.10.1 Middle East & Africa Ethylene n Butyl Acrylate Copolymer (EnBA) Sales Value (2021-2032)
- 6.10.2 Middle East & Africa Ethylene n Butyl Acrylate Copolymer (EnBA) Sales Value Share by Country, 2025 VS 2032
7 Ethylene n Butyl Acrylate Copolymer (EnBA) Country-level Sales and Value Analysis
- 7.1 Global Ethylene n Butyl Acrylate Copolymer (EnBA) Sales by Country: 2021 VS 2025 VS 2032
- 7.2 Global Ethylene n Butyl Acrylate Copolymer (EnBA) Sales Value by Country: 2021 VS 2025 VS 2032
- 7.3 Global Ethylene n Butyl Acrylate Copolymer (EnBA) Sales by Country (2021-2032)
- 7.3.1 Global Ethylene n Butyl Acrylate Copolymer (EnBA) Sales by Country (2021-2026)
- 7.3.2 Global Ethylene n Butyl Acrylate Copolymer (EnBA) Sales by Country (2027-2032)
- 7.4 Global Ethylene n Butyl Acrylate Copolymer (EnBA) Sales Value by Country (2021-2032)
- 7.4.1 Global Ethylene n Butyl Acrylate Copolymer (EnBA) Sales Value by Country (2021-2026)
- 7.4.2 Global Ethylene n Butyl Acrylate Copolymer (EnBA) Sales Value by Country (2027-2032)
- 7.5 USA
- 7.5.1 USA Ethylene n Butyl Acrylate Copolymer (EnBA) Sales Value Growth Rate (2021-2032)
- 7.5.2 USA Ethylene n Butyl Acrylate Copolymer (EnBA) Sales Value Share by Type, 2025 VS 2032
- 7.5.3 USA Ethylene n Butyl Acrylate Copolymer (EnBA) Sales Value Share by Application, 2025 VS 2032
- 7.6 Canada
- 7.6.1 Canada Ethylene n Butyl Acrylate Copolymer (EnBA) Sales Value Growth Rate (2021-2032)
- 7.6.2 Canada Ethylene n Butyl Acrylate Copolymer (EnBA) Sales Value Share by Type, 2025 VS 2032
- 7.6.3 Canada Ethylene n Butyl Acrylate Copolymer (EnBA) Sales Value Share by Application, 2025 VS 2032
- 7.7 Mexico
- 7.6.1 Mexico Ethylene n Butyl Acrylate Copolymer (EnBA) Sales Value Growth Rate (2021-2032)
- 7.6.2 Mexico Ethylene n Butyl Acrylate Copolymer (EnBA) Sales Value Share by Type, 2025 VS 2032
- 7.6.3 Mexico Ethylene n Butyl Acrylate Copolymer (EnBA) Sales Value Share by Application, 2025 VS 2032
- 7.8 Germany
- 7.8.1 Germany Ethylene n Butyl Acrylate Copolymer (EnBA) Sales Value Growth Rate (2021-2032)
- 7.8.2 Germany Ethylene n Butyl Acrylate Copolymer (EnBA) Sales Value Share by Type, 2025 VS 2032
- 7.8.3 Germany Ethylene n Butyl Acrylate Copolymer (EnBA) Sales Value Share by Application, 2025 VS 2032
- 7.9 France
- 7.9.1 France Ethylene n Butyl Acrylate Copolymer (EnBA) Sales Value Growth Rate (2021-2032)
- 7.9.2 France Ethylene n Butyl Acrylate Copolymer (EnBA) Sales Value Share by Type, 2025 VS 2032
- 7.9.3 France Ethylene n Butyl Acrylate Copolymer (EnBA) Sales Value Share by Application, 2025 VS 2032
- 7.10 U.K.
- 7.10.1 U.K. Ethylene n Butyl Acrylate Copolymer (EnBA) Sales Value Growth Rate (2021-2032)
- 7.10.2 U.K. Ethylene n Butyl Acrylate Copolymer (EnBA) Sales Value Share by Type, 2025 VS 2032
- 7.10.3 U.K. Ethylene n Butyl Acrylate Copolymer (EnBA) Sales Value Share by Application, 2025 VS 2032
- 7.11 Italy
- 7.11.1 Italy Ethylene n Butyl Acrylate Copolymer (EnBA) Sales Value Growth Rate (2021-2032)
- 7.11.2 Italy Ethylene n Butyl Acrylate Copolymer (EnBA) Sales Value Share by Type, 2025 VS 2032
- 7.11.3 Italy Ethylene n Butyl Acrylate Copolymer (EnBA) Sales Value Share by Application, 2025 VS 2032
- 7.12 Spain
- 7.12.1 Spain Ethylene n Butyl Acrylate Copolymer (EnBA) Sales Value Growth Rate (2021-2032)
- 7.12.2 Spain Ethylene n Butyl Acrylate Copolymer (EnBA) Sales Value Share by Type, 2025 VS 2032
- 7.12.3 Spain Ethylene n Butyl Acrylate Copolymer (EnBA) Sales Value Share by Application, 2025 VS 2032
- 7.13 Russia
- 7.13.1 Russia Ethylene n Butyl Acrylate Copolymer (EnBA) Sales Value Growth Rate (2021-2032)
- 7.13.2 Russia Ethylene n Butyl Acrylate Copolymer (EnBA) Sales Value Share by Type, 2025 VS 2032
- 7.13.3 Russia Ethylene n Butyl Acrylate Copolymer (EnBA) Sales Value Share by Application, 2025 VS 2032
- 7.14 Netherlands
- 7.14.1 Netherlands Ethylene n Butyl Acrylate Copolymer (EnBA) Sales Value Growth Rate (2021-2032)
- 7.14.2 Netherlands Ethylene n Butyl Acrylate Copolymer (EnBA) Sales Value Share by Type, 2025 VS 2032
- 7.14.3 Netherlands Ethylene n Butyl Acrylate Copolymer (EnBA) Sales Value Share by Application, 2025 VS 2032
- 7.15 Nordic Countries
- 7.15.1 Nordic Countries Ethylene n Butyl Acrylate Copolymer (EnBA) Sales Value Growth Rate (2021-2032)
- 7.15.2 Nordic Countries Ethylene n Butyl Acrylate Copolymer (EnBA) Sales Value Share by Type, 2025 VS 2032
- 7.15.3 Nordic Countries Ethylene n Butyl Acrylate Copolymer (EnBA) Sales Value Share by Application, 2025 VS 2032
- 7.16 China
- 7.16.1 China Ethylene n Butyl Acrylate Copolymer (EnBA) Sales Value Growth Rate (2021-2032)
- 7.16.2 China Ethylene n Butyl Acrylate Copolymer (EnBA) Sales Value Share by Type, 2025 VS 2032
- 7.16.3 China Ethylene n Butyl Acrylate Copolymer (EnBA) Sales Value Share by Application, 2025 VS 2032
- 7.17 Japan
- 7.17.1 Japan Ethylene n Butyl Acrylate Copolymer (EnBA) Sales Value Growth Rate (2021-2032)
- 7.17.2 Japan Ethylene n Butyl Acrylate Copolymer (EnBA) Sales Value Share by Type, 2025 VS 2032
- 7.17.3 Japan Ethylene n Butyl Acrylate Copolymer (EnBA) Sales Value Share by Application, 2025 VS 2032
- 7.18 South Korea
- 7.18.1 South Korea Ethylene n Butyl Acrylate Copolymer (EnBA) Sales Value Growth Rate (2021-2032)
- 7.18.2 South Korea Ethylene n Butyl Acrylate Copolymer (EnBA) Sales Value Share by Type, 2025 VS 2032
- 7.18.3 South Korea Ethylene n Butyl Acrylate Copolymer (EnBA) Sales Value Share by Application, 2025 VS 2032
- 7.19 India
- 7.19.1 India Ethylene n Butyl Acrylate Copolymer (EnBA) Sales Value Growth Rate (2021-2032)
- 7.19.2 India Ethylene n Butyl Acrylate Copolymer (EnBA) Sales Value Share by Type, 2025 VS 2032
- 7.19.3 India Ethylene n Butyl Acrylate Copolymer (EnBA) Sales Value Share by Application, 2025 VS 2032
- 7.20 Australia
- 7.20.1 Australia Ethylene n Butyl Acrylate Copolymer (EnBA) Sales Value Growth Rate (2021-2032)
- 7.20.2 Australia Ethylene n Butyl Acrylate Copolymer (EnBA) Sales Value Share by Type, 2025 VS 2032
- 7.20.3 Australia Ethylene n Butyl Acrylate Copolymer (EnBA) Sales Value Share by Application, 2025 VS 2032
- 7.21 Southeast Asia
- 7.21.1 Southeast Asia Ethylene n Butyl Acrylate Copolymer (EnBA) Sales Value Growth Rate (2021-2032)
- 7.21.2 Southeast Asia Ethylene n Butyl Acrylate Copolymer (EnBA) Sales Value Share by Type, 2025 VS 2032
- 7.21.3 Southeast Asia Ethylene n Butyl Acrylate Copolymer (EnBA) Sales Value Share by Application, 2025 VS 2032
- 7.22 Brazil
- 7.22.1 Brazil Ethylene n Butyl Acrylate Copolymer (EnBA) Sales Value Growth Rate (2021-2032)
- 7.22.2 Brazil Ethylene n Butyl Acrylate Copolymer (EnBA) Sales Value Share by Type, 2025 VS 2032
- 7.22.3 Brazil Ethylene n Butyl Acrylate Copolymer (EnBA) Sales Value Share by Application, 2025 VS 2032
- 7.23 Argentina
- 7.23.1 Argentina Ethylene n Butyl Acrylate Copolymer (EnBA) Sales Value Growth Rate (2021-2032)
- 7.23.2 Argentina Ethylene n Butyl Acrylate Copolymer (EnBA) Sales Value Share by Type, 2025 VS 2032
- 7.23.3 Argentina Ethylene n Butyl Acrylate Copolymer (EnBA) Sales Value Share by Application, 2025 VS 2032
- 7.24 Chile
- 7.24.1 Chile Ethylene n Butyl Acrylate Copolymer (EnBA) Sales Value Growth Rate (2021-2032)
- 7.24.2 Chile Ethylene n Butyl Acrylate Copolymer (EnBA) Sales Value Share by Type, 2025 VS 2032
- 7.24.3 Chile Ethylene n Butyl Acrylate Copolymer (EnBA) Sales Value Share by Application, 2025 VS 2032
- 7.25 Colombia
- 7.25.1 Colombia Ethylene n Butyl Acrylate Copolymer (EnBA) Sales Value Growth Rate (2021-2032)
- 7.25.2 Colombia Ethylene n Butyl Acrylate Copolymer (EnBA) Sales Value Share by Type, 2025 VS 2032
- 7.25.3 Colombia Ethylene n Butyl Acrylate Copolymer (EnBA) Sales Value Share by Application, 2025 VS 2032
- 7.26 Peru
- 7.26.1 Peru Ethylene n Butyl Acrylate Copolymer (EnBA) Sales Value Growth Rate (2021-2032)
- 7.26.2 Peru Ethylene n Butyl Acrylate Copolymer (EnBA) Sales Value Share by Type, 2025 VS 2032
- 7.26.3 Peru Ethylene n Butyl Acrylate Copolymer (EnBA) Sales Value Share by Application, 2025 VS 2032
- 7.27 Saudi Arabia
- 7.27.1 Saudi Arabia Ethylene n Butyl Acrylate Copolymer (EnBA) Sales Value Growth Rate (2021-2032)
- 7.27.2 Saudi Arabia Ethylene n Butyl Acrylate Copolymer (EnBA) Sales Value Share by Type, 2025 VS 2032
- 7.27.3 Saudi Arabia Ethylene n Butyl Acrylate Copolymer (EnBA) Sales Value Share by Application, 2025 VS 2032
- 7.28 Israel
- 7.28.1 Israel Ethylene n Butyl Acrylate Copolymer (EnBA) Sales Value Growth Rate (2021-2032)
- 7.28.2 Israel Ethylene n Butyl Acrylate Copolymer (EnBA) Sales Value Share by Type, 2025 VS 2032
- 7.28.3 Israel Ethylene n Butyl Acrylate Copolymer (EnBA) Sales Value Share by Application, 2025 VS 2032
- 7.29 UAE
- 7.29.1 UAE Ethylene n Butyl Acrylate Copolymer (EnBA) Sales Value Growth Rate (2021-2032)
- 7.29.2 UAE Ethylene n Butyl Acrylate Copolymer (EnBA) Sales Value Share by Type, 2025 VS 2032
- 7.29.3 UAE Ethylene n Butyl Acrylate Copolymer (EnBA) Sales Value Share by Application, 2025 VS 2032
- 7.30 Turkey
- 7.30.1 Turkey Ethylene n Butyl Acrylate Copolymer (EnBA) Sales Value Growth Rate (2021-2032)
- 7.30.2 Turkey Ethylene n Butyl Acrylate Copolymer (EnBA) Sales Value Share by Type, 2025 VS 2032
- 7.30.3 Turkey Ethylene n Butyl Acrylate Copolymer (EnBA) Sales Value Share by Application, 2025 VS 2032
- 7.31 Iran
- 7.31.1 Iran Ethylene n Butyl Acrylate Copolymer (EnBA) Sales Value Growth Rate (2021-2032)
- 7.31.2 Iran Ethylene n Butyl Acrylate Copolymer (EnBA) Sales Value Share by Type, 2025 VS 2032
- 7.31.3 Iran Ethylene n Butyl Acrylate Copolymer (EnBA) Sales Value Share by Application, 2025 VS 2032
- 7.32 Egypt
- 7.32.1 Egypt Ethylene n Butyl Acrylate Copolymer (EnBA) Sales Value Growth Rate (2021-2032)
- 7.32.2 Egypt Ethylene n Butyl Acrylate Copolymer (EnBA) Sales Value Share by Type, 2025 VS 2032
- 7.32.3 Egypt Ethylene n Butyl Acrylate Copolymer (EnBA) Sales Value Share by Application, 2025 VS 2032
8 Company Profiles
- 8.1 Dow Inc.
- 8.1.1 Dow Inc. Company Information
- 8.1.2 Dow Inc. Business Overview
- 8.1.3 Dow Inc. Ethylene n Butyl Acrylate Copolymer (EnBA) Sales, Value and Gross Margin (2021-2026)
- 8.1.4 Dow Inc. Ethylene n Butyl Acrylate Copolymer (EnBA) Product Portfolio
- 8.1.5 Dow Inc. Recent Developments
- 8.2 SK Functional Polymer
- 8.2.1 SK Functional Polymer Company Information
- 8.2.2 SK Functional Polymer Business Overview
- 8.2.3 SK Functional Polymer Ethylene n Butyl Acrylate Copolymer (EnBA) Sales, Value and Gross Margin (2021-2026)
- 8.2.4 SK Functional Polymer Ethylene n Butyl Acrylate Copolymer (EnBA) Product Portfolio
- 8.2.5 SK Functional Polymer Recent Developments
- 8.3 ExxonMobil
- 8.3.1 ExxonMobil Company Information
- 8.3.2 ExxonMobil Business Overview
- 8.3.3 ExxonMobil Ethylene n Butyl Acrylate Copolymer (EnBA) Sales, Value and Gross Margin (2021-2026)
- 8.3.4 ExxonMobil Ethylene n Butyl Acrylate Copolymer (EnBA) Product Portfolio
- 8.3.5 ExxonMobil Recent Developments
- 8.4 Repsol
- 8.4.1 Repsol Company Information
- 8.4.2 Repsol Business Overview
- 8.4.3 Repsol Ethylene n Butyl Acrylate Copolymer (EnBA) Sales, Value and Gross Margin (2021-2026)
- 8.4.4 Repsol Ethylene n Butyl Acrylate Copolymer (EnBA) Product Portfolio
- 8.4.5 Repsol Recent Developments
- 8.5 Borealis
- 8.5.1 Borealis Company Information
- 8.5.2 Borealis Business Overview
- 8.5.3 Borealis Ethylene n Butyl Acrylate Copolymer (EnBA) Sales, Value and Gross Margin (2021-2026)
- 8.5.4 Borealis Ethylene n Butyl Acrylate Copolymer (EnBA) Product Portfolio
- 8.5.5 Borealis Recent Developments
- 8.6 Hanwha Solutions
- 8.6.1 Hanwha Solutions Company Information
- 8.6.2 Hanwha Solutions Business Overview
- 8.6.3 Hanwha Solutions Ethylene n Butyl Acrylate Copolymer (EnBA) Sales, Value and Gross Margin (2021-2026)
- 8.6.4 Hanwha Solutions Ethylene n Butyl Acrylate Copolymer (EnBA) Product Portfolio
- 8.6.5 Hanwha Solutions Recent Developments
- 8.7 LUCOBIT
- 8.7.1 LUCOBIT Company Information
- 8.7.2 LUCOBIT Business Overview
- 8.7.3 LUCOBIT Ethylene n Butyl Acrylate Copolymer (EnBA) Sales, Value and Gross Margin (2021-2026)
- 8.7.4 LUCOBIT Ethylene n Butyl Acrylate Copolymer (EnBA) Product Portfolio
- 8.7.5 LUCOBIT Recent Developments
- 8.8 LyondellBasell
- 8.8.1 LyondellBasell Company Information
- 8.8.2 LyondellBasell Business Overview
- 8.8.3 LyondellBasell Ethylene n Butyl Acrylate Copolymer (EnBA) Sales, Value and Gross Margin (2021-2026)
- 8.8.4 LyondellBasell Ethylene n Butyl Acrylate Copolymer (EnBA) Product Portfolio
- 8.8.5 LyondellBasell Recent Developments
- 8.9 Westlake
- 8.9.1 Westlake Company Information
- 8.9.2 Westlake Business Overview
- 8.9.3 Westlake Ethylene n Butyl Acrylate Copolymer (EnBA) Sales, Value and Gross Margin (2021-2026)
- 8.9.4 Westlake Ethylene n Butyl Acrylate Copolymer (EnBA) Product Portfolio
- 8.9.5 Westlake Recent Developments
- 8.10 INEOS
- 8.10.1 INEOS Company Information
- 8.10.2 INEOS Business Overview
- 8.10.3 INEOS Ethylene n Butyl Acrylate Copolymer (EnBA) Sales, Value and Gross Margin (2021-2026)
- 8.10.4 INEOS Ethylene n Butyl Acrylate Copolymer (EnBA) Product Portfolio
- 8.10.5 INEOS Recent Developments
9 Value Chain and Sales Channels Analysis
- 9.1 Ethylene n Butyl Acrylate Copolymer (EnBA) Value Chain Analysis
- 9.1.1 Ethylene n Butyl Acrylate Copolymer (EnBA) Key Raw Materials
- 9.1.2 Raw Materials Key Suppliers
- 9.1.3 Manufacturing Cost Structure
- 9.1.4 Ethylene n Butyl Acrylate Copolymer (EnBA) Sales Mode & Process
- 9.2 Ethylene n Butyl Acrylate Copolymer (EnBA) Sales Channels Analysis
- 9.2.1 Direct Comparison with Distribution Share
- 9.2.2 Ethylene n Butyl Acrylate Copolymer (EnBA) Distributors
- 9.2.3 Ethylene n Butyl Acrylate Copolymer (EnBA) Customers
10 Concluding Insights
11 Appendix
- 11.1 Reasons for Doing This Study
- 11.2 Research Methodology
- 11.3 Research Process
- 11.4 Authors List of This Report
- 11.5 Data Source
- 11.5.1 Secondary Sources
- 11.5.2 Primary Sources
GET THE RESEARCH
Choose your license.
Choose who needs access.
All options are for this report and research series.
PDF by email within 3–5 working days after payment confirmation.
Talk to an analyst