APO RESEARCH · REPORT
Diesel Engines
A diesel engine is an internal combustion engine whose working principle was completed by the German engineer Rudolf Diesel in 1892. An internal combustion engine is a heat engine that generates power by burning a fuel and an oxidizer.
Product & engineering
Understand the product.
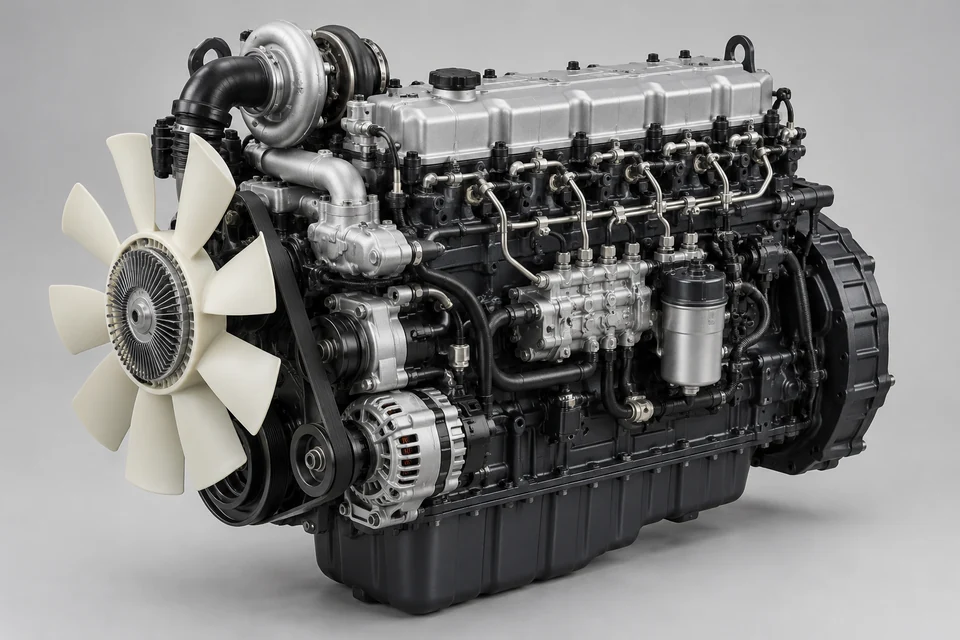
A diesel engine is an internal combustion engine whose working principle was completed by the German engineer Rudolf Diesel in 1892. An internal combustion engine is a heat engine that generates power by burning a fuel and an oxidizer. The working principle of a diesel engine is to compress air with a piston to increase the temperature inside the cylinder, and then inject atomized diesel into the cylinder. When the fuel comes into contact with the high temperature, it ignites, producing energy that pushes the piston downwards, transferring energy to the crankshaft and the power transmission system. This process repeats at high speed, making the diesel engine a powerful technology. Different types of diesel engines have different compression ratios. The compression ratio of a diesel engine affects the power output of the engine. The higher the compression ratio, the greater the power produced.
Components and Functions of a Diesel Engine:
Cylinder Block: As the foundation of a modern diesel engine, the cylinder block houses all components of the basic internal combustion process. It provides open spaces for each cylinder where combustion occurs.
Piston: The piston forms the bottom of the combustion chamber and moves up and down inside the cylinder during engine operation. The movement of the piston compresses the air, leading to combustion.
Cylinder Head: The cylinder head closes off the open space at the top of the cylinder block to reach the combustion chamber. The cylinder head can be a single unit covering all cylinders or multiple units covering sections.
Valves: Since the cylinder is closed off by the piston at the bottom and the cylinder head at the top, there needs to be a way for fresh air to enter and exhaust gases to exit. This is the role of the valves. Each cylinder typically has two intake valves and two exhaust valves.
Fuel Injectors: There needs to be a way to deliver fuel into the cylinder for combustion. These components are the complex part of the process, injecting fuel in a very precise pattern and highly controllable timing.
Camshaft: Most engines do not rely on electrical systems to open valves and inject fuel but instead use a mechanical process. The rotation of the camshaft controls the timing of these events through lobes on the shaft that cause the camshaft to move.
Connecting Rods: These parts connect to the piston head at the wrist pin and transfer the force of combustion to the crankshaft.
Crankshaft: The crankshaft converts the linear motion of combustion (the up-and-down parts of the process) into rotational motion.
Diesel engines can be classified in various ways. Typically, they are divided into single-cylinder and multi-cylinder diesel engines based on the number of cylinders. A single-cylinder diesel engine has only one cylinder for compressing air, injecting fuel, and burning to generate power. The single-cylinder structure is simple, cost-effective, and compact, applicable to small tractors, water pumps, lawn mowers, tillers, and small generators. Multi-cylinder diesel engines have two or more cylinders, with numbers ranging from 2, 3, 4, 6, 8, 12, or even more. Multi-cylinder engines have high power, smooth operation, high efficiency, complex structure, and high cost, used in vehicles, large generators, compressors, ships, excavators, bulldozers, and other applications.
Other classifications can be made based on the size of output power (small, medium, and large), or the number of strokes required for the engine cycle (two-stroke and four-stroke engines).
This report analyzes from the perspectives of single-cylinder and multi-cylinder engines.
Equipment converts a defined input into a required mechanical or process result. Usable capacity depends on duty, auxiliaries, control, loading and maintenance, rather than an isolated maximum nameplate value.
What turns activity into demand
Production or operating duty leads to purchases when capacity, qualification and replacement requirements match the supplied machine or component. Site output alone does not determine equipment orders without the installed capacity and duty.
The commercial boundary
For Diesel Engines, distinguish the supplied product from its inputs and the complete application. Report types and applications may overlap; retain the selected edition's product definition, geography, period, unit and transaction basis when comparing estimates.
Which conditions determine usable diesel engines performance?
A diesel engine is an internal combustion engine whose working principle was completed by the German engineer Rudolf Diesel in 1892. An internal combustion engine is a heat engine that generates power by burning a fuel and an oxidizer. Compare the complete supplied assembly under the same operating conditions, including upstream and downstream interfaces, energy use and service requirements. Separate machine hardware, installed process line and maintenance revenue when defining the research boundary.
Selected research
Market Analysis & Forecast
Global Diesel Engines Market Analysis and Forecast 2026-2032
Market perspective
A diesel engine is an internal combustion engine whose working principle was completed by the German engineer Rudolf Diesel in 1892. An internal combustion engine is a heat engine that generates power by burning a fuel and an oxidizer. The working principle of a diesel engine is to compress air with a piston to increase the temperature inside the cylinder, and then inject atomized diesel into the cylinder. When the fuel comes into contact with the high temperature, it ignites, producing energy that pushes the piston downwards, transferring energy to the crankshaft and the power transmission system. This process repeats at high speed, making the diesel engine a powerful technology. Different types of diesel engines have different compression ratios. The compression ratio of a diesel engine affects the power output of the engine. The higher the compression ratio, the greater the power produced.
Components and Functions of a Diesel Engine:
Cylinder Block: As the foundation of a modern diesel engine, the cylinder block houses all components of the basic internal combustion process. It provides open spaces for each cylinder where combustion occurs.
Read the full market overview
Piston: The piston forms the bottom of the combustion chamber and moves up and down inside the cylinder during engine operation. The movement of the piston compresses the air, leading to combustion.
Cylinder Head: The cylinder head closes off the open space at the top of the cylinder block to reach the combustion chamber. The cylinder head can be a single unit covering all cylinders or multiple units covering sections.
Valves: Since the cylinder is closed off by the piston at the bottom and the cylinder head at the top, there needs to be a way for fresh air to enter and exhaust gases to exit. This is the role of the valves. Each cylinder typically has two intake valves and two exhaust valves.
Fuel Injectors: There needs to be a way to deliver fuel into the cylinder for combustion. These components are the complex part of the process, injecting fuel in a very precise pattern and highly controllable timing.
Camshaft: Most engines do not rely on electrical systems to open valves and inject fuel but instead use a mechanical process. The rotation of the camshaft controls the timing of these events through lobes on the shaft that cause the camshaft to move.
Connecting Rods: These parts connect to the piston head at the wrist pin and transfer the force of combustion to the crankshaft.
Crankshaft: The crankshaft converts the linear motion of combustion (the up-and-down parts of the process) into rotational motion.
Diesel engines can be classified in various ways. Typically, they are divided into single-cylinder and multi-cylinder diesel engines based on the number of cylinders. A single-cylinder diesel engine has only one cylinder for compressing air, injecting fuel, and burning to generate power. The single-cylinder structure is simple, cost-effective, and compact, applicable to small tractors, water pumps, lawn mowers, tillers, and small generators. Multi-cylinder diesel engines have two or more cylinders, with numbers ranging from 2, 3, 4, 6, 8, 12, or even more. Multi-cylinder engines have high power, smooth operation, high efficiency, complex structure, and high cost, used in vehicles, large generators, compressors, ships, excavators, bulldozers, and other applications.
Other classifications can be made based on the size of output power (small, medium, and large), or the number of strokes required for the engine cycle (two-stroke and four-stroke engines).
This report analyzes from the perspectives of single-cylinder and multi-cylinder engines.
The global Diesel Engines market is projected to grow from US$ million in 2026 to US$ million by 2032, at a Compound Annual Growth Rate (CAGR) of % during the forecast period.
Diesel Engines's global sales reached XX (K Units) with a value of US$ XX Million, marking an change of XX% compared to the previous year. This performance has positioned Cummins as the global sales leader, a title it has maintained for several consecutive years. Notably, Cummins's performance in primary markets is also remarkable. In the Chinese market, sales were XX (K Units), a change of XX% from the previous year. In Europe, sales were XX (K Units), showing a year-on-year of XX%. In the US, sales were XX (K Units), a year-on-year change of XX%.
The major global manufacturers in the Diesel Engines market include Cummins, Weichai Power, Caterpiller, Kubota, Yuchai, Yanmar, Deutz, Volvo Penta and MHI, etc. In 2025, the top three vendors accounted for approximately % of the revenue.
In terms of production side, this report researches the Diesel Engines production, growth rate, market share by manufacturers and by region (region level and country level), from 2021 to 2026, and forecast to 2032.
In terms of consumption side, this report focuses on the sales of Diesel Engines by region (region level and country level), by Company, by Type and by Application. from 2021 to 2026 and forecast to 2032.
This report presents an overview of global market for Diesel Engines, capacity, output, revenue and price. Analyses of the global market trends, with historic market revenue or sales data for 2021 - 2025, estimates for 2026, and projections of CAGR through 2032.
This report researches the key producers of Diesel Engines, also provides the consumption of main regions and countries. Of the upcoming market potential for Diesel Engines, and key regions or countries of focus to forecast this market into various segments and sub-segments. Country specific data and market value analysis for the U.S., Canada, Mexico, Brazil, China, Japan, South Korea, Southeast Asia, India, Germany, the U.K., Italy, Middle East, Africa, and Other Countries.
This report focuses on the Diesel Engines sales, revenue, market share and industry ranking of main manufacturers, data from 2021 to 2026. Identification of the major stakeholders in the global Diesel Engines market, and analysis of their competitive landscape and market positioning based on recent developments and segmental revenues. This report will help stakeholders to understand the competitive landscape and gain more insights and position their businesses and market strategies in a better way.
This report analyzes the segments data by Type and by Application, sales, revenue, and price, from 2021 to 2032. Evaluation and forecast the market size for Diesel Engines sales, projected growth trends, production technology, application and end-user industry.
Diesel Engines Segment by Company
Cummins
Weichai Power
Caterpiller
Kubota
Yuchai
Yanmar
Deutz
Volvo Penta
MHI
Quanchai
MAN SE
Yunnei Power
Foton Motor
DFAC
Scania
JMC
Zhejiang Xinchai
Kohler
FAW
Changchai
Hatz
Diesel Engines Segment by Type
Single Cylinder
Multi Cylinder
Diesel Engines Segment by Application
Automotive
Construction
Agriculture
Industrial
Marine
Power Generation
Other
Diesel Engines Segment by Region
North America
United States
Canada
Mexico
Europe
Germany
France
U.K.
Italy
Russia
Spain
Netherlands
Switzerland
Sweden
Poland
Asia-Pacific
China
Japan
South Korea
India
Australia
Taiwan
Southeast Asia
South America
Brazil
Argentina
Chile
Middle East & Africa
Egypt
South Africa
Israel
Türkiye
GCC Countries
Study Objectives
1. To analyze and research the global status and future forecast, involving, production, value, consumption, growth rate (CAGR), market share, historical and forecast.
2. To present the key manufacturers, capacity, production, revenue, market share, and Recent Developments.
3. To split the breakdown data by regions, type, manufacturers, and Application.
4. To analyze the global and key regions market potential and advantage, opportunity and challenge, restraints, and risks.
5. To identify significant trends, drivers, influence factors in global and regions.
6. To analyze competitive developments such as expansions, agreements, new product launches, and acquisitions in the market.
Reasons to Buy This Report
1. This report will help the readers to understand the competition within the industries and strategies for the competitive environment to enhance the potential profit. The report also focuses on the competitive landscape of the global Diesel Engines market, and introduces in detail the market share, industry ranking, competitor ecosystem, market performance, new product development, operation situation, expansion, and acquisition. etc. of the main players, which helps the readers to identify the main competitors and deeply understand the competition pattern of the market.
2. This report will help stakeholders to understand the global industry status and trends of Diesel Engines and provides them with information on key market drivers, restraints, challenges, and opportunities.
3. This report will help stakeholders to understand competitors better and gain more insights to strengthen their position in their businesses. The competitive landscape section includes the market share and rank (in volume and value), competitor ecosystem, new product development, expansion, and acquisition.
4. This report stays updated with novel technology integration, features, and the latest developments in the market.
5. This report helps stakeholders to gain insights into which regions to target globally.
6. This report helps stakeholders to gain insights into the end-user perception concerning the adoption of Diesel Engines.
7. This report helps stakeholders to identify some of the key players in the market and understand their valuable contribution.
Chapter Outline
Chapter 1: Introduces the report scope of the report, executive summary of different market segments (by type and by application, etc), including the market size of each market segment, future development potential, and so on. It offers a high-level view of the current state of the market and its likely evolution in the short to mid-term, and long term.
Chapter 2: Introduces the market dynamics, latest developments of the market, the driving factors and restrictive factors of the market, the challenges and risks faced by manufacturers in the industry, and the analysis of relevant policies in the industry.
Chapter 3: Diesel Engines production/output of global and key producers (regions/countries). It provides a quantitative analysis of the production, and development potential of each producer in the next six years.
Chapter 4: Sales (consumption), revenue of Diesel Engines in global, regional level and country level. It provides a quantitative analysis of the market size and development potential of each region and its main countries and introduces the market development, future development prospects, market space of each country in the world.
Chapter 5: Detailed analysis of Diesel Engines manufacturers competitive landscape, price, sales, revenue, market share and industry ranking, latest development plan, merger, and acquisition information, etc.
Chapter 6: Provides the analysis of various market segments by type, covering the sales, revenue, average price, and development potential of each market segment, to help readers find the blue ocean market in different market segments.
Chapter 7: Provides the analysis of various market segments by application, covering the sales, revenue, average price, and development potential of each market segment, to help readers find the blue ocean market in different downstream markets.
Chapter 8: Provides profiles of key manufacturers, introducing the basic situation of the main companies in the market in detail, including product descriptions and specifications, Diesel Engines sales, revenue, price, gross margin, and recent development, etc.
Chapter 9: North America by type, by application and by country, sales, and revenue for each segment.
Chapter 10: Europe by type, by application and by country, sales, and revenue for each segment.
Chapter 11: China by type, by application, sales, and revenue for each segment.
Chapter 12: Asia (Excluding China) by type, by application and by region, sales, and revenue for each segment.
Chapter 13: South America, Middle East and Africa by type, by application and by country, sales, and revenue for each segment.
Chapter 14: Analysis of industrial chain, sales channel, key raw materials, distributors and customers.
Chapter 15: The main concluding insights of the report.
More report detail
Tables and figures
Scope & coverage.
Types
- Single Cylinder
- Multi Cylinder
Applications
- Automotive
- Construction
- Agriculture
- Industrial
- Marine
- Power Generation
- Other
Companies covered
- Cummins
- Weichai Power
- Caterpiller
- Kubota
- Yuchai
- Yanmar
- Deutz
- Volvo Penta
- MHI
- Quanchai
- MAN SE
- Yunnei Power
- Foton Motor
- DFAC
- Scania
- JMC
- Zhejiang Xinchai
- Kohler
- FAW
- Changchai
- Hatz
Inside the report.
1 Market Overview
- 1.1 Product Definition
- 1.2 Diesel Engines Market by Type
- 1.2.1 Global Diesel Engines Market Size by Type, 2021 VS 2025 VS 2032
- 1.2.2 Single Cylinder
- 1.2.3 Multi Cylinder
- 1.3 Diesel Engines Market by Application
- 1.3.1 Global Diesel Engines Market Size by Application, 2021 VS 2025 VS 2032
- 1.3.2 Automotive
- 1.3.3 Construction
- 1.3.4 Agriculture
- 1.3.5 Industrial
- 1.3.6 Marine
- 1.3.7 Power Generation
- 1.3.8 Other
- 1.4 Assumptions and Limitations
- 1.5 Study Goals and Objectives
2 Diesel Engines Market Dynamics
- 2.1 Diesel Engines Industry Trends
- 2.2 Diesel Engines Industry Drivers
- 2.3 Diesel Engines Industry Opportunities and Challenges
- 2.4 Diesel Engines Industry Restraints
3 Global Diesel Engines Production Overview
- 3.1 Global Diesel Engines Production Capacity (2021-2032)
- 3.2 Global Diesel Engines Production by Region: 2021 VS 2025 VS 2032
- 3.3 Global Diesel Engines Production by Region
- 3.3.1 Global Diesel Engines Production by Region (2021-2026)
- 3.3.2 Global Diesel Engines Production by Region (2027-2032)
- 3.3.3 Global Diesel Engines Production Market Share by Region (2021-2032)
- 3.4 North America
- 3.5 Europe
- 3.6 China
- 3.7 Japan
4 Global Market Growth Prospects
- 4.1 Global Diesel Engines Revenue Estimates and Forecasts (2021-2032)
- 4.2 Global Diesel Engines Revenue by Region
- 4.2.1 Global Diesel Engines Revenue by Region: 2021 VS 2025 VS 2032
- 4.2.2 Global Diesel Engines Revenue by Region (2021-2026)
- 4.2.3 Global Diesel Engines Revenue by Region (2027-2032)
- 4.2.4 Global Diesel Engines Revenue Market Share by Region (2021-2032)
- 4.3 Global Diesel Engines Sales Estimates and Forecasts 2021-2032
- 4.4 Global Diesel Engines Sales by Region
- 4.4.1 Global Diesel Engines Sales by Region: 2021 VS 2025 VS 2032
- 4.4.2 Global Diesel Engines Sales by Region (2021-2026)
- 4.4.3 Global Diesel Engines Sales by Region (2027-2032)
- 4.4.4 Global Diesel Engines Sales Market Share by Region (2021-2032)
- 4.5 North America
- 4.6 Europe
- 4.7 China
- 4.8 Asia (Excluding China)
- 4.9 South America, Middle East and Africa
5 Market Competitive Landscape by Manufacturers
- 5.1 Global Diesel Engines Revenue by Manufacturers
- 5.1.1 Global Diesel Engines Revenue by Manufacturers (2021-2026)
- 5.1.2 Global Diesel Engines Revenue Market Share by Manufacturers (2021-2026)
- 5.1.3 Global Diesel Engines Manufacturers Revenue Share Top 10 and Top 5 in 2025
- 5.2 Global Diesel Engines Sales by Manufacturers
- 5.2.1 Global Diesel Engines Sales by Manufacturers (2021-2026)
- 5.2.2 Global Diesel Engines Sales Market Share by Manufacturers (2021-2026)
- 5.2.3 Global Diesel Engines Manufacturers Sales Share Top 10 and Top 5 in 2025
- 5.3 Global Diesel Engines Sales Price by Manufacturers (2021-2026)
- 5.4 Global Diesel Engines Key Manufacturers Ranking, 2024 VS 2025 VS 2026
- 5.5 Global Diesel Engines Key Manufacturers Manufacturing Sites & Headquarters
- 5.6 Global Diesel Engines Manufacturers, Product Type & Application
- 5.7 Global Diesel Engines Manufacturers Commercialization Time
- 5.8 Market Competitive Analysis
- 5.8.1 Global Diesel Engines Market CR5 and HHI
- 5.8.2 2025 Diesel Engines Tier 1, Tier 2, and Tier 3
6 Diesel Engines Market by Type
- 6.1 Global Diesel Engines Revenue by Type
- 6.1.1 Global Diesel Engines Revenue by Type (2021-2032) & (US$ Million)
- 6.1.2 Global Diesel Engines Revenue Market Share by Type (2021-2032)
- 6.2 Global Diesel Engines Sales by Type
- 6.2.1 Global Diesel Engines Sales by Type (2021-2032) & (K Units)
- 6.2.2 Global Diesel Engines Sales Market Share by Type (2021-2032)
- 6.3 Global Diesel Engines Price by Type
7 Diesel Engines Market by Application
- 7.1 Global Diesel Engines Revenue by Application
- 7.1.1 Global Diesel Engines Revenue by Application (2021-2032) & (US$ Million)
- 7.1.2 Global Diesel Engines Revenue Market Share by Application (2021-2032)
- 7.2 Global Diesel Engines Sales by Application
- 7.2.1 Global Diesel Engines Sales by Application (2021-2032) & (K Units)
- 7.2.2 Global Diesel Engines Sales Market Share by Application (2021-2032)
- 7.3 Global Diesel Engines Price by Application
8 Company Profiles
- 8.1 Cummins
- 8.1.1 Cummins Company Information
- 8.1.2 Cummins Business Overview
- 8.1.3 Cummins Diesel Engines Sales, Revenue, Price and Gross Margin (2021-2026)
- 8.1.4 Cummins Diesel Engines Product Portfolio
- 8.1.5 Cummins Recent Developments
- 8.2 Weichai Power
- 8.2.1 Weichai Power Company Information
- 8.2.2 Weichai Power Business Overview
- 8.2.3 Weichai Power Diesel Engines Sales, Revenue, Price and Gross Margin (2021-2026)
- 8.2.4 Weichai Power Diesel Engines Product Portfolio
- 8.2.5 Weichai Power Recent Developments
- 8.3 Caterpiller
- 8.3.1 Caterpiller Company Information
- 8.3.2 Caterpiller Business Overview
- 8.3.3 Caterpiller Diesel Engines Sales, Revenue, Price and Gross Margin (2021-2026)
- 8.3.4 Caterpiller Diesel Engines Product Portfolio
- 8.3.5 Caterpiller Recent Developments
- 8.4 Kubota
- 8.4.1 Kubota Company Information
- 8.4.2 Kubota Business Overview
- 8.4.3 Kubota Diesel Engines Sales, Revenue, Price and Gross Margin (2021-2026)
- 8.4.4 Kubota Diesel Engines Product Portfolio
- 8.4.5 Kubota Recent Developments
- 8.5 Yuchai
- 8.5.1 Yuchai Company Information
- 8.5.2 Yuchai Business Overview
- 8.5.3 Yuchai Diesel Engines Sales, Revenue, Price and Gross Margin (2021-2026)
- 8.5.4 Yuchai Diesel Engines Product Portfolio
- 8.5.5 Yuchai Recent Developments
- 8.6 Yanmar
- 8.6.1 Yanmar Company Information
- 8.6.2 Yanmar Business Overview
- 8.6.3 Yanmar Diesel Engines Sales, Revenue, Price and Gross Margin (2021-2026)
- 8.6.4 Yanmar Diesel Engines Product Portfolio
- 8.6.5 Yanmar Recent Developments
- 8.7 Deutz
- 8.7.1 Deutz Company Information
- 8.7.2 Deutz Business Overview
- 8.7.3 Deutz Diesel Engines Sales, Revenue, Price and Gross Margin (2021-2026)
- 8.7.4 Deutz Diesel Engines Product Portfolio
- 8.7.5 Deutz Recent Developments
- 8.8 Volvo Penta
- 8.8.1 Volvo Penta Company Information
- 8.8.2 Volvo Penta Business Overview
- 8.8.3 Volvo Penta Diesel Engines Sales, Revenue, Price and Gross Margin (2021-2026)
- 8.8.4 Volvo Penta Diesel Engines Product Portfolio
- 8.8.5 Volvo Penta Recent Developments
- 8.9 MHI
- 8.9.1 MHI Company Information
- 8.9.2 MHI Business Overview
- 8.9.3 MHI Diesel Engines Sales, Revenue, Price and Gross Margin (2021-2026)
- 8.9.4 MHI Diesel Engines Product Portfolio
- 8.9.5 MHI Recent Developments
- 8.10 Quanchai
- 8.10.1 Quanchai Company Information
- 8.10.2 Quanchai Business Overview
- 8.10.3 Quanchai Diesel Engines Sales, Revenue, Price and Gross Margin (2021-2026)
- 8.10.4 Quanchai Diesel Engines Product Portfolio
- 8.10.5 Quanchai Recent Developments
- 8.11 MAN SE
- 8.11.1 MAN SE Company Information
- 8.11.2 MAN SE Business Overview
- 8.11.3 MAN SE Diesel Engines Sales, Revenue, Price and Gross Margin (2021-2026)
- 8.11.4 MAN SE Diesel Engines Product Portfolio
- 8.11.5 MAN SE Recent Developments
- 8.12 Yunnei Power
- 8.12.1 Yunnei Power Company Information
- 8.12.2 Yunnei Power Business Overview
- 8.12.3 Yunnei Power Diesel Engines Sales, Revenue, Price and Gross Margin (2021-2026)
- 8.12.4 Yunnei Power Diesel Engines Product Portfolio
- 8.12.5 Yunnei Power Recent Developments
- 8.13 Foton Motor
- 8.13.1 Foton Motor Company Information
- 8.13.2 Foton Motor Business Overview
- 8.13.3 Foton Motor Diesel Engines Sales, Revenue, Price and Gross Margin (2021-2026)
- 8.13.4 Foton Motor Diesel Engines Product Portfolio
- 8.13.5 Foton Motor Recent Developments
- 8.14 DFAC
- 8.14.1 DFAC Company Information
- 8.14.2 DFAC Business Overview
- 8.14.3 DFAC Diesel Engines Sales, Revenue, Price and Gross Margin (2021-2026)
- 8.14.4 DFAC Diesel Engines Product Portfolio
- 8.14.5 DFAC Recent Developments
- 8.15 Scania
- 8.15.1 Scania Company Information
- 8.15.2 Scania Business Overview
- 8.15.3 Scania Diesel Engines Sales, Revenue, Price and Gross Margin (2021-2026)
- 8.15.4 Scania Diesel Engines Product Portfolio
- 8.15.5 Scania Recent Developments
- 8.16 JMC
- 8.16.1 JMC Company Information
- 8.16.2 JMC Business Overview
- 8.16.3 JMC Diesel Engines Sales, Revenue, Price and Gross Margin (2021-2026)
- 8.16.4 JMC Diesel Engines Product Portfolio
- 8.16.5 JMC Recent Developments
- 8.17 Zhejiang Xinchai
- 8.17.1 Zhejiang Xinchai Company Information
- 8.17.2 Zhejiang Xinchai Business Overview
- 8.17.3 Zhejiang Xinchai Diesel Engines Sales, Revenue, Price and Gross Margin (2021-2026)
- 8.17.4 Zhejiang Xinchai Diesel Engines Product Portfolio
- 8.17.5 Zhejiang Xinchai Recent Developments
- 8.18 Kohler
- 8.18.1 Kohler Company Information
- 8.18.2 Kohler Business Overview
- 8.18.3 Kohler Diesel Engines Sales, Revenue, Price and Gross Margin (2021-2026)
- 8.18.4 Kohler Diesel Engines Product Portfolio
- 8.18.5 Kohler Recent Developments
- 8.19 FAW
- 8.19.1 FAW Company Information
- 8.19.2 FAW Business Overview
- 8.19.3 FAW Diesel Engines Sales, Revenue, Price and Gross Margin (2021-2026)
- 8.19.4 FAW Diesel Engines Product Portfolio
- 8.19.5 FAW Recent Developments
- 8.20 Changchai
- 8.20.1 Changchai Company Information
- 8.20.2 Changchai Business Overview
- 8.20.3 Changchai Diesel Engines Sales, Revenue, Price and Gross Margin (2021-2026)
- 8.20.4 Changchai Diesel Engines Product Portfolio
- 8.20.5 Changchai Recent Developments
- 8.21 Hatz
- 8.21.1 Hatz Company Information
- 8.21.2 Hatz Business Overview
- 8.21.3 Hatz Diesel Engines Sales, Revenue, Price and Gross Margin (2021-2026)
- 8.21.4 Hatz Diesel Engines Product Portfolio
- 8.21.5 Hatz Recent Developments
9 North America
- 9.1 North America Diesel Engines Market Size by Type
- 9.1.1 North America Diesel Engines Revenue by Type (2021-2032)
- 9.1.2 North America Diesel Engines Sales by Type (2021-2032)
- 9.1.3 North America Diesel Engines Price by Type (2021-2032)
- 9.2 North America Diesel Engines Market Size by Application
- 9.2.1 North America Diesel Engines Revenue by Application (2021-2032)
- 9.2.2 North America Diesel Engines Sales by Application (2021-2032)
- 9.2.3 North America Diesel Engines Price by Application (2021-2032)
- 9.3 North America Diesel Engines Market Size by Country
- 9.3.1 North America Diesel Engines Revenue Grow Rate by Country (2021 VS 2025 VS 2032)
- 9.3.2 North America Diesel Engines Sales by Country (2021 VS 2025 VS 2032)
- 9.3.3 North America Diesel Engines Price by Country (2021-2032)
- 9.3.4 United States
- 9.3.5 Canada
- 9.3.6 Mexico
10 Europe
- 10.1 Europe Diesel Engines Market Size by Type
- 10.1.1 Europe Diesel Engines Revenue by Type (2021-2032)
- 10.1.2 Europe Diesel Engines Sales by Type (2021-2032)
- 10.1.3 Europe Diesel Engines Price by Type (2021-2032)
- 10.2 Europe Diesel Engines Market Size by Application
- 10.2.1 Europe Diesel Engines Revenue by Application (2021-2032)
- 10.2.2 Europe Diesel Engines Sales by Application (2021-2032)
- 10.2.3 Europe Diesel Engines Price by Application (2021-2032)
- 10.3 Europe Diesel Engines Market Size by Country
- 10.3.1 Europe Diesel Engines Revenue Grow Rate by Country (2021 VS 2025 VS 2032)
- 10.3.2 Europe Diesel Engines Sales by Country (2021 VS 2025 VS 2032)
- 10.3.3 Europe Diesel Engines Price by Country (2021-2032)
- 10.3.4 Germany
- 10.3.5 France
- 10.3.6 U.K.
- 10.3.7 Italy
- 10.3.8 Russia
- 10.3.9 Spain
- 10.3.10 Netherlands
- 10.3.11 Switzerland
- 10.3.12 Sweden
11 China
- 11.1 China Diesel Engines Market Size by Type
- 11.1.1 China Diesel Engines Revenue by Type (2021-2032)
- 11.1.2 China Diesel Engines Sales by Type (2021-2032)
- 11.1.3 China Diesel Engines Price by Type (2021-2032)
- 11.2 China Diesel Engines Market Size by Application
- 11.2.1 China Diesel Engines Revenue by Application (2021-2032)
- 11.2.2 China Diesel Engines Sales by Application (2021-2032)
- 11.2.3 China Diesel Engines Price by Application (2021-2032)
12 Asia (Excluding China)
- 12.1 Asia Diesel Engines Market Size by Type
- 12.1.1 Asia Diesel Engines Revenue by Type (2021-2032)
- 12.1.2 Asia Diesel Engines Sales by Type (2021-2032)
- 12.1.3 Asia Diesel Engines Price by Type (2021-2032)
- 12.2 Asia Diesel Engines Market Size by Application
- 12.2.1 Asia Diesel Engines Revenue by Application (2021-2032)
- 12.2.2 Asia Diesel Engines Sales by Application (2021-2032)
- 12.2.3 Asia Diesel Engines Price by Application (2021-2032)
- 12.3 Asia Diesel Engines Market Size by Country
- 12.3.1 Asia Diesel Engines Revenue Grow Rate by Country (2021 VS 2025 VS 2032)
- 12.3.2 Asia Diesel Engines Sales by Country (2021 VS 2025 VS 2032)
- 12.3.3 Asia Diesel Engines Price by Country (2021-2032)
- 12.3.4 Japan
- 12.3.5 South Korea
- 12.3.6 India
- 12.3.7 Australia
- 12.3.8 Taiwan
- 12.3.9 Southeast Asia
13 South America, Middle East and Africa
- 13.1 SAMEA Diesel Engines Market Size by Type
- 13.1.1 SAMEA Diesel Engines Revenue by Type (2021-2032)
- 13.1.2 SAMEA Diesel Engines Sales by Type (2021-2032)
- 13.1.3 SAMEA Diesel Engines Price by Type (2021-2032)
- 13.2 SAMEA Diesel Engines Market Size by Application
- 13.2.1 SAMEA Diesel Engines Revenue by Application (2021-2032)
- 13.2.2 SAMEA Diesel Engines Sales by Application (2021-2032)
- 13.2.3 SAMEA Diesel Engines Price by Application (2021-2032)
- 13.3 SAMEA Diesel Engines Market Size by Country
- 13.3.1 SAMEA Diesel Engines Revenue Grow Rate by Country (2021 VS 2025 VS 2032)
- 13.3.2 SAMEA Diesel Engines Sales by Country (2021 VS 2025 VS 2032)
- 13.3.3 SAMEA Diesel Engines Price by Country (2021-2032)
- 13.3.4 Brazil
- 13.3.5 Argentina
- 13.3.6 Chile
- 13.3.7 Colombia
- 13.3.8 Peru
- 13.3.9 Saudi Arabia
- 13.3.10 Israel
- 13.3.11 UAE
- 13.3.12 Turkey
- 13.3.13 Iran
- 13.3.14 Egypt
14 Value Chain and Sales Channels Analysis
- 14.1 Diesel Engines Value Chain Analysis
- 14.1.1 Diesel Engines Key Raw Materials
- 14.1.2 Raw Materials Key Suppliers
- 14.1.3 Manufacturing Cost Structure
- 14.1.4 Diesel Engines Production Mode & Process
- 14.2 Diesel Engines Sales Channels Analysis
- 14.2.1 Direct Comparison with Distribution Share
- 14.2.2 Diesel Engines Distributors
- 14.2.3 Diesel Engines Customers
15 Concluding Insights
16 Appendix
- 16.1 Reasons for Doing This Study
- 16.2 Research Methodology
- 16.3 Research Process
- 16.4 Authors List of This Report
- 16.5 Data Source
- 16.5.1 Secondary Sources
- 16.5.2 Primary Sources
- 16.6 Disclaimer
GET THE RESEARCH
Choose your license.
Choose who needs access.
All options are for this report and research series.
PDF by email within 3–5 working days after payment confirmation.
Talk to an analyst