APO RESEARCH · REPORT
Nuclear Engineering Maintenance Service
Nuclear Engineering Maintenance Service comprises specialized engineering, inspection, testing, maintenance, repair, overhaul, replacement, modification and technical integrity activities performed on the structures, systems and components of operating nuclear facilities to preserve or restore their required safety functions, pressure boundary integrity, mechanical and electrical availability, configuration basis and licensed performance.
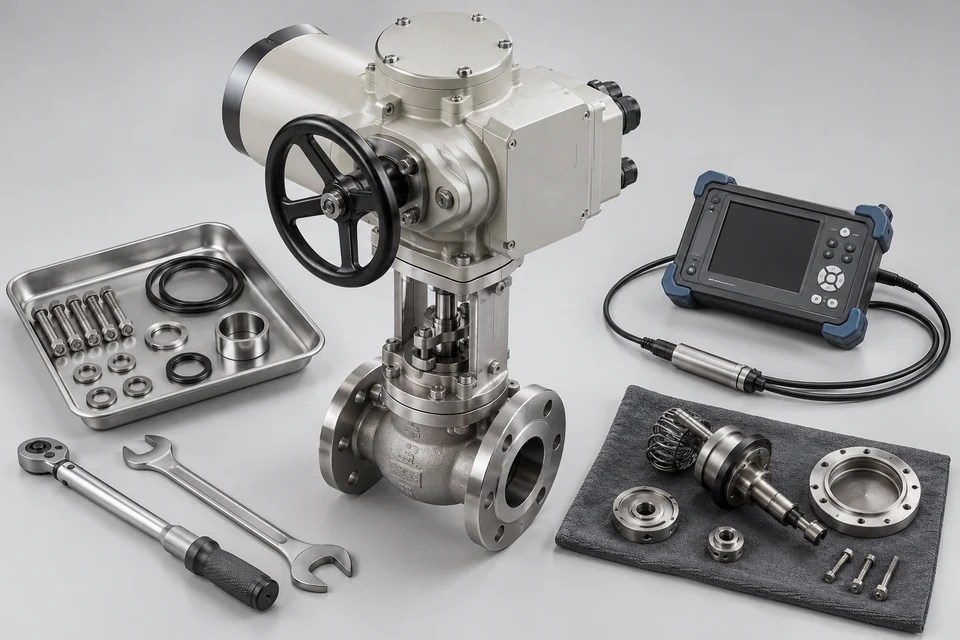
Product & engineering
Understand the product.
Nuclear Engineering Maintenance Service comprises specialized engineering, inspection, testing, maintenance, repair, overhaul, replacement, modification and technical integrity activities performed on the structures, systems and components of operating nuclear facilities to preserve or restore their required safety functions, pressure boundary integrity, mechanical and electrical availability, configuration basis and licensed performance. At first principles level, nuclear maintenance manages the physical degradation mechanisms that progressively alter nuclear plant assets, including corrosion, erosion, fatigue, irradiation effects, thermal ageing, wear, vibration, insulation deterioration, calibration drift, leakage, material embrittlement and component obsolescence. The engineering requirement is determined by the functional consequence of degradation within reactor shutdown, reactivity control, core cooling, decay heat removal, containment, radioactive material confinement, emergency electrical power and supporting plant systems. IAEA Safety Standards Series No. SSG 74 establishes maintenance, testing, surveillance and inspection as integrated activities required to maintain the reliability and availability of structures, systems and components important to safety and identifies preventive maintenance, including periodic, predictive and planned activities, together with corrective maintenance following equipment failure. In the United States, NRC 10 CFR 50.65 requires monitoring of maintenance effectiveness for safety related structures, systems and components and specified nonsafety related equipment whose failure could impair a safety function, initiate a reactor scram or cause unnecessary actuation of a safety related system.
The technical work content extends across the nuclear steam supply system, reactor coolant pressure boundary, reactor vessel internals, pumps, valves, piping, steam generators, heat exchangers, turbine generator systems, feedwater and condensate systems, emergency diesel generators, switchgear, transformers, electrical distribution, instrumentation and control systems, containment systems, fuel handling equipment and other safety significant or availability critical plant assets. Major engineering activities include preventive and corrective maintenance, condition monitoring, predictive diagnostics, in service inspection, nondestructive examination, pressure boundary examination, weld inspection, valve and actuator overhaul, rotating equipment maintenance, steam generator examination and tube work, reactor coolant pump maintenance, turbine generator inspection and overhaul, electrical equipment testing, instrumentation calibration, component replacement, equipment qualification, system modification, digital modernization and ageing management. Intrusive work is heavily scheduled into planned refueling outages because reactor shutdown provides access to systems and components that cannot normally be isolated or disassembled during power operation. United States nuclear units typically refuel every 18 to 24 months, primarily during spring and autumn periods of lower electricity demand, and operators use these outages for equipment upgrades, repairs, inspections and other maintenance work. The resulting outage cycle creates a recurrent concentration of engineering labor, specialist contractors, inspection personnel, component replacement activity and nuclear qualified materials around each reactor operating cycle.
Nuclear maintenance is governed by the interaction of material condition, equipment reliability, deterministic safety requirements, probabilistic risk significance, radiation exposure, configuration control and plant operating availability. Maintenance on equipment important to safety remains subject to the plant licensing basis and applicable nuclear quality assurance, technical specification, radiation protection, pressure boundary, seismic, electrical qualification and inspection requirements. Maintenance planning therefore incorporates equipment function, redundancy, train availability, common cause failure potential and temporary changes in plant risk associated with removing equipment from service. Ageing management becomes progressively more material during extended operation because degradation of structures, systems and components can alter safety margins and increase the probability of functional loss. The ageing effect is particularly important in mature fleets. The average age of the United States operating commercial reactor fleet was approximately 44 years as of March 2026. NRC subsequent license renewal extends eligible reactor operating periods from 60 years to 80 years and requires specific technical evaluation of ageing management programs for the extended operating period. By mid 2026, subsequent license renewals had been completed for multiple large reactor fleets and additional applications remained under regulatory review, extending the maintenance horizon of a substantial portion of the installed United States nuclear asset base into the 2040s, 2050s and 2060s.
The global installed nuclear asset base is large, capital intensive and geographically concentrated. IAEA PRIS reported 417 nuclear power reactors in operation with 379.70 GWe of total net installed capacity as of late July 2026. These reactors were distributed across 31 countries. A further 21 reactors representing 19.39 GWe were in suspended operation, principally in Japan and India, while 77 reactors representing 80.72 GWe were under construction across 17 countries. The operating fleet has accumulated more than 20,700 reactor years of operating experience. In 2025, reactors for which commercial operating data were available recorded a weighted global energy availability factor of 84.1 percent, and reactors reported in the PRIS electricity production dataset supplied approximately 2,633 TWh of nuclear electricity. The physical scale of this installed equipment base creates recurring inspection, outage maintenance, component refurbishment, ageing management, instrumentation modernization and major replacement requirements throughout reactor operating lives that commonly extend for several decades.
Global operating capacity is led by the United States with 94 reactors and 96.95 GWe, France with 57 reactors and 63.00 GWe, China with 60 reactors and 58.81 GWe, Russia with 34 reactors and 27.97 GWe, and the Republic of Korea with 26 reactors and 25.61 GWe. These five national fleets contain approximately 272.34 GWe, equivalent to about 71.7 percent of global operating nuclear capacity. Other material operating fleets include Canada with 17 reactors and 12.71 GWe, Ukraine with 15 reactors and 13.11 GWe, Japan with 14 operating reactors and 12.63 GWe, India with 23 reactors and 7.73 GWe, the United Kingdom with 9 reactors and 5.88 GWe, Spain with 7 reactors and 7.12 GWe, Sweden with 6 reactors and 7.01 GWe, Pakistan with 6 reactors and 3.26 GWe, and the Czech Republic with 6 reactors and 3.97 GWe. The United States alone accounts for approximately 22.5 percent of global operating reactor units and 25.5 percent of global operating net capacity, giving its maintenance cycle disproportionate importance within the international nuclear engineering service base.
New construction is shifting the future maintenance asset base toward Asia. China accounted for 37 of the 77 reactors under construction in the current PRIS inventory, representing 39.95 GWe, approximately 48 percent of all reactor units under construction and approximately 49.5 percent of associated global net capacity. India had 8 reactors representing 6.03 GWe under construction, the Republic of Korea had 4 reactors representing 5.36 GWe, Russia had 5 reactors representing 5.00 GWe, while Egypt and Türkiye each had 4 large reactors under construction. Newly commissioned plants initially carry lower ageing related maintenance exposure, although periodic refueling, inspection, testing, pump and valve maintenance, turbine work, electrical maintenance and instrumentation calibration begin within the operating cycle. As these fleets accumulate reactor years, the installed maintenance base expands independently of the rate of subsequent new construction.
The United States constitutes the largest single national nuclear maintenance environment. NRC records 94 commercial nuclear power reactors operating in 28 states at 56 sites, comprising 63 pressurized water reactors and 31 boiling water reactors. PRIS assigns the fleet 96.95 GWe of net operating capacity. The units are distributed across Alabama, Arizona, Arkansas, California, Connecticut, Florida, Georgia, Illinois, Kansas, Louisiana, Maryland, Michigan, Minnesota, Mississippi, Missouri, Nebraska, New Hampshire, New Jersey, New York, North Carolina, Ohio, Pennsylvania, South Carolina, Tennessee, Texas, Virginia, Washington and Wisconsin. Most United States commercial reactors are geographically located east of the Mississippi River, creating particularly dense maintenance activity across the Midwest, Mid Atlantic and Southeast. Illinois has the largest state reactor population, with 11 reactors at six plants and approximately 11,592 MW of nuclear generating capacity. Georgia contains Plant Vogtle, the largest United States nuclear power plant by generating capacity, with four reactors and approximately 4,530 MW of net summer capacity. The United States nuclear fleet recorded an average capacity factor of approximately 91 percent in 2025. High utilization, combined with 18 to 24 month refueling intervals, places strong operational significance on outage execution, equipment reliability and avoidance of forced outages.
Reactor technology materially affects maintenance content. The United States pressurized water reactor fleet requires recurring engineering work involving steam generators, reactor coolant pumps, pressurizers, primary coolant piping, control rod drive mechanisms, reactor vessel heads and associated primary system components. Boiling water reactor maintenance has a different equipment distribution, including reactor recirculation systems, steam separators and dryers, control rod drive systems, reactor internals and direct cycle steam equipment. France has a highly standardized pressurized water reactor fleet under EDF operation, producing substantial repetition in reactor technology, equipment families and outage programs. The Republic of Korea also operates a predominantly pressurized water reactor fleet. Canada retains a major pressurized heavy water reactor base, creating distinctive maintenance requirements associated with pressure tubes, feeder systems, fuel channels and heavy water systems. The United Kingdom retains gas cooled reactor assets alongside newer pressurized water technology, while Russia operates several reactor technology families. Reactor type therefore determines significant portions of inspection methods, outage scope, replacement component demand and specialist contractor capability.
The service chain comprises nuclear plant owners and licensed operators, reactor and nuclear steam supply system OEMs, turbine and electrical equipment manufacturers, nuclear engineering companies, specialized maintenance contractors, nondestructive examination companies, instrumentation and control specialists, radiation protection contractors, outage labor providers and nuclear qualified component suppliers. Asset ownership and nuclear safety responsibility remain with the licensed operator. Specialized work is distributed among internal plant maintenance organizations, original equipment manufacturers and qualified external contractors according to equipment technology, proprietary engineering knowledge, outage workload, radiation conditions and regulatory qualification. Contractor intensity rises sharply during refueling outages because large quantities of mechanical work, electrical work, inspection, testing, modification and component replacement must be executed concurrently within a limited shutdown period. IAEA SSG 74 separately addresses the responsibilities of operating organizations, contractors, designers and manufacturers, reflecting the formal organizational interfaces inherent in nuclear maintenance activities.
Regional maintenance characteristics reflect reactor age, fleet structure, reactor technology, regulatory regime and construction cycle. The United States combines the world's largest operating capacity with an ageing reactor fleet, high utilization, extensive license renewal activity and a mature specialist outage contractor sector. France combines 57 operating reactors and 63.00 GWe under a highly centralized fleet structure. China combines 60 operating reactors and 58.81 GWe with the world's largest construction program, progressively increasing the number of units entering refueling and periodic inspection cycles. Japan had 14 reactors in operation with 12.63 GWe and a further 19 reactors representing 19.05 GWe in suspended operation, creating engineering requirements associated with restarted units, extended shutdown condition management, equipment ageing, regulatory modification, inspection and system requalification. India combines 23 operating reactors with 8 additional large units under construction and two units in suspended operation. Mature nuclear markets therefore carry increasing requirements for ageing management, refurbishment, component replacement, digital modernization and long term operation engineering. Expanding Asian fleets add recurring maintenance demand as new reactor capacity enters commercial operation and accumulates operating cycles. These physical fleet characteristics, combined with nuclear specific regulatory requirements and recurring outage intervals, define Nuclear Engineering Maintenance Service as a technically specialized engineering activity tied directly to the installed reactor asset base, reactor operating age, technology configuration and licensed operating life.
The delivered object is a defined software capability or professional workflow with explicit users, interfaces and operating obligations. Software access, implementation work, managed operations and transaction flows must remain distinct commercial measures.
What turns activity into demand
Contracted users, deployed systems or completed service scope create paid demand through the stated licence or delivery basis. Hardware, implementation, recurring fees and managed services may share a contract and require separate accounting.
The commercial boundary
For Nuclear Engineering Maintenance Service, distinguish the supplied service or configured system from its inputs and the complete application. Report types and applications may overlap; retain the selected edition's product definition, geography, period, unit and transaction basis when comparing estimates.
What defines the supplied nuclear engineering maintenance service offering?
Nuclear Engineering Maintenance Service comprises specialized engineering, inspection, testing, maintenance, repair, overhaul, replacement, modification and technical integrity activities performed on the structures, systems and components of operating nuclear facilities to preserve or restore their required safety functions, pressure boundary integrity, mechanical and electrical availability, configuration basis and licensed performance. Identify the functional boundary, data ownership, integration work, service commitment and charging unit. Compare recurring access revenue separately from one-off implementation and pass-through transactions; deployment count is not automatically active paid usage.
Selected research
Market Outlook & Growth Opportunities
Global Nuclear Engineering Maintenance Service Market Outlook and Growth Opportunities 2026
Market perspective
Nuclear Engineering Maintenance Service comprises specialized engineering, inspection, testing, maintenance, repair, overhaul, replacement, modification and technical integrity activities performed on the structures, systems and components of operating nuclear facilities to preserve or restore their required safety functions, pressure boundary integrity, mechanical and electrical availability, configuration basis and licensed performance. At first principles level, nuclear maintenance manages the physical degradation mechanisms that progressively alter nuclear plant assets, including corrosion, erosion, fatigue, irradiation effects, thermal ageing, wear, vibration, insulation deterioration, calibration drift, leakage, material embrittlement and component obsolescence. The engineering requirement is determined by the functional consequence of degradation within reactor shutdown, reactivity control, core cooling, decay heat removal, containment, radioactive material confinement, emergency electrical power and supporting plant systems. IAEA Safety Standards Series No. SSG 74 establishes maintenance, testing, surveillance and inspection as integrated activities required to maintain the reliability and availability of structures, systems and components important to safety and identifies preventive maintenance, including periodic, predictive and planned activities, together with corrective maintenance following equipment failure. In the United States, NRC 10 CFR 50.65 requires monitoring of maintenance effectiveness for safety related structures, systems and components and specified nonsafety related equipment whose failure could impair a safety function, initiate a reactor scram or cause unnecessary actuation of a safety related system.
The technical work content extends across the nuclear steam supply system, reactor coolant pressure boundary, reactor vessel internals, pumps, valves, piping, steam generators, heat exchangers, turbine generator systems, feedwater and condensate systems, emergency diesel generators, switchgear, transformers, electrical distribution, instrumentation and control systems, containment systems, fuel handling equipment and other safety significant or availability critical plant assets. Major engineering activities include preventive and corrective maintenance, condition monitoring, predictive diagnostics, in service inspection, nondestructive examination, pressure boundary examination, weld inspection, valve and actuator overhaul, rotating equipment maintenance, steam generator examination and tube work, reactor coolant pump maintenance, turbine generator inspection and overhaul, electrical equipment testing, instrumentation calibration, component replacement, equipment qualification, system modification, digital modernization and ageing management. Intrusive work is heavily scheduled into planned refueling outages because reactor shutdown provides access to systems and components that cannot normally be isolated or disassembled during power operation. United States nuclear units typically refuel every 18 to 24 months, primarily during spring and autumn periods of lower electricity demand, and operators use these outages for equipment upgrades, repairs, inspections and other maintenance work. The resulting outage cycle creates a recurrent concentration of engineering labor, specialist contractors, inspection personnel, component replacement activity and nuclear qualified materials around each reactor operating cycle.
Nuclear maintenance is governed by the interaction of material condition, equipment reliability, deterministic safety requirements, probabilistic risk significance, radiation exposure, configuration control and plant operating availability. Maintenance on equipment important to safety remains subject to the plant licensing basis and applicable nuclear quality assurance, technical specification, radiation protection, pressure boundary, seismic, electrical qualification and inspection requirements. Maintenance planning therefore incorporates equipment function, redundancy, train availability, common cause failure potential and temporary changes in plant risk associated with removing equipment from service. Ageing management becomes progressively more material during extended operation because degradation of structures, systems and components can alter safety margins and increase the probability of functional loss. The ageing effect is particularly important in mature fleets. The average age of the United States operating commercial reactor fleet was approximately 44 years as of March 2026. NRC subsequent license renewal extends eligible reactor operating periods from 60 years to 80 years and requires specific technical evaluation of ageing management programs for the extended operating period. By mid 2026, subsequent license renewals had been completed for multiple large reactor fleets and additional applications remained under regulatory review, extending the maintenance horizon of a substantial portion of the installed United States nuclear asset base into the 2040s, 2050s and 2060s.
Read the full market overview
The global installed nuclear asset base is large, capital intensive and geographically concentrated. IAEA PRIS reported 417 nuclear power reactors in operation with 379.70 GWe of total net installed capacity as of late July 2026. These reactors were distributed across 31 countries. A further 21 reactors representing 19.39 GWe were in suspended operation, principally in Japan and India, while 77 reactors representing 80.72 GWe were under construction across 17 countries. The operating fleet has accumulated more than 20,700 reactor years of operating experience. In 2025, reactors for which commercial operating data were available recorded a weighted global energy availability factor of 84.1 percent, and reactors reported in the PRIS electricity production dataset supplied approximately 2,633 TWh of nuclear electricity. The physical scale of this installed equipment base creates recurring inspection, outage maintenance, component refurbishment, ageing management, instrumentation modernization and major replacement requirements throughout reactor operating lives that commonly extend for several decades.
Global operating capacity is led by the United States with 94 reactors and 96.95 GWe, France with 57 reactors and 63.00 GWe, China with 60 reactors and 58.81 GWe, Russia with 34 reactors and 27.97 GWe, and the Republic of Korea with 26 reactors and 25.61 GWe. These five national fleets contain approximately 272.34 GWe, equivalent to about 71.7 percent of global operating nuclear capacity. Other material operating fleets include Canada with 17 reactors and 12.71 GWe, Ukraine with 15 reactors and 13.11 GWe, Japan with 14 operating reactors and 12.63 GWe, India with 23 reactors and 7.73 GWe, the United Kingdom with 9 reactors and 5.88 GWe, Spain with 7 reactors and 7.12 GWe, Sweden with 6 reactors and 7.01 GWe, Pakistan with 6 reactors and 3.26 GWe, and the Czech Republic with 6 reactors and 3.97 GWe. The United States alone accounts for approximately 22.5 percent of global operating reactor units and 25.5 percent of global operating net capacity, giving its maintenance cycle disproportionate importance within the international nuclear engineering service base.
New construction is shifting the future maintenance asset base toward Asia. China accounted for 37 of the 77 reactors under construction in the current PRIS inventory, representing 39.95 GWe, approximately 48 percent of all reactor units under construction and approximately 49.5 percent of associated global net capacity. India had 8 reactors representing 6.03 GWe under construction, the Republic of Korea had 4 reactors representing 5.36 GWe, Russia had 5 reactors representing 5.00 GWe, while Egypt and Türkiye each had 4 large reactors under construction. Newly commissioned plants initially carry lower ageing related maintenance exposure, although periodic refueling, inspection, testing, pump and valve maintenance, turbine work, electrical maintenance and instrumentation calibration begin within the operating cycle. As these fleets accumulate reactor years, the installed maintenance base expands independently of the rate of subsequent new construction.
The United States constitutes the largest single national nuclear maintenance environment. NRC records 94 commercial nuclear power reactors operating in 28 states at 56 sites, comprising 63 pressurized water reactors and 31 boiling water reactors. PRIS assigns the fleet 96.95 GWe of net operating capacity. The units are distributed across Alabama, Arizona, Arkansas, California, Connecticut, Florida, Georgia, Illinois, Kansas, Louisiana, Maryland, Michigan, Minnesota, Mississippi, Missouri, Nebraska, New Hampshire, New Jersey, New York, North Carolina, Ohio, Pennsylvania, South Carolina, Tennessee, Texas, Virginia, Washington and Wisconsin. Most United States commercial reactors are geographically located east of the Mississippi River, creating particularly dense maintenance activity across the Midwest, Mid Atlantic and Southeast. Illinois has the largest state reactor population, with 11 reactors at six plants and approximately 11,592 MW of nuclear generating capacity. Georgia contains Plant Vogtle, the largest United States nuclear power plant by generating capacity, with four reactors and approximately 4,530 MW of net summer capacity. The United States nuclear fleet recorded an average capacity factor of approximately 91 percent in 2025. High utilization, combined with 18 to 24 month refueling intervals, places strong operational significance on outage execution, equipment reliability and avoidance of forced outages.
Reactor technology materially affects maintenance content. The United States pressurized water reactor fleet requires recurring engineering work involving steam generators, reactor coolant pumps, pressurizers, primary coolant piping, control rod drive mechanisms, reactor vessel heads and associated primary system components. Boiling water reactor maintenance has a different equipment distribution, including reactor recirculation systems, steam separators and dryers, control rod drive systems, reactor internals and direct cycle steam equipment. France has a highly standardized pressurized water reactor fleet under EDF operation, producing substantial repetition in reactor technology, equipment families and outage programs. The Republic of Korea also operates a predominantly pressurized water reactor fleet. Canada retains a major pressurized heavy water reactor base, creating distinctive maintenance requirements associated with pressure tubes, feeder systems, fuel channels and heavy water systems. The United Kingdom retains gas cooled reactor assets alongside newer pressurized water technology, while Russia operates several reactor technology families. Reactor type therefore determines significant portions of inspection methods, outage scope, replacement component demand and specialist contractor capability.
The service chain comprises nuclear plant owners and licensed operators, reactor and nuclear steam supply system OEMs, turbine and electrical equipment manufacturers, nuclear engineering companies, specialized maintenance contractors, nondestructive examination companies, instrumentation and control specialists, radiation protection contractors, outage labor providers and nuclear qualified component suppliers. Asset ownership and nuclear safety responsibility remain with the licensed operator. Specialized work is distributed among internal plant maintenance organizations, original equipment manufacturers and qualified external contractors according to equipment technology, proprietary engineering knowledge, outage workload, radiation conditions and regulatory qualification. Contractor intensity rises sharply during refueling outages because large quantities of mechanical work, electrical work, inspection, testing, modification and component replacement must be executed concurrently within a limited shutdown period. IAEA SSG 74 separately addresses the responsibilities of operating organizations, contractors, designers and manufacturers, reflecting the formal organizational interfaces inherent in nuclear maintenance activities.
Regional maintenance characteristics reflect reactor age, fleet structure, reactor technology, regulatory regime and construction cycle. The United States combines the world's largest operating capacity with an ageing reactor fleet, high utilization, extensive license renewal activity and a mature specialist outage contractor sector. France combines 57 operating reactors and 63.00 GWe under a highly centralized fleet structure. China combines 60 operating reactors and 58.81 GWe with the world's largest construction program, progressively increasing the number of units entering refueling and periodic inspection cycles. Japan had 14 reactors in operation with 12.63 GWe and a further 19 reactors representing 19.05 GWe in suspended operation, creating engineering requirements associated with restarted units, extended shutdown condition management, equipment ageing, regulatory modification, inspection and system requalification. India combines 23 operating reactors with 8 additional large units under construction and two units in suspended operation. Mature nuclear markets therefore carry increasing requirements for ageing management, refurbishment, component replacement, digital modernization and long term operation engineering. Expanding Asian fleets add recurring maintenance demand as new reactor capacity enters commercial operation and accumulates operating cycles. These physical fleet characteristics, combined with nuclear specific regulatory requirements and recurring outage intervals, define Nuclear Engineering Maintenance Service as a technically specialized engineering activity tied directly to the installed reactor asset base, reactor operating age, technology configuration and licensed operating life.
The global Nuclear Engineering Maintenance Service market was valued at US$ million in 2026 and is projected to reach US$ million by 2032, implying a compound annual growth rate (CAGR) of % over 2026-2032.
The North America market for Nuclear Engineering Maintenance Service is projected to increase from US$ million in 2026 to US$ million by 2032, at a CAGR of % over 2026-2032.
The Europe market for Nuclear Engineering Maintenance Service is projected to increase from US$ million in 2026 to US$ million by 2032, at a CAGR of % over 2026-2032.
The Asia Pacific market for Nuclear Engineering Maintenance Service is projected to increase from US$ million in 2026 to US$ million by 2032, at a CAGR of % over 2026-2032.
In China, the Nuclear Engineering Maintenance Service market is projected to increase from US$ million in 2026 to US$ million by 2032, at a CAGR of % over 2026-2032.
Major global companies in the Nuclear Engineering Maintenance Service market include ALTEN, AMS Corporation, Dietsmann, Fortum, Onet Technologies, Intertek, KEPCO KPS, Nuclear Engineering, Ltd. and REEL International, among others. In 2025, the top three vendors together accounted for approximately % of global market revenue.
This report provides an overview of the global Nuclear Engineering Maintenance Service market in terms of revenue and gross margin, analyzing global market trends using historical revenue data for 2021-2025, estimates for 2026, and projected CAGRs through 2032.
The study covers key producers of Nuclear Engineering Maintenance Service and market revenue by major regions and countries, assesses future market potential, and highlights priority regions and countries for segmenting the market into sub-sectors, with country-specific market value data for the U.S., Canada, Mexico, Brazil, China, Japan, South Korea, Southeast Asia, India, Germany, the U.K., Italy, the Middle East, Africa, and other countries.
The report also presents Nuclear Engineering Maintenance Service revenue, market share, and industry ranking for the main companies for 2021-2026, identifies the major stakeholders in the global market, and analyzes their competitive landscape and market positioning based on recent developments and segmental revenues.
Across the 2021-2026 period, the analysis compares revenue growth and profitability profiles by company, distinguishing participants with sustained expansion from those with more cyclical performance, and relates these patterns to differences in regional exposure, product portfolios, and application focus in the global Nuclear Engineering Maintenance Service market.
Nuclear Engineering Maintenance Service Segment by Company
ALTEN
AMS Corporation
Dietsmann
Fortum
Onet Technologies
Intertek
KEPCO KPS
Nuclear Engineering, Ltd.
REEL International
Sargent & Lundy
Westinghouse Electric Company
Framatome
GE Vernova Hitachi Nuclear Energy
Mitsubishi Heavy Industries
Doosan Enerbility
Rusatom Service
BWX Technologies
AtkinsRéalis
Cavendish Nuclear
Bilfinger
Amentum
Assystem
Kinectrics
CNNC
Altrad Endel
Day & Zimmermann
Orano
Curtiss Wright
Toshiba Energy Systems & Solutions
Aecon
NUVIA
Arabelle Solutions
Fluor Corporation
Nuclear Engineering Maintenance Service Segment by Type
Preventive Maintenance
Corrective Maintenance
Nuclear Engineering Maintenance Service Segment by Application
PWR Nuclear Power Plants
BWR Nuclear Power Plants
Nuclear Engineering Maintenance Service Segment by Region
North America
United States
Canada
Mexico
Europe
Germany
France
U.K.
Italy
Russia
Spain
Netherlands
Switzerland
Sweden
Poland
Asia-Pacific
China
Japan
South Korea
India
Australia
Taiwan
Southeast Asia
South America
Brazil
Argentina
Chile
Colombia
Middle East & Africa
Egypt
South Africa
Israel
Türkiye
GCC Countries
Study Objectives
1. To analyze and research the global Nuclear Engineering Maintenance Service status and future forecast, involving, revenue, growth rate (CAGR), market share, historical and forecast.
2. To present the Nuclear Engineering Maintenance Service key companies, revenue, market share, and recent developments.
3. To split the Nuclear Engineering Maintenance Service breakdown data by regions, type, companies, and application.
4. To analyze the global and key regions Nuclear Engineering Maintenance Service market potential and advantage, opportunity and challenge, restraints, and risks.
5. To identify Nuclear Engineering Maintenance Service significant trends, drivers, influence factors in global and regions.
6. To analyze Nuclear Engineering Maintenance Service competitive developments such as expansions, agreements, new product launches, and acquisitions in the market.
Reasons to Buy This Report
1. This report will help the readers to understand the competition within the industries and strategies for the competitive environment to enhance the potential profit. The report also focuses on the competitive landscape of the global Nuclear Engineering Maintenance Service market, and introduces in detail the market share, industry ranking, competitor ecosystem, market performance, new product development, operation situation, expansion, and acquisition. etc. of the main players, which helps the readers to identify the main competitors and deeply understand the competition pattern of the market.
2. This report will help stakeholders to understand the global industry status and trends of Nuclear Engineering Maintenance Service and provides them with information on key market drivers, restraints, challenges, and opportunities.
3. This report will help stakeholders to understand competitors better and gain more insights to strengthen their position in their businesses. The competitive landscape section includes the market share and rank (in sales and value), competitor ecosystem, new product development, expansion, and acquisition.
4. This report stays updated with novel technology integration, features, and the latest developments in the market.
5. This report helps stakeholders to gain insights into which regions to target globally.
6. This report helps stakeholders to gain insights into the end-user perception concerning the adoption of Nuclear Engineering Maintenance Service.
7. This report helps stakeholders to identify some of the key players in the market and understand their valuable contribution.
Chapter Outline
Chapter 1: Introduces the report scope of the report, global total market size.
Chapter 2: Analysis key trends, drivers, challenges, and opportunities within the global Nuclear Engineering Maintenance Service industry.
Chapter 3: Detailed analysis of Nuclear Engineering Maintenance Service company competitive landscape, revenue market share, latest development plan, merger, and acquisition information, etc.
Chapter 4: Provides the analysis of various market segments by type, covering the market size and development potential of each market segment, to help readers find the blue ocean market in different market segments.
Chapter 5: Provides the analysis of various market segments by application, covering the market size and development potential of each market segment, to help readers find the blue ocean market in different downstream markets.
Chapter 6: Sales value of Nuclear Engineering Maintenance Service in regional level. It provides a quantitative analysis of the market size and development potential of each region and introduces the market development, future development prospects, market space, and market size of key country in the world.
Chapter 7: Sales value of Nuclear Engineering Maintenance Service in country level. It provides sigmate data by type, and by application for each country/region.
Chapter 8: Provides profiles of key players, introducing the basic situation of the main companies in the market in detail, including revenue, gross margin, product introduction, recent development, etc.
Chapter 9: Concluding Insights.
More report detail
Tables and figures
Scope & coverage.
Types
- Preventive Maintenance
- Corrective Maintenance
Applications
- PWR Nuclear Power Plants
- BWR Nuclear Power Plants
Companies covered
- ALTEN
- AMS Corporation
- Dietsmann
- Fortum
- Onet Technologies
- Intertek
- KEPCO KPS
- Nuclear Engineering, Ltd.
- REEL International
- Sargent & Lundy
- Westinghouse Electric Company
- Framatome
- GE Vernova Hitachi Nuclear Energy
- Mitsubishi Heavy Industries
- Doosan Enerbility
- Rusatom Service
- BWX Technologies
- AtkinsRéalis
- Cavendish Nuclear
- Bilfinger
- Amentum
- Assystem
- Kinectrics
- CNNC
- Altrad Endel
- Day & Zimmermann
- Orano
- Curtiss Wright
- Toshiba Energy Systems & Solutions
- Aecon
- NUVIA
- Arabelle Solutions
- Fluor Corporation
Inside the report.
1 Market Overview
- 1.1 Product Definition
- 1.2 Global Nuclear Engineering Maintenance Service Market Size, 2021 VS 2025 VS 2032
- 1.3 Global Nuclear Engineering Maintenance Service Market Size (2021-2032)
- 1.4 Assumptions and Limitations
- 1.5 Study Goals and Objectives
2 Nuclear Engineering Maintenance Service Market Dynamics
- 2.1 Nuclear Engineering Maintenance Service Industry Trends
- 2.2 Nuclear Engineering Maintenance Service Industry Drivers
- 2.3 Nuclear Engineering Maintenance Service Industry Opportunities and Challenges
- 2.4 Nuclear Engineering Maintenance Service Industry Restraints
3 Nuclear Engineering Maintenance Service Market by Company
- 3.1 Global Nuclear Engineering Maintenance Service Company Revenue Ranking in 2025
- 3.2 Global Nuclear Engineering Maintenance Service Revenue by Company (2021-2026)
- 3.3 Global Nuclear Engineering Maintenance Service Company Ranking (2024-2026)
- 3.4 Global Nuclear Engineering Maintenance Service Company Manufacturing Base and Headquarters
- 3.5 Global Nuclear Engineering Maintenance Service Company Product Type and Application
- 3.6 Global Nuclear Engineering Maintenance Service Company Establishment Date
- 3.7 Market Competitive Analysis
- 3.7.1 Global Nuclear Engineering Maintenance Service Market Concentration Ratio (CR5 and HHI)
- 3.7.2 Global Top 5 and 10 Company Market Share by Revenue in 2025
- 3.7.3 2025 Nuclear Engineering Maintenance Service Tier 1, Tier 2, and Tier 3 Companies
- 3.8 Mergers and Acquisitions Expansion
4 Nuclear Engineering Maintenance Service Market by Type
- 4.1 Nuclear Engineering Maintenance Service Type Introduction
- 4.1.1 Preventive Maintenance
- 4.1.2 Corrective Maintenance
- 4.2 Global Nuclear Engineering Maintenance Service Sales Value by Type
- 4.2.1 Global Nuclear Engineering Maintenance Service Sales Value by Type (2021 VS 2025 VS 2032)
- 4.2.2 Global Nuclear Engineering Maintenance Service Sales Value by Type (2021-2032)
- 4.2.3 Global Nuclear Engineering Maintenance Service Sales Value Share by Type (2021-2032)
5 Nuclear Engineering Maintenance Service Market by Application
- 5.1 Nuclear Engineering Maintenance Service Application Introduction
- 5.1.1 PWR Nuclear Power Plants
- 5.1.2 BWR Nuclear Power Plants
- 5.2 Global Nuclear Engineering Maintenance Service Sales Value by Application
- 5.2.1 Global Nuclear Engineering Maintenance Service Sales Value by Application (2021 VS 2025 VS 2032)
- 5.2.2 Global Nuclear Engineering Maintenance Service Sales Value by Application (2021-2032)
- 5.2.3 Global Nuclear Engineering Maintenance Service Sales Value Share by Application (2021-2032)
6 Nuclear Engineering Maintenance Service Regional Value Analysis
- 6.1 Global Nuclear Engineering Maintenance Service Sales Value by Region: 2021 VS 2025 VS 2032
- 6.2 Global Nuclear Engineering Maintenance Service Sales Value by Region (2021-2032)
- 6.2.1 Global Nuclear Engineering Maintenance Service Sales Value by Region: 2021-2026
- 6.2.2 Global Nuclear Engineering Maintenance Service Sales Value by Region (2027-2032)
- 6.3 North America
- 6.3.1 North America Nuclear Engineering Maintenance Service Sales Value (2021-2032)
- 6.3.2 North America Nuclear Engineering Maintenance Service Sales Value Share by Country, 2025 VS 2032
- 6.4 Europe
- 6.4.1 Europe Nuclear Engineering Maintenance Service Sales Value (2021-2032)
- 6.4.2 Europe Nuclear Engineering Maintenance Service Sales Value Share by Country, 2025 VS 2032
- 6.5 Asia-Pacific
- 6.5.1 Asia-Pacific Nuclear Engineering Maintenance Service Sales Value (2021-2032)
- 6.5.2 Asia-Pacific Nuclear Engineering Maintenance Service Sales Value Share by Country, 2025 VS 2032
- 6.6 South America
- 6.6.1 South America Nuclear Engineering Maintenance Service Sales Value (2021-2032)
- 6.6.2 South America Nuclear Engineering Maintenance Service Sales Value Share by Country, 2025 VS 2032
- 6.7 Middle East & Africa
- 6.7.1 Middle East & Africa Nuclear Engineering Maintenance Service Sales Value (2021-2032)
- 6.7.2 Middle East & Africa Nuclear Engineering Maintenance Service Sales Value Share by Country, 2025 VS 2032
7 Nuclear Engineering Maintenance Service Country-level Value Analysis
- 7.1 Global Nuclear Engineering Maintenance Service Sales Value by Country: 2021 VS 2025 VS 2032
- 7.2 Global Nuclear Engineering Maintenance Service Sales Value by Country (2021-2032)
- 7.2.1 Global Nuclear Engineering Maintenance Service Sales Value by Country (2021-2026)
- 7.2.2 Global Nuclear Engineering Maintenance Service Sales Value by Country (2027-2032)
- 7.3 USA
- 7.3.1 USA Nuclear Engineering Maintenance Service Sales Value Growth Rate (2021-2032)
- 7.3.2 USA Nuclear Engineering Maintenance Service Sales Value Share by Type, 2025 VS 2032
- 7.3.3 USA Nuclear Engineering Maintenance Service Sales Value Share by Application, 2025 VS 2032
- 7.4 Canada
- 7.4.1 Canada Nuclear Engineering Maintenance Service Sales Value Growth Rate (2021-2032)
- 7.4.2 Canada Nuclear Engineering Maintenance Service Sales Value Share by Type, 2025 VS 2032
- 7.4.3 Canada Nuclear Engineering Maintenance Service Sales Value Share by Application, 2025 VS 2032
- 7.5 Mexico
- 7.5.1 Mexico Nuclear Engineering Maintenance Service Sales Value Growth Rate (2021-2032)
- 7.5.2 Mexico Nuclear Engineering Maintenance Service Sales Value Share by Type, 2025 VS 2032
- 7.5.3 Mexico Nuclear Engineering Maintenance Service Sales Value Share by Application, 2025 VS 2032
- 7.6 Germany
- 7.6.1 Germany Nuclear Engineering Maintenance Service Sales Value Growth Rate (2021-2032)
- 7.6.2 Germany Nuclear Engineering Maintenance Service Sales Value Share by Type, 2025 VS 2032
- 7.6.3 Germany Nuclear Engineering Maintenance Service Sales Value Share by Application, 2025 VS 2032
- 7.7 France
- 7.7.1 France Nuclear Engineering Maintenance Service Sales Value Growth Rate (2021-2032)
- 7.7.2 France Nuclear Engineering Maintenance Service Sales Value Share by Type, 2025 VS 2032
- 7.7.3 France Nuclear Engineering Maintenance Service Sales Value Share by Application, 2025 VS 2032
- 7.8 U.K.
- 7.8.1 U.K. Nuclear Engineering Maintenance Service Sales Value Growth Rate (2021-2032)
- 7.8.2 U.K. Nuclear Engineering Maintenance Service Sales Value Share by Type, 2025 VS 2032
- 7.8.3 U.K. Nuclear Engineering Maintenance Service Sales Value Share by Application, 2025 VS 2032
- 7.9 Italy
- 7.9.1 Italy Nuclear Engineering Maintenance Service Sales Value Growth Rate (2021-2032)
- 7.9.2 Italy Nuclear Engineering Maintenance Service Sales Value Share by Type, 2025 VS 2032
- 7.9.3 Italy Nuclear Engineering Maintenance Service Sales Value Share by Application, 2025 VS 2032
- 7.10 Spain
- 7.10.1 Spain Nuclear Engineering Maintenance Service Sales Value Growth Rate (2021-2032)
- 7.10.2 Spain Nuclear Engineering Maintenance Service Sales Value Share by Type, 2025 VS 2032
- 7.10.3 Spain Nuclear Engineering Maintenance Service Sales Value Share by Application, 2025 VS 2032
- 7.11 Russia
- 7.11.1 Russia Nuclear Engineering Maintenance Service Sales Value Growth Rate (2021-2032)
- 7.11.2 Russia Nuclear Engineering Maintenance Service Sales Value Share by Type, 2025 VS 2032
- 7.11.3 Russia Nuclear Engineering Maintenance Service Sales Value Share by Application, 2025 VS 2032
- 7.12 Netherlands
- 7.12.1 Netherlands Nuclear Engineering Maintenance Service Sales Value Growth Rate (2021-2032)
- 7.12.2 Netherlands Nuclear Engineering Maintenance Service Sales Value Share by Type, 2025 VS 2032
- 7.12.3 Netherlands Nuclear Engineering Maintenance Service Sales Value Share by Application, 2025 VS 2032
- 7.13 Nordic Countries
- 7.13.1 Nordic Countries Nuclear Engineering Maintenance Service Sales Value Growth Rate (2021-2032)
- 7.13.2 Nordic Countries Nuclear Engineering Maintenance Service Sales Value Share by Type, 2025 VS 2032
- 7.13.3 Nordic Countries Nuclear Engineering Maintenance Service Sales Value Share by Application, 2025 VS 2032
- 7.14 China
- 7.14.1 China Nuclear Engineering Maintenance Service Sales Value Growth Rate (2021-2032)
- 7.14.2 China Nuclear Engineering Maintenance Service Sales Value Share by Type, 2025 VS 2032
- 7.14.3 China Nuclear Engineering Maintenance Service Sales Value Share by Application, 2025 VS 2032
- 7.15 Japan
- 7.15.1 Japan Nuclear Engineering Maintenance Service Sales Value Growth Rate (2021-2032)
- 7.15.2 Japan Nuclear Engineering Maintenance Service Sales Value Share by Type, 2025 VS 2032
- 7.15.3 Japan Nuclear Engineering Maintenance Service Sales Value Share by Application, 2025 VS 2032
- 7.16 South Korea
- 7.16.1 South Korea Nuclear Engineering Maintenance Service Sales Value Growth Rate (2021-2032)
- 7.16.2 South Korea Nuclear Engineering Maintenance Service Sales Value Share by Type, 2025 VS 2032
- 7.16.3 South Korea Nuclear Engineering Maintenance Service Sales Value Share by Application, 2025 VS 2032
- 7.17 India
- 7.17.1 India Nuclear Engineering Maintenance Service Sales Value Growth Rate (2021-2032)
- 7.17.2 India Nuclear Engineering Maintenance Service Sales Value Share by Type, 2025 VS 2032
- 7.17.3 India Nuclear Engineering Maintenance Service Sales Value Share by Application, 2025 VS 2032
- 7.18 Australia
- 7.18.1 Australia Nuclear Engineering Maintenance Service Sales Value Growth Rate (2021-2032)
- 7.18.2 Australia Nuclear Engineering Maintenance Service Sales Value Share by Type, 2025 VS 2032
- 7.18.3 Australia Nuclear Engineering Maintenance Service Sales Value Share by Application, 2025 VS 2032
- 7.19 Southeast Asia
- 7.19.1 Southeast Asia Nuclear Engineering Maintenance Service Sales Value Growth Rate (2021-2032)
- 7.19.2 Southeast Asia Nuclear Engineering Maintenance Service Sales Value Share by Type, 2025 VS 2032
- 7.19.3 Southeast Asia Nuclear Engineering Maintenance Service Sales Value Share by Application, 2025 VS 2032
- 7.20 Brazil
- 7.20.1 Brazil Nuclear Engineering Maintenance Service Sales Value Growth Rate (2021-2032)
- 7.20.2 Brazil Nuclear Engineering Maintenance Service Sales Value Share by Type, 2025 VS 2032
- 7.20.3 Brazil Nuclear Engineering Maintenance Service Sales Value Share by Application, 2025 VS 2032
- 7.21 Argentina
- 7.21.1 Argentina Nuclear Engineering Maintenance Service Sales Value Growth Rate (2021-2032)
- 7.21.2 Argentina Nuclear Engineering Maintenance Service Sales Value Share by Type, 2025 VS 2032
- 7.21.3 Argentina Nuclear Engineering Maintenance Service Sales Value Share by Application, 2025 VS 2032
- 7.22 Chile
- 7.22.1 Chile Nuclear Engineering Maintenance Service Sales Value Growth Rate (2021-2032)
- 7.22.2 Chile Nuclear Engineering Maintenance Service Sales Value Share by Type, 2025 VS 2032
- 7.22.3 Chile Nuclear Engineering Maintenance Service Sales Value Share by Application, 2025 VS 2032
- 7.23 Colombia
- 7.23.1 Colombia Nuclear Engineering Maintenance Service Sales Value Growth Rate (2021-2032)
- 7.23.2 Colombia Nuclear Engineering Maintenance Service Sales Value Share by Type, 2025 VS 2032
- 7.23.3 Colombia Nuclear Engineering Maintenance Service Sales Value Share by Application, 2025 VS 2032
- 7.24 Peru
- 7.24.1 Peru Nuclear Engineering Maintenance Service Sales Value Growth Rate (2021-2032)
- 7.24.2 Peru Nuclear Engineering Maintenance Service Sales Value Share by Type, 2025 VS 2032
- 7.24.3 Peru Nuclear Engineering Maintenance Service Sales Value Share by Application, 2025 VS 2032
- 7.25 Saudi Arabia
- 7.25.1 Saudi Arabia Nuclear Engineering Maintenance Service Sales Value Growth Rate (2021-2032)
- 7.25.2 Saudi Arabia Nuclear Engineering Maintenance Service Sales Value Share by Type, 2025 VS 2032
- 7.25.3 Saudi Arabia Nuclear Engineering Maintenance Service Sales Value Share by Application, 2025 VS 2032
- 7.26 Israel
- 7.26.1 Israel Nuclear Engineering Maintenance Service Sales Value Growth Rate (2021-2032)
- 7.26.2 Israel Nuclear Engineering Maintenance Service Sales Value Share by Type, 2025 VS 2032
- 7.26.3 Israel Nuclear Engineering Maintenance Service Sales Value Share by Application, 2025 VS 2032
- 7.27 UAE
- 7.27.1 UAE Nuclear Engineering Maintenance Service Sales Value Growth Rate (2021-2032)
- 7.27.2 UAE Nuclear Engineering Maintenance Service Sales Value Share by Type, 2025 VS 2032
- 7.27.3 UAE Nuclear Engineering Maintenance Service Sales Value Share by Application, 2025 VS 2032
- 7.28 Turkey
- 7.28.1 Turkey Nuclear Engineering Maintenance Service Sales Value Growth Rate (2021-2032)
- 7.28.2 Turkey Nuclear Engineering Maintenance Service Sales Value Share by Type, 2025 VS 2032
- 7.28.3 Turkey Nuclear Engineering Maintenance Service Sales Value Share by Application, 2025 VS 2032
- 7.29 Iran
- 7.29.1 Iran Nuclear Engineering Maintenance Service Sales Value Growth Rate (2021-2032)
- 7.29.2 Iran Nuclear Engineering Maintenance Service Sales Value Share by Type, 2025 VS 2032
- 7.29.3 Iran Nuclear Engineering Maintenance Service Sales Value Share by Application, 2025 VS 2032
- 7.30 Egypt
- 7.30.1 Egypt Nuclear Engineering Maintenance Service Sales Value Growth Rate (2021-2032)
- 7.30.2 Egypt Nuclear Engineering Maintenance Service Sales Value Share by Type, 2025 VS 2032
- 7.30.3 Egypt Nuclear Engineering Maintenance Service Sales Value Share by Application, 2025 VS 2032
8 Company Profiles
- 8.1 ALTEN
- 8.1.1 ALTEN Company Information
- 8.1.2 ALTEN Business Overview
- 8.1.3 ALTEN Nuclear Engineering Maintenance Service Revenue and Gross Margin (2021-2026)
- 8.1.4 ALTEN Nuclear Engineering Maintenance Service Product Portfolio
- 8.1.5 ALTEN Recent Developments
- 8.2 AMS Corporation
- 8.2.1 AMS Corporation Company Information
- 8.2.2 AMS Corporation Business Overview
- 8.2.3 AMS Corporation Nuclear Engineering Maintenance Service Revenue and Gross Margin (2021-2026)
- 8.2.4 AMS Corporation Nuclear Engineering Maintenance Service Product Portfolio
- 8.2.5 AMS Corporation Recent Developments
- 8.3 Dietsmann
- 8.3.1 Dietsmann Company Information
- 8.3.2 Dietsmann Business Overview
- 8.3.3 Dietsmann Nuclear Engineering Maintenance Service Revenue and Gross Margin (2021-2026)
- 8.3.4 Dietsmann Nuclear Engineering Maintenance Service Product Portfolio
- 8.3.5 Dietsmann Recent Developments
- 8.4 Fortum
- 8.4.1 Fortum Company Information
- 8.4.2 Fortum Business Overview
- 8.4.3 Fortum Nuclear Engineering Maintenance Service Revenue and Gross Margin (2021-2026)
- 8.4.4 Fortum Nuclear Engineering Maintenance Service Product Portfolio
- 8.4.5 Fortum Recent Developments
- 8.5 Onet Technologies
- 8.5.1 Onet Technologies Company Information
- 8.5.2 Onet Technologies Business Overview
- 8.5.3 Onet Technologies Nuclear Engineering Maintenance Service Revenue and Gross Margin (2021-2026)
- 8.5.4 Onet Technologies Nuclear Engineering Maintenance Service Product Portfolio
- 8.5.5 Onet Technologies Recent Developments
- 8.6 Intertek
- 8.6.1 Intertek Company Information
- 8.6.2 Intertek Business Overview
- 8.6.3 Intertek Nuclear Engineering Maintenance Service Revenue and Gross Margin (2021-2026)
- 8.6.4 Intertek Nuclear Engineering Maintenance Service Product Portfolio
- 8.6.5 Intertek Recent Developments
- 8.7 KEPCO KPS
- 8.7.1 KEPCO KPS Company Information
- 8.7.2 KEPCO KPS Business Overview
- 8.7.3 KEPCO KPS Nuclear Engineering Maintenance Service Revenue and Gross Margin (2021-2026)
- 8.7.4 KEPCO KPS Nuclear Engineering Maintenance Service Product Portfolio
- 8.7.5 KEPCO KPS Recent Developments
- 8.8 Nuclear Engineering, Ltd.
- 8.8.1 Nuclear Engineering, Ltd. Company Information
- 8.8.2 Nuclear Engineering, Ltd. Business Overview
- 8.8.3 Nuclear Engineering, Ltd. Nuclear Engineering Maintenance Service Revenue and Gross Margin (2021-2026)
- 8.8.4 Nuclear Engineering, Ltd. Nuclear Engineering Maintenance Service Product Portfolio
- 8.8.5 Nuclear Engineering, Ltd. Recent Developments
- 8.9 REEL International
- 8.9.1 REEL International Company Information
- 8.9.2 REEL International Business Overview
- 8.9.3 REEL International Nuclear Engineering Maintenance Service Revenue and Gross Margin (2021-2026)
- 8.9.4 REEL International Nuclear Engineering Maintenance Service Product Portfolio
- 8.9.5 REEL International Recent Developments
- 8.10 Sargent & Lundy
- 8.10.1 Sargent & Lundy Company Information
- 8.10.2 Sargent & Lundy Business Overview
- 8.10.3 Sargent & Lundy Nuclear Engineering Maintenance Service Revenue and Gross Margin (2021-2026)
- 8.10.4 Sargent & Lundy Nuclear Engineering Maintenance Service Product Portfolio
- 8.10.5 Sargent & Lundy Recent Developments
- 8.11 Westinghouse Electric Company
- 8.11.1 Westinghouse Electric Company Company Information
- 8.11.2 Westinghouse Electric Company Business Overview
- 8.11.3 Westinghouse Electric Company Nuclear Engineering Maintenance Service Revenue and Gross Margin (2021-2026)
- 8.11.4 Westinghouse Electric Company Nuclear Engineering Maintenance Service Product Portfolio
- 8.11.5 Westinghouse Electric Company Recent Developments
- 8.12 Framatome
- 8.12.1 Framatome Company Information
- 8.12.2 Framatome Business Overview
- 8.12.3 Framatome Nuclear Engineering Maintenance Service Revenue and Gross Margin (2021-2026)
- 8.12.4 Framatome Nuclear Engineering Maintenance Service Product Portfolio
- 8.12.5 Framatome Recent Developments
- 8.13 GE Vernova Hitachi Nuclear Energy
- 8.13.1 GE Vernova Hitachi Nuclear Energy Company Information
- 8.13.2 GE Vernova Hitachi Nuclear Energy Business Overview
- 8.13.3 GE Vernova Hitachi Nuclear Energy Nuclear Engineering Maintenance Service Revenue and Gross Margin (2021-2026)
- 8.13.4 GE Vernova Hitachi Nuclear Energy Nuclear Engineering Maintenance Service Product Portfolio
- 8.13.5 GE Vernova Hitachi Nuclear Energy Recent Developments
- 8.14 Mitsubishi Heavy Industries
- 8.14.1 Mitsubishi Heavy Industries Company Information
- 8.14.2 Mitsubishi Heavy Industries Business Overview
- 8.14.3 Mitsubishi Heavy Industries Nuclear Engineering Maintenance Service Revenue and Gross Margin (2021-2026)
- 8.14.4 Mitsubishi Heavy Industries Nuclear Engineering Maintenance Service Product Portfolio
- 8.14.5 Mitsubishi Heavy Industries Recent Developments
- 8.15 Doosan Enerbility
- 8.15.1 Doosan Enerbility Company Information
- 8.15.2 Doosan Enerbility Business Overview
- 8.15.3 Doosan Enerbility Nuclear Engineering Maintenance Service Revenue and Gross Margin (2021-2026)
- 8.15.4 Doosan Enerbility Nuclear Engineering Maintenance Service Product Portfolio
- 8.15.5 Doosan Enerbility Recent Developments
- 8.16 Rusatom Service
- 8.16.1 Rusatom Service Company Information
- 8.16.2 Rusatom Service Business Overview
- 8.16.3 Rusatom Service Nuclear Engineering Maintenance Service Revenue and Gross Margin (2021-2026)
- 8.16.4 Rusatom Service Nuclear Engineering Maintenance Service Product Portfolio
- 8.16.5 Rusatom Service Recent Developments
- 8.17 BWX Technologies
- 8.17.1 BWX Technologies Company Information
- 8.17.2 BWX Technologies Business Overview
- 8.17.3 BWX Technologies Nuclear Engineering Maintenance Service Revenue and Gross Margin (2021-2026)
- 8.17.4 BWX Technologies Nuclear Engineering Maintenance Service Product Portfolio
- 8.17.5 BWX Technologies Recent Developments
- 8.18 AtkinsRéalis
- 8.18.1 AtkinsRéalis Company Information
- 8.18.2 AtkinsRéalis Business Overview
- 8.18.3 AtkinsRéalis Nuclear Engineering Maintenance Service Revenue and Gross Margin (2021-2026)
- 8.18.4 AtkinsRéalis Nuclear Engineering Maintenance Service Product Portfolio
- 8.18.5 AtkinsRéalis Recent Developments
- 8.19 Cavendish Nuclear
- 8.19.1 Cavendish Nuclear Company Information
- 8.19.2 Cavendish Nuclear Business Overview
- 8.19.3 Cavendish Nuclear Nuclear Engineering Maintenance Service Revenue and Gross Margin (2021-2026)
- 8.19.4 Cavendish Nuclear Nuclear Engineering Maintenance Service Product Portfolio
- 8.19.5 Cavendish Nuclear Recent Developments
- 8.20 Bilfinger
- 8.20.1 Bilfinger Company Information
- 8.20.2 Bilfinger Business Overview
- 8.20.3 Bilfinger Nuclear Engineering Maintenance Service Revenue and Gross Margin (2021-2026)
- 8.20.4 Bilfinger Nuclear Engineering Maintenance Service Product Portfolio
- 8.20.5 Bilfinger Recent Developments
- 8.21 Amentum
- 8.21.1 Amentum Company Information
- 8.21.2 Amentum Business Overview
- 8.21.3 Amentum Nuclear Engineering Maintenance Service Revenue and Gross Margin (2021-2026)
- 8.21.4 Amentum Nuclear Engineering Maintenance Service Product Portfolio
- 8.21.5 Amentum Recent Developments
- 8.22 Assystem
- 8.22.1 Assystem Company Information
- 8.22.2 Assystem Business Overview
- 8.22.3 Assystem Nuclear Engineering Maintenance Service Revenue and Gross Margin (2021-2026)
- 8.22.4 Assystem Nuclear Engineering Maintenance Service Product Portfolio
- 8.22.5 Assystem Recent Developments
- 8.23 Kinectrics
- 8.23.1 Kinectrics Company Information
- 8.23.2 Kinectrics Business Overview
- 8.23.3 Kinectrics Nuclear Engineering Maintenance Service Revenue and Gross Margin (2021-2026)
- 8.23.4 Kinectrics Nuclear Engineering Maintenance Service Product Portfolio
- 8.23.5 Kinectrics Recent Developments
- 8.24 CNNC
- 8.24.1 CNNC Company Information
- 8.24.2 CNNC Business Overview
- 8.24.3 CNNC Nuclear Engineering Maintenance Service Revenue and Gross Margin (2021-2026)
- 8.24.4 CNNC Nuclear Engineering Maintenance Service Product Portfolio
- 8.24.5 CNNC Recent Developments
- 8.25 Altrad Endel
- 8.25.1 Altrad Endel Company Information
- 8.25.2 Altrad Endel Business Overview
- 8.25.3 Altrad Endel Nuclear Engineering Maintenance Service Revenue and Gross Margin (2021-2026)
- 8.25.4 Altrad Endel Nuclear Engineering Maintenance Service Product Portfolio
- 8.25.5 Altrad Endel Recent Developments
- 8.26 Day & Zimmermann
- 8.26.1 Day & Zimmermann Company Information
- 8.26.2 Day & Zimmermann Business Overview
- 8.26.3 Day & Zimmermann Nuclear Engineering Maintenance Service Revenue and Gross Margin (2021-2026)
- 8.26.4 Day & Zimmermann Nuclear Engineering Maintenance Service Product Portfolio
- 8.26.5 Day & Zimmermann Recent Developments
- 8.27 Orano
- 8.27.1 Orano Company Information
- 8.27.2 Orano Business Overview
- 8.27.3 Orano Nuclear Engineering Maintenance Service Revenue and Gross Margin (2021-2026)
- 8.27.4 Orano Nuclear Engineering Maintenance Service Product Portfolio
- 8.27.5 Orano Recent Developments
- 8.28 Curtiss Wright
- 8.28.1 Curtiss Wright Company Information
- 8.28.2 Curtiss Wright Business Overview
- 8.28.3 Curtiss Wright Nuclear Engineering Maintenance Service Revenue and Gross Margin (2021-2026)
- 8.28.4 Curtiss Wright Nuclear Engineering Maintenance Service Product Portfolio
- 8.28.5 Curtiss Wright Recent Developments
- 8.29 Toshiba Energy Systems & Solutions
- 8.29.1 Toshiba Energy Systems & Solutions Company Information
- 8.29.2 Toshiba Energy Systems & Solutions Business Overview
- 8.29.3 Toshiba Energy Systems & Solutions Nuclear Engineering Maintenance Service Revenue and Gross Margin (2021-2026)
- 8.29.4 Toshiba Energy Systems & Solutions Nuclear Engineering Maintenance Service Product Portfolio
- 8.29.5 Toshiba Energy Systems & Solutions Recent Developments
- 8.30 Aecon
- 8.30.1 Aecon Company Information
- 8.30.2 Aecon Business Overview
- 8.30.3 Aecon Nuclear Engineering Maintenance Service Revenue and Gross Margin (2021-2026)
- 8.30.4 Aecon Nuclear Engineering Maintenance Service Product Portfolio
- 8.30.5 Aecon Recent Developments
- 8.31 NUVIA
- 8.31.1 NUVIA Company Information
- 8.31.2 NUVIA Business Overview
- 8.31.3 NUVIA Nuclear Engineering Maintenance Service Revenue and Gross Margin (2021-2026)
- 8.31.4 NUVIA Nuclear Engineering Maintenance Service Product Portfolio
- 8.31.5 NUVIA Recent Developments
- 8.32 Arabelle Solutions
- 8.32.1 Arabelle Solutions Company Information
- 8.32.2 Arabelle Solutions Business Overview
- 8.32.3 Arabelle Solutions Nuclear Engineering Maintenance Service Revenue and Gross Margin (2021-2026)
- 8.32.4 Arabelle Solutions Nuclear Engineering Maintenance Service Product Portfolio
- 8.32.5 Arabelle Solutions Recent Developments
- 8.33 Fluor Corporation
- 8.33.1 Fluor Corporation Company Information
- 8.33.2 Fluor Corporation Business Overview
- 8.33.3 Fluor Corporation Nuclear Engineering Maintenance Service Revenue and Gross Margin (2021-2026)
- 8.33.4 Fluor Corporation Nuclear Engineering Maintenance Service Product Portfolio
- 8.33.5 Fluor Corporation Recent Developments
9 Concluding Insights
10 Appendix
- 10.1 Reasons for Doing This Study
- 10.2 Research Methodology
- 10.3 Research Process
- 10.4 Authors List of This Report
- 10.5 Data Source
- 10.5.1 Secondary Sources
- 10.5.2 Primary Sources
GET THE RESEARCH
Choose your license.
Choose who needs access.
All options are for this report and research series.
PDF by email within 3–5 working days after payment confirmation.
Talk to an analyst