APO RESEARCH · REPORT
Carbon Fiber
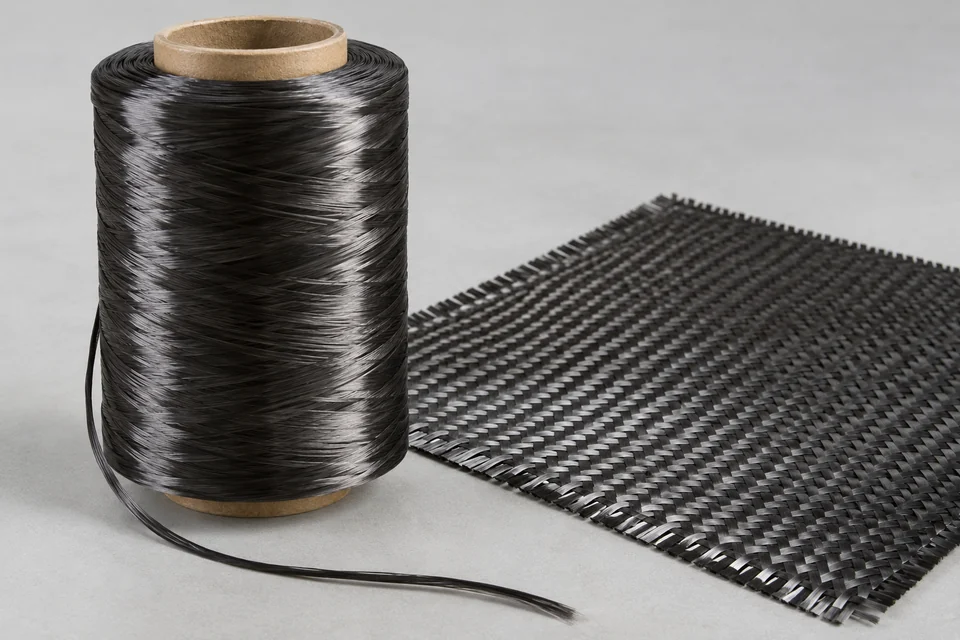
Carbon fibre consists of carbon-rich filaments supplied in forms such as tow, fabric or chopped fibre.
Product & engineering
Understand the product.
Carbon fiber is a continuous filamentary material of roughly 5–10 µm diameter whose composition is predominantly carbon (typically >92 % up to ≈99 %), arranged in a turbostratic graphitic microstructure where stacked graphene layers exhibit strong axial covalent bonding and weak transverse cohesion. Industrial grades derive mainly from polyacrylonitrile (PAN) or mesophase pitch precursors, with legacy rayon-based grades largely displaced; PAN-based fibers dominate high-strength applications, while mesophase-pitch fibers provide very high axial modulus and thermal conductivity. Fibers are supplied as tows designated by filament count (e.g., 1K–24K for aerospace, 24K–200K for industrial) and converted into prepregs, unidirectional tapes, woven/NCF fabrics, chopped or milled forms with a surface sizing compatible with thermoset epoxies, vinyl esters, polyesters, or high-temperature thermoplastics such as PEEK, PEKK, PPS, and PA. Typical properties span tensile strengths on the order of several gigapascals, axial tensile moduli from standard (~230 GPa) through intermediate (~300 GPa) to high and ultra-high (>350 GPa), densities near 1.75–1.95 g·cm⁻³, near-zero to slightly negative axial CTE, high specific stiffness and strength, pronounced anisotropy of electrical/thermal conduction, and compressive and shear response governed by fiber morphology and interfacial coupling.
Manufacture from PAN involves solution spinning (wet or dry-jet wet) of acrylonitrile copolymers to precursor fibers, oxidative stabilization in air (~200–300 °C) with cyclization and dehydrogenation to form a ladder polymer, high-temperature carbonization in inert atmosphere (~1000–1600 °C) to expel non-carbon elements, and optional graphitization (~2500–3000 °C) to raise modulus. Surface treatment—typically controlled electrochemical oxidation—creates oxygen-bearing functional groups that promote adhesion, after which a thin polymer sizing is applied and the tow is dried, wound, and qualified. Mesophase-pitch routes start from a liquid-crystalline pitch refined and melt-spun, followed by oxidative stabilization to lock in molecular orientation and extended carbonization/graphitization to achieve very high axial order; pitch-based fibers cover isotropic, intermediate, and high-modulus families, with the highest-modulus grades trading off compressive strain and handling robustness. Process controls address filament uniformity, defect and flaw population, tow flatness, residual twist, moisture and volatile content, surface oxygen level, and sizing weight, because these set translation efficiency into composite performance and dictate drape, tack, and consolidation in downstream layup.
Applications are centered on fiber-reinforced composites where axial properties are exploited through laminate architecture: primary and secondary structures in aircraft, spacecraft, and launch vehicles; wind-turbine spar caps and shells; Type III/IV pressure vessels for CNG/H₂; automotive body-in-white members, monocoques, and crash structures; sporting goods and instrumentation; civil engineering strengthening using plates, fabrics, and strands; marine hulls and masts; and electronics thermal-management elements and EMI/ESD structures. At higher temperatures carbon/carbon composites made from carbon fiber preforms densified with pyrolytic carbon serve in aircraft and industrial brakes, re-entry thermal protection, and furnace fixtures. Selection among PAN and pitch families, tow size, modulus class, and sizing chemistry is dictated by required stiffness, strength, damage tolerance, processing route, and operating environment, with laminate design and matrix choice determining compression, interlaminar, impact, and durability performance in service.
Fibre modulus, strength and sizing influence reinforcement selection. Tow architecture and resin compatibility affect processing and load transfer.
Fibre direction, volume fraction and defects determine the completed composite. Fibre properties cannot be applied directly to an isotropic finished part.
What turns activity into demand
Fibre demand follows qualified composite structures and their fibre content. Design certification, lay-up and manufacturing yield determine reachable volume; fibre, prepreg and finished components are successive value stages and must not be summed as independent demand.
The commercial boundary
Separate fibre mass from prepreg, cured composites and finished components.
Technical reading
Selected research
Market Analysis & Forecast
Global Carbon Fiber Market Analysis and Forecast 2026-2032
Market perspective
Carbon fiber is a continuous filamentary material of roughly 5–10 µm diameter whose composition is predominantly carbon (typically >92 % up to ≈99 %), arranged in a turbostratic graphitic microstructure where stacked graphene layers exhibit strong axial covalent bonding and weak transverse cohesion. Industrial grades derive mainly from polyacrylonitrile (PAN) or mesophase pitch precursors, with legacy rayon-based grades largely displaced; PAN-based fibers dominate high-strength applications, while mesophase-pitch fibers provide very high axial modulus and thermal conductivity. Fibers are supplied as tows designated by filament count (e.g., 1K–24K for aerospace, 24K–200K for industrial) and converted into prepregs, unidirectional tapes, woven/NCF fabrics, chopped or milled forms with a surface sizing compatible with thermoset epoxies, vinyl esters, polyesters, or high-temperature thermoplastics such as PEEK, PEKK, PPS, and PA. Typical properties span tensile strengths on the order of several gigapascals, axial tensile moduli from standard (~230 GPa) through intermediate (~300 GPa) to high and ultra-high (>350 GPa), densities near 1.75–1.95 g·cm⁻³, near-zero to slightly negative axial CTE, high specific stiffness and strength, pronounced anisotropy of electrical/thermal conduction, and compressive and shear response governed by fiber morphology and interfacial coupling.
Manufacture from PAN involves solution spinning (wet or dry-jet wet) of acrylonitrile copolymers to precursor fibers, oxidative stabilization in air (~200–300 °C) with cyclization and dehydrogenation to form a ladder polymer, high-temperature carbonization in inert atmosphere (~1000–1600 °C) to expel non-carbon elements, and optional graphitization (~2500–3000 °C) to raise modulus. Surface treatment—typically controlled electrochemical oxidation—creates oxygen-bearing functional groups that promote adhesion, after which a thin polymer sizing is applied and the tow is dried, wound, and qualified. Mesophase-pitch routes start from a liquid-crystalline pitch refined and melt-spun, followed by oxidative stabilization to lock in molecular orientation and extended carbonization/graphitization to achieve very high axial order; pitch-based fibers cover isotropic, intermediate, and high-modulus families, with the highest-modulus grades trading off compressive strain and handling robustness. Process controls address filament uniformity, defect and flaw population, tow flatness, residual twist, moisture and volatile content, surface oxygen level, and sizing weight, because these set translation efficiency into composite performance and dictate drape, tack, and consolidation in downstream layup.
Applications are centered on fiber-reinforced composites where axial properties are exploited through laminate architecture: primary and secondary structures in aircraft, spacecraft, and launch vehicles; wind-turbine spar caps and shells; Type III/IV pressure vessels for CNG/H₂; automotive body-in-white members, monocoques, and crash structures; sporting goods and instrumentation; civil engineering strengthening using plates, fabrics, and strands; marine hulls and masts; and electronics thermal-management elements and EMI/ESD structures. At higher temperatures carbon/carbon composites made from carbon fiber preforms densified with pyrolytic carbon serve in aircraft and industrial brakes, re-entry thermal protection, and furnace fixtures. Selection among PAN and pitch families, tow size, modulus class, and sizing chemistry is dictated by required stiffness, strength, damage tolerance, processing route, and operating environment, with laminate design and matrix choice determining compression, interlaminar, impact, and durability performance in service.
Read the full market overview
The global Carbon Fiber market is projected to grow from US$ million in 2026 to US$ million by 2032, at a Compound Annual Growth Rate (CAGR) of % during the forecast period.
Carbon Fiber's global sales reached XX (t) with a value of US$ XX Million, marking an change of XX% compared to the previous year. This performance has positioned Toray as the global sales leader, a title it has maintained for several consecutive years. Notably, Toray's performance in primary markets is also remarkable. In the Chinese market, sales were XX (t), a change of XX% from the previous year. In Europe, sales were XX (t), showing a year-on-year of XX%. In the US, sales were XX (t), a year-on-year change of XX%.
The major global manufacturers in the Carbon Fiber market include Toray, MCCFC, Teijin, Hexcel, Hyosung Advanced Materials, SGL Carbon, Formosa Plastics, DowAksa and Syensqo, etc. In 2025, the top three vendors accounted for approximately % of the revenue.
In terms of production side, this report researches the Carbon Fiber production, growth rate, market share by manufacturers and by region (region level and country level), from 2021 to 2026, and forecast to 2032.
In terms of consumption side, this report focuses on the sales of Carbon Fiber by region (region level and country level), by Company, by Type and by Application. from 2021 to 2026 and forecast to 2032.
This report presents an overview of global market for Carbon Fiber, capacity, output, revenue and price. Analyses of the global market trends, with historic market revenue or sales data for 2021 - 2025, estimates for 2026, and projections of CAGR through 2032.
This report researches the key producers of Carbon Fiber, also provides the consumption of main regions and countries. Of the upcoming market potential for Carbon Fiber, and key regions or countries of focus to forecast this market into various segments and sub-segments. Country specific data and market value analysis for the U.S., Canada, Mexico, Brazil, China, Japan, South Korea, Southeast Asia, India, Germany, the U.K., Italy, Middle East, Africa, and Other Countries.
This report focuses on the Carbon Fiber sales, revenue, market share and industry ranking of main manufacturers, data from 2021 to 2026. Identification of the major stakeholders in the global Carbon Fiber market, and analysis of their competitive landscape and market positioning based on recent developments and segmental revenues. This report will help stakeholders to understand the competitive landscape and gain more insights and position their businesses and market strategies in a better way.
This report analyzes the segments data by Type and by Application, sales, revenue, and price, from 2021 to 2032. Evaluation and forecast the market size for Carbon Fiber sales, projected growth trends, production technology, application and end-user industry.
Carbon Fiber Segment by Company
Toray
MCCFC
Teijin
Hexcel
Hyosung Advanced Materials
SGL Carbon
Formosa Plastics
DowAksa
Syensqo
UMATEX
Taekwang Industrial
Zhongfu Shenying
Jilin Chemical Fiber
Baowu Carbon
Weihai Guangwei Composites
Sinofibers Technology
Jiangsu Hengshen
Newtech Group
Carbon Fiber Segment by Type
Regular-Tow Carbon Fiber
Large-Tow Carbon Fiber
Carbon Fiber Segment by Application
Wind Energy
Sports/Leisure
Aerospace and Defense
Pressure Vessel
Automotive
Other
Carbon Fiber Segment by Region
North America
United States
Canada
Mexico
Europe
Germany
France
U.K.
Italy
Russia
Spain
Netherlands
Switzerland
Sweden
Poland
Asia-Pacific
China
Japan
South Korea
India
Australia
Taiwan
Southeast Asia
South America
Brazil
Argentina
Chile
Middle East & Africa
Egypt
South Africa
Israel
Türkiye
GCC Countries
Study Objectives
1. To analyze and research the global status and future forecast, involving, production, value, consumption, growth rate (CAGR), market share, historical and forecast.
2. To present the key manufacturers, capacity, production, revenue, market share, and Recent Developments.
3. To split the breakdown data by regions, type, manufacturers, and Application.
4. To analyze the global and key regions market potential and advantage, opportunity and challenge, restraints, and risks.
5. To identify significant trends, drivers, influence factors in global and regions.
6. To analyze competitive developments such as expansions, agreements, new product launches, and acquisitions in the market.
Reasons to Buy This Report
1. This report will help the readers to understand the competition within the industries and strategies for the competitive environment to enhance the potential profit. The report also focuses on the competitive landscape of the global Carbon Fiber market, and introduces in detail the market share, industry ranking, competitor ecosystem, market performance, new product development, operation situation, expansion, and acquisition. etc. of the main players, which helps the readers to identify the main competitors and deeply understand the competition pattern of the market.
2. This report will help stakeholders to understand the global industry status and trends of Carbon Fiber and provides them with information on key market drivers, restraints, challenges, and opportunities.
3. This report will help stakeholders to understand competitors better and gain more insights to strengthen their position in their businesses. The competitive landscape section includes the market share and rank (in volume and value), competitor ecosystem, new product development, expansion, and acquisition.
4. This report stays updated with novel technology integration, features, and the latest developments in the market.
5. This report helps stakeholders to gain insights into which regions to target globally.
6. This report helps stakeholders to gain insights into the end-user perception concerning the adoption of Carbon Fiber.
7. This report helps stakeholders to identify some of the key players in the market and understand their valuable contribution.
Chapter Outline
Chapter 1: Introduces the report scope of the report, executive summary of different market segments (by type and by application, etc), including the market size of each market segment, future development potential, and so on. It offers a high-level view of the current state of the market and its likely evolution in the short to mid-term, and long term.
Chapter 2: Introduces the market dynamics, latest developments of the market, the driving factors and restrictive factors of the market, the challenges and risks faced by manufacturers in the industry, and the analysis of relevant policies in the industry.
Chapter 3: Carbon Fiber production/output of global and key producers (regions/countries). It provides a quantitative analysis of the production, and development potential of each producer in the next six years.
Chapter 4: Sales (consumption), revenue of Carbon Fiber in global, regional level and country level. It provides a quantitative analysis of the market size and development potential of each region and its main countries and introduces the market development, future development prospects, market space of each country in the world.
Chapter 5: Detailed analysis of Carbon Fiber manufacturers competitive landscape, price, sales, revenue, market share and industry ranking, latest development plan, merger, and acquisition information, etc.
Chapter 6: Provides the analysis of various market segments by type, covering the sales, revenue, average price, and development potential of each market segment, to help readers find the blue ocean market in different market segments.
Chapter 7: Provides the analysis of various market segments by application, covering the sales, revenue, average price, and development potential of each market segment, to help readers find the blue ocean market in different downstream markets.
Chapter 8: Provides profiles of key manufacturers, introducing the basic situation of the main companies in the market in detail, including product descriptions and specifications, Carbon Fiber sales, revenue, price, gross margin, and recent development, etc.
Chapter 9: North America by type, by application and by country, sales, and revenue for each segment.
Chapter 10: Europe by type, by application and by country, sales, and revenue for each segment.
Chapter 11: China by type, by application, sales, and revenue for each segment.
Chapter 12: Asia (Excluding China) by type, by application and by region, sales, and revenue for each segment.
Chapter 13: South America, Middle East and Africa by type, by application and by country, sales, and revenue for each segment.
Chapter 14: Analysis of industrial chain, sales channel, key raw materials, distributors and customers.
Chapter 15: The main concluding insights of the report.
More report detail
Tables and figures
Scope & coverage.
Types
- Regular-Tow Carbon Fiber
- Large-Tow Carbon Fiber
Applications
- Wind Energy
- Sports/Leisure
- Aerospace and Defense
- Pressure Vessel
- Automotive
- Other
Companies covered
- Toray
- MCCFC
- Teijin
- Hexcel
- Hyosung Advanced Materials
- SGL Carbon
- Formosa Plastics
- DowAksa
- Syensqo
- UMATEX
- Taekwang Industrial
- Zhongfu Shenying
- Jilin Chemical Fiber
- Baowu Carbon
- Weihai Guangwei Composites
- Sinofibers Technology
- Jiangsu Hengshen
- Newtech Group
Inside the report.
1 Market Overview
- 1.1 Product Definition
- 1.2 Carbon Fiber Market by Type
- 1.2.1 Global Carbon Fiber Market Size by Type, 2021 VS 2025 VS 2032
- 1.2.2 Regular-Tow Carbon Fiber
- 1.2.3 Large-Tow Carbon Fiber
- 1.3 Carbon Fiber Market by Application
- 1.3.1 Global Carbon Fiber Market Size by Application, 2021 VS 2025 VS 2032
- 1.3.2 Wind Energy
- 1.3.3 Sports/Leisure
- 1.3.4 Aerospace and Defense
- 1.3.5 Pressure Vessel
- 1.3.6 Automotive
- 1.3.7 Other
- 1.4 Assumptions and Limitations
- 1.5 Study Goals and Objectives
2 Carbon Fiber Market Dynamics
- 2.1 Carbon Fiber Industry Trends
- 2.2 Carbon Fiber Industry Drivers
- 2.3 Carbon Fiber Industry Opportunities and Challenges
- 2.4 Carbon Fiber Industry Restraints
3 Global Carbon Fiber Production Overview
- 3.1 Global Carbon Fiber Production Capacity (2021-2032)
- 3.2 Global Carbon Fiber Production by Region: 2021 VS 2025 VS 2032
- 3.3 Global Carbon Fiber Production by Region
- 3.3.1 Global Carbon Fiber Production by Region (2021-2026)
- 3.3.2 Global Carbon Fiber Production by Region (2027-2032)
- 3.3.3 Global Carbon Fiber Production Market Share by Region (2021-2032)
- 3.4 North America
- 3.5 Europe
- 3.6 China
- 3.7 Japan
4 Global Market Growth Prospects
- 4.1 Global Carbon Fiber Revenue Estimates and Forecasts (2021-2032)
- 4.2 Global Carbon Fiber Revenue by Region
- 4.2.1 Global Carbon Fiber Revenue by Region: 2021 VS 2025 VS 2032
- 4.2.2 Global Carbon Fiber Revenue by Region (2021-2026)
- 4.2.3 Global Carbon Fiber Revenue by Region (2027-2032)
- 4.2.4 Global Carbon Fiber Revenue Market Share by Region (2021-2032)
- 4.3 Global Carbon Fiber Sales Estimates and Forecasts 2021-2032
- 4.4 Global Carbon Fiber Sales by Region
- 4.4.1 Global Carbon Fiber Sales by Region: 2021 VS 2025 VS 2032
- 4.4.2 Global Carbon Fiber Sales by Region (2021-2026)
- 4.4.3 Global Carbon Fiber Sales by Region (2027-2032)
- 4.4.4 Global Carbon Fiber Sales Market Share by Region (2021-2032)
- 4.5 North America
- 4.6 Europe
- 4.7 China
- 4.8 Asia (Excluding China)
- 4.9 South America, Middle East and Africa
5 Market Competitive Landscape by Manufacturers
- 5.1 Global Carbon Fiber Revenue by Manufacturers
- 5.1.1 Global Carbon Fiber Revenue by Manufacturers (2021-2026)
- 5.1.2 Global Carbon Fiber Revenue Market Share by Manufacturers (2021-2026)
- 5.1.3 Global Carbon Fiber Manufacturers Revenue Share Top 10 and Top 5 in 2025
- 5.2 Global Carbon Fiber Sales by Manufacturers
- 5.2.1 Global Carbon Fiber Sales by Manufacturers (2021-2026)
- 5.2.2 Global Carbon Fiber Sales Market Share by Manufacturers (2021-2026)
- 5.2.3 Global Carbon Fiber Manufacturers Sales Share Top 10 and Top 5 in 2025
- 5.3 Global Carbon Fiber Sales Price by Manufacturers (2021-2026)
- 5.4 Global Carbon Fiber Key Manufacturers Ranking, 2024 VS 2025 VS 2026
- 5.5 Global Carbon Fiber Key Manufacturers Manufacturing Sites & Headquarters
- 5.6 Global Carbon Fiber Manufacturers, Product Type & Application
- 5.7 Global Carbon Fiber Manufacturers Commercialization Time
- 5.8 Market Competitive Analysis
- 5.8.1 Global Carbon Fiber Market CR5 and HHI
- 5.8.2 2025 Carbon Fiber Tier 1, Tier 2, and Tier 3
6 Carbon Fiber Market by Type
- 6.1 Global Carbon Fiber Revenue by Type
- 6.1.1 Global Carbon Fiber Revenue by Type (2021-2032) & (US$ Million)
- 6.1.2 Global Carbon Fiber Revenue Market Share by Type (2021-2032)
- 6.2 Global Carbon Fiber Sales by Type
- 6.2.1 Global Carbon Fiber Sales by Type (2021-2032) & (t)
- 6.2.2 Global Carbon Fiber Sales Market Share by Type (2021-2032)
- 6.3 Global Carbon Fiber Price by Type
7 Carbon Fiber Market by Application
- 7.1 Global Carbon Fiber Revenue by Application
- 7.1.1 Global Carbon Fiber Revenue by Application (2021-2032) & (US$ Million)
- 7.1.2 Global Carbon Fiber Revenue Market Share by Application (2021-2032)
- 7.2 Global Carbon Fiber Sales by Application
- 7.2.1 Global Carbon Fiber Sales by Application (2021-2032) & (t)
- 7.2.2 Global Carbon Fiber Sales Market Share by Application (2021-2032)
- 7.3 Global Carbon Fiber Price by Application
8 Company Profiles
- 8.1 Toray
- 8.1.1 Toray Company Information
- 8.1.2 Toray Business Overview
- 8.1.3 Toray Carbon Fiber Sales, Revenue, Price and Gross Margin (2021-2026)
- 8.1.4 Toray Carbon Fiber Product Portfolio
- 8.1.5 Toray Recent Developments
- 8.2 MCCFC
- 8.2.1 MCCFC Company Information
- 8.2.2 MCCFC Business Overview
- 8.2.3 MCCFC Carbon Fiber Sales, Revenue, Price and Gross Margin (2021-2026)
- 8.2.4 MCCFC Carbon Fiber Product Portfolio
- 8.2.5 MCCFC Recent Developments
- 8.3 Teijin
- 8.3.1 Teijin Company Information
- 8.3.2 Teijin Business Overview
- 8.3.3 Teijin Carbon Fiber Sales, Revenue, Price and Gross Margin (2021-2026)
- 8.3.4 Teijin Carbon Fiber Product Portfolio
- 8.3.5 Teijin Recent Developments
- 8.4 Hexcel
- 8.4.1 Hexcel Company Information
- 8.4.2 Hexcel Business Overview
- 8.4.3 Hexcel Carbon Fiber Sales, Revenue, Price and Gross Margin (2021-2026)
- 8.4.4 Hexcel Carbon Fiber Product Portfolio
- 8.4.5 Hexcel Recent Developments
- 8.5 Hyosung Advanced Materials
- 8.5.1 Hyosung Advanced Materials Company Information
- 8.5.2 Hyosung Advanced Materials Business Overview
- 8.5.3 Hyosung Advanced Materials Carbon Fiber Sales, Revenue, Price and Gross Margin (2021-2026)
- 8.5.4 Hyosung Advanced Materials Carbon Fiber Product Portfolio
- 8.5.5 Hyosung Advanced Materials Recent Developments
- 8.6 SGL Carbon
- 8.6.1 SGL Carbon Company Information
- 8.6.2 SGL Carbon Business Overview
- 8.6.3 SGL Carbon Carbon Fiber Sales, Revenue, Price and Gross Margin (2021-2026)
- 8.6.4 SGL Carbon Carbon Fiber Product Portfolio
- 8.6.5 SGL Carbon Recent Developments
- 8.7 Formosa Plastics
- 8.7.1 Formosa Plastics Company Information
- 8.7.2 Formosa Plastics Business Overview
- 8.7.3 Formosa Plastics Carbon Fiber Sales, Revenue, Price and Gross Margin (2021-2026)
- 8.7.4 Formosa Plastics Carbon Fiber Product Portfolio
- 8.7.5 Formosa Plastics Recent Developments
- 8.8 DowAksa
- 8.8.1 DowAksa Company Information
- 8.8.2 DowAksa Business Overview
- 8.8.3 DowAksa Carbon Fiber Sales, Revenue, Price and Gross Margin (2021-2026)
- 8.8.4 DowAksa Carbon Fiber Product Portfolio
- 8.8.5 DowAksa Recent Developments
- 8.9 Syensqo
- 8.9.1 Syensqo Company Information
- 8.9.2 Syensqo Business Overview
- 8.9.3 Syensqo Carbon Fiber Sales, Revenue, Price and Gross Margin (2021-2026)
- 8.9.4 Syensqo Carbon Fiber Product Portfolio
- 8.9.5 Syensqo Recent Developments
- 8.10 UMATEX
- 8.10.1 UMATEX Company Information
- 8.10.2 UMATEX Business Overview
- 8.10.3 UMATEX Carbon Fiber Sales, Revenue, Price and Gross Margin (2021-2026)
- 8.10.4 UMATEX Carbon Fiber Product Portfolio
- 8.10.5 UMATEX Recent Developments
- 8.11 Taekwang Industrial
- 8.11.1 Taekwang Industrial Company Information
- 8.11.2 Taekwang Industrial Business Overview
- 8.11.3 Taekwang Industrial Carbon Fiber Sales, Revenue, Price and Gross Margin (2021-2026)
- 8.11.4 Taekwang Industrial Carbon Fiber Product Portfolio
- 8.11.5 Taekwang Industrial Recent Developments
- 8.12 Zhongfu Shenying
- 8.12.1 Zhongfu Shenying Company Information
- 8.12.2 Zhongfu Shenying Business Overview
- 8.12.3 Zhongfu Shenying Carbon Fiber Sales, Revenue, Price and Gross Margin (2021-2026)
- 8.12.4 Zhongfu Shenying Carbon Fiber Product Portfolio
- 8.12.5 Zhongfu Shenying Recent Developments
- 8.13 Jilin Chemical Fiber
- 8.13.1 Jilin Chemical Fiber Company Information
- 8.13.2 Jilin Chemical Fiber Business Overview
- 8.13.3 Jilin Chemical Fiber Carbon Fiber Sales, Revenue, Price and Gross Margin (2021-2026)
- 8.13.4 Jilin Chemical Fiber Carbon Fiber Product Portfolio
- 8.13.5 Jilin Chemical Fiber Recent Developments
- 8.14 Baowu Carbon
- 8.14.1 Baowu Carbon Company Information
- 8.14.2 Baowu Carbon Business Overview
- 8.14.3 Baowu Carbon Carbon Fiber Sales, Revenue, Price and Gross Margin (2021-2026)
- 8.14.4 Baowu Carbon Carbon Fiber Product Portfolio
- 8.14.5 Baowu Carbon Recent Developments
- 8.15 Weihai Guangwei Composites
- 8.15.1 Weihai Guangwei Composites Company Information
- 8.15.2 Weihai Guangwei Composites Business Overview
- 8.15.3 Weihai Guangwei Composites Carbon Fiber Sales, Revenue, Price and Gross Margin (2021-2026)
- 8.15.4 Weihai Guangwei Composites Carbon Fiber Product Portfolio
- 8.15.5 Weihai Guangwei Composites Recent Developments
- 8.16 Sinofibers Technology
- 8.16.1 Sinofibers Technology Company Information
- 8.16.2 Sinofibers Technology Business Overview
- 8.16.3 Sinofibers Technology Carbon Fiber Sales, Revenue, Price and Gross Margin (2021-2026)
- 8.16.4 Sinofibers Technology Carbon Fiber Product Portfolio
- 8.16.5 Sinofibers Technology Recent Developments
- 8.17 Jiangsu Hengshen
- 8.17.1 Jiangsu Hengshen Company Information
- 8.17.2 Jiangsu Hengshen Business Overview
- 8.17.3 Jiangsu Hengshen Carbon Fiber Sales, Revenue, Price and Gross Margin (2021-2026)
- 8.17.4 Jiangsu Hengshen Carbon Fiber Product Portfolio
- 8.17.5 Jiangsu Hengshen Recent Developments
- 8.18 Newtech Group
- 8.18.1 Newtech Group Company Information
- 8.18.2 Newtech Group Business Overview
- 8.18.3 Newtech Group Carbon Fiber Sales, Revenue, Price and Gross Margin (2021-2026)
- 8.18.4 Newtech Group Carbon Fiber Product Portfolio
- 8.18.5 Newtech Group Recent Developments
9 North America
- 9.1 North America Carbon Fiber Market Size by Type
- 9.1.1 North America Carbon Fiber Revenue by Type (2021-2032)
- 9.1.2 North America Carbon Fiber Sales by Type (2021-2032)
- 9.1.3 North America Carbon Fiber Price by Type (2021-2032)
- 9.2 North America Carbon Fiber Market Size by Application
- 9.2.1 North America Carbon Fiber Revenue by Application (2021-2032)
- 9.2.2 North America Carbon Fiber Sales by Application (2021-2032)
- 9.2.3 North America Carbon Fiber Price by Application (2021-2032)
- 9.3 North America Carbon Fiber Market Size by Country
- 9.3.1 North America Carbon Fiber Revenue Grow Rate by Country (2021 VS 2025 VS 2032)
- 9.3.2 North America Carbon Fiber Sales by Country (2021 VS 2025 VS 2032)
- 9.3.3 North America Carbon Fiber Price by Country (2021-2032)
- 9.3.4 United States
- 9.3.5 Canada
- 9.3.6 Mexico
10 Europe
- 10.1 Europe Carbon Fiber Market Size by Type
- 10.1.1 Europe Carbon Fiber Revenue by Type (2021-2032)
- 10.1.2 Europe Carbon Fiber Sales by Type (2021-2032)
- 10.1.3 Europe Carbon Fiber Price by Type (2021-2032)
- 10.2 Europe Carbon Fiber Market Size by Application
- 10.2.1 Europe Carbon Fiber Revenue by Application (2021-2032)
- 10.2.2 Europe Carbon Fiber Sales by Application (2021-2032)
- 10.2.3 Europe Carbon Fiber Price by Application (2021-2032)
- 10.3 Europe Carbon Fiber Market Size by Country
- 10.3.1 Europe Carbon Fiber Revenue Grow Rate by Country (2021 VS 2025 VS 2032)
- 10.3.2 Europe Carbon Fiber Sales by Country (2021 VS 2025 VS 2032)
- 10.3.3 Europe Carbon Fiber Price by Country (2021-2032)
- 10.3.4 Germany
- 10.3.5 France
- 10.3.6 U.K.
- 10.3.7 Italy
- 10.3.8 Russia
- 10.3.9 Spain
- 10.3.10 Netherlands
- 10.3.11 Switzerland
- 10.3.12 Sweden
11 China
- 11.1 China Carbon Fiber Market Size by Type
- 11.1.1 China Carbon Fiber Revenue by Type (2021-2032)
- 11.1.2 China Carbon Fiber Sales by Type (2021-2032)
- 11.1.3 China Carbon Fiber Price by Type (2021-2032)
- 11.2 China Carbon Fiber Market Size by Application
- 11.2.1 China Carbon Fiber Revenue by Application (2021-2032)
- 11.2.2 China Carbon Fiber Sales by Application (2021-2032)
- 11.2.3 China Carbon Fiber Price by Application (2021-2032)
12 Asia (Excluding China)
- 12.1 Asia Carbon Fiber Market Size by Type
- 12.1.1 Asia Carbon Fiber Revenue by Type (2021-2032)
- 12.1.2 Asia Carbon Fiber Sales by Type (2021-2032)
- 12.1.3 Asia Carbon Fiber Price by Type (2021-2032)
- 12.2 Asia Carbon Fiber Market Size by Application
- 12.2.1 Asia Carbon Fiber Revenue by Application (2021-2032)
- 12.2.2 Asia Carbon Fiber Sales by Application (2021-2032)
- 12.2.3 Asia Carbon Fiber Price by Application (2021-2032)
- 12.3 Asia Carbon Fiber Market Size by Country
- 12.3.1 Asia Carbon Fiber Revenue Grow Rate by Country (2021 VS 2025 VS 2032)
- 12.3.2 Asia Carbon Fiber Sales by Country (2021 VS 2025 VS 2032)
- 12.3.3 Asia Carbon Fiber Price by Country (2021-2032)
- 12.3.4 Japan
- 12.3.5 South Korea
- 12.3.6 India
- 12.3.7 Australia
- 12.3.8 Taiwan
- 12.3.9 Southeast Asia
13 South America, Middle East and Africa
- 13.1 SAMEA Carbon Fiber Market Size by Type
- 13.1.1 SAMEA Carbon Fiber Revenue by Type (2021-2032)
- 13.1.2 SAMEA Carbon Fiber Sales by Type (2021-2032)
- 13.1.3 SAMEA Carbon Fiber Price by Type (2021-2032)
- 13.2 SAMEA Carbon Fiber Market Size by Application
- 13.2.1 SAMEA Carbon Fiber Revenue by Application (2021-2032)
- 13.2.2 SAMEA Carbon Fiber Sales by Application (2021-2032)
- 13.2.3 SAMEA Carbon Fiber Price by Application (2021-2032)
- 13.3 SAMEA Carbon Fiber Market Size by Country
- 13.3.1 SAMEA Carbon Fiber Revenue Grow Rate by Country (2021 VS 2025 VS 2032)
- 13.3.2 SAMEA Carbon Fiber Sales by Country (2021 VS 2025 VS 2032)
- 13.3.3 SAMEA Carbon Fiber Price by Country (2021-2032)
- 13.3.4 Brazil
- 13.3.5 Argentina
- 13.3.6 Chile
- 13.3.7 Colombia
- 13.3.8 Peru
- 13.3.9 Saudi Arabia
- 13.3.10 Israel
- 13.3.11 UAE
- 13.3.12 Turkey
- 13.3.13 Iran
- 13.3.14 Egypt
14 Value Chain and Sales Channels Analysis
- 14.1 Carbon Fiber Value Chain Analysis
- 14.1.1 Carbon Fiber Key Raw Materials
- 14.1.2 Raw Materials Key Suppliers
- 14.1.3 Manufacturing Cost Structure
- 14.1.4 Carbon Fiber Production Mode & Process
- 14.2 Carbon Fiber Sales Channels Analysis
- 14.2.1 Direct Comparison with Distribution Share
- 14.2.2 Carbon Fiber Distributors
- 14.2.3 Carbon Fiber Customers
15 Concluding Insights
16 Appendix
- 16.1 Reasons for Doing This Study
- 16.2 Research Methodology
- 16.3 Research Process
- 16.4 Authors List of This Report
- 16.5 Data Source
- 16.5.1 Secondary Sources
- 16.5.2 Primary Sources
- 16.6 Disclaimer
GET THE RESEARCH
Choose your license.
Choose who needs access.
All options are for this report and research series.
PDF by email within 3–5 working days after payment confirmation.
Talk to an analyst