
APO RESEARCH · REPORT
Radiotherapy
Radiotherapy (Radiation Therapy) is a method of treating cancer. It is divided into External Beam Radiotherapy, also known as teleradiation therapy and Internal Beam Radiotherapy, also known as brachytherapy.
Product & engineering
Understand the product.
Radiotherapy (Radiation Therapy) is a method of treating cancer. It is divided into External Beam Radiotherapy, also known as teleradiation therapy and Internal Beam Radiotherapy, also known as brachytherapy. The principle is to use high-energy ionizing radiation (such as X-rays, gamma rays, high-energy electrons or heavy particles) produced by Medical Electron Linear Accelerator or radioactive nuclei to control or destroy malignant cells. Radiation therapy can cure some cancers that are only present in specific parts of the body, and can also be used as adjuvant therapy to prevent the recurrence of tumors after surgery to remove the primary malignant tumor (for example, to treat early-stage breast cancer). Ionizing radiation can damage the DNA of cancer tissue, causing its cells to die. In order to leave normal tissues (such as skin or organs, through which radiation must pass to treat tumors) unaffected, the radiation beam will illuminate the cancerous tissue from several specific angles. Tumors produce a much greater absorbed dose than surrounding healthy tissue. In addition to the tumor itself, the radiation field may also include draining lymph nodes if they are clinically or radiologically associated with malignancy or are considered to be at risk for subclinical malignant spread. Either way, the cells are killed by destroying the genetic material (DNA) of malignant cells. Cancer cells whose DNA is damaged and cannot be repaired will stop dividing or die. When damaged cells die, they are broken down and eliminated by the body. Radiation therapy does not kill cancer cells immediately; the level of DNA damage that causes cancer cell death requires days or weeks of treatment.
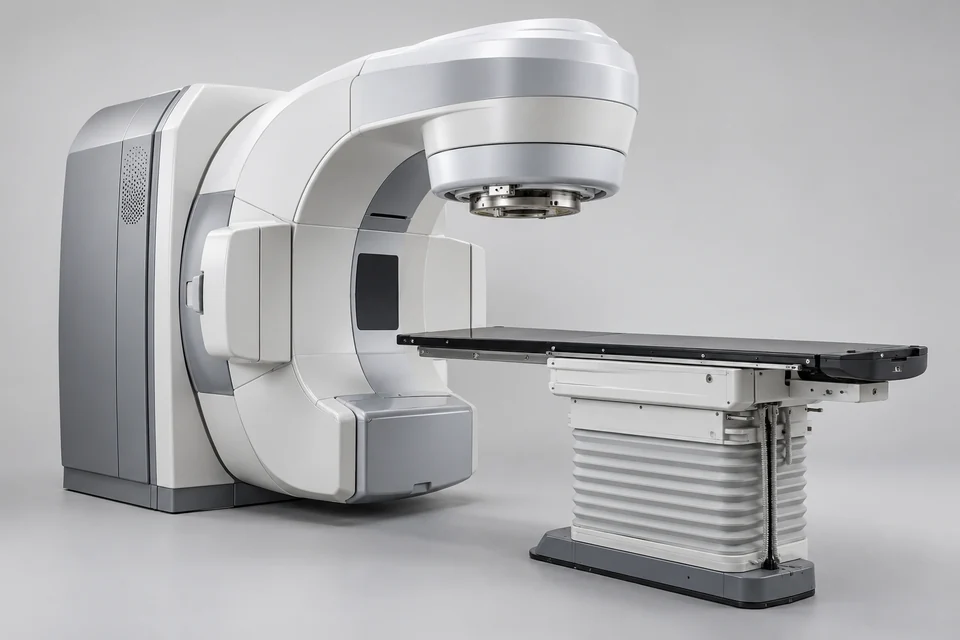
Radiotherapy equipment is an important treatment tool in current tumor treatment, including Medical Electron Linear Accelerator, Gamma Knife, Cyberknife, TomoTherapy, proton and heavy ion equipment, etc., among which the global The most commonly used one is the Medical Electron Linear Accelerator. Medical Electron Linear Accelerator is usually used clinically to define and plan the treatment target area based on CT images, and to give the target area a certain dose of uniform irradiation. In radiotherapy, target volume delineation, measurement prescription design, and radiotherapy plan design can all directly affect the effect of radiotherapy. However, because delineation and design work rely on technicians and radiotherapy doctors, there are many uncertainties. The positioning error is one of the important factors affecting the accuracy of radiotherapy. In addition, there are many factors that cause positioning and imaging differences during the entire radiotherapy process for patients, making it difficult for the entire radiotherapy effect to fully achieve the intended goal.
Proton and heavy particle therapy are another modality. Proton therapy, also known as "proton knife", uses neutral uncharged particles (such as neutrons) or charged particles (such as protons) to enter the human body and release energy to kill tumor cells. Currently, protons and Carbon ions. The entire treatment process can provide powerful irradiation to tumor lesions while avoiding irradiation of normal tissues to maximize the curative effect. Proton radiotherapy is currently the most cutting-edge cancer treatment technology. In the world of cancer treatment, heavy ions are another word for carbon ions (C6+). It is said that the dose concentration of heavy ions is better than that of protons, and the killing effect on cancer cells is 2-3 times that of protons. This effect can reduce the number of fractions and shorten the treatment cycle. Heavy ion therapy is also expected to be effective in treating cancers that are resistant to conventional X-ray radiation therapy, such as sarcomas and adenocarcinomas, locally advanced cancers, and deep-seated cancers. Broadly speaking, a heavy ion beam includes any beam of particles heavier than electrons. In heavy ion radiation therapy in Japan, the term "heavy ion beam" refers to a beam of nuclei (heavy ions) of any atom heavier than helium (He) or with an atomic number greater than helium. In Japan, carbon ion beams have been used for heavy ion beam therapy for nearly 20 years. Therefore, "heavy ion beam" currently refers to "carbon ion beam".
The research object may be an ingredient, device, preparation or care service. These supply stages have different specifications and measurement units; an ingredient identity or device name does not establish a clinical outcome.
What turns activity into demand
Qualified use at the specified treatment or instrument boundary creates purchases through protocol, utilisation and replacement. A product, clinical service and complete care episode measure different supplied objects.
The commercial boundary
For Radiotherapy, distinguish the supplied product from its inputs and the complete application. Report types and applications may overlap; retain the selected edition's product definition, geography, period, unit and transaction basis when comparing estimates.
Which conditions determine usable radiotherapy performance?
Radiotherapy (Radiation Therapy) is a method of treating cancer. It is divided into External Beam Radiotherapy, also known as teleradiation therapy and Internal Beam Radiotherapy, also known as brachytherapy. Confirm the specified composition or device function, intended use and supplied unit. Separate ingredients, finished preparations, equipment and treatment activity before comparing quantities or revenue; use the report scope rather than inferring efficacy from an illustration.
Selected research
Industry Growth & Trends
Global Radiotherapy Industry Growth and Trends Forecast to 2032
Market perspective
Radiotherapy (Radiation Therapy) is a method of treating cancer. It is divided into External Beam Radiotherapy, also known as teleradiation therapy and Internal Beam Radiotherapy, also known as brachytherapy. The principle is to use high-energy ionizing radiation (such as X-rays, gamma rays, high-energy electrons or heavy particles) produced by Medical Electron Linear Accelerator or radioactive nuclei to control or destroy malignant cells. Radiation therapy can cure some cancers that are only present in specific parts of the body, and can also be used as adjuvant therapy to prevent the recurrence of tumors after surgery to remove the primary malignant tumor (for example, to treat early-stage breast cancer). Ionizing radiation can damage the DNA of cancer tissue, causing its cells to die. In order to leave normal tissues (such as skin or organs, through which radiation must pass to treat tumors) unaffected, the radiation beam will illuminate the cancerous tissue from several specific angles. Tumors produce a much greater absorbed dose than surrounding healthy tissue. In addition to the tumor itself, the radiation field may also include draining lymph nodes if they are clinically or radiologically associated with malignancy or are considered to be at risk for subclinical malignant spread. Either way, the cells are killed by destroying the genetic material (DNA) of malignant cells. Cancer cells whose DNA is damaged and cannot be repaired will stop dividing or die. When damaged cells die, they are broken down and eliminated by the body. Radiation therapy does not kill cancer cells immediately; the level of DNA damage that causes cancer cell death requires days or weeks of treatment.
Radiotherapy equipment is an important treatment tool in current tumor treatment, including Medical Electron Linear Accelerator, Gamma Knife, Cyberknife, TomoTherapy, proton and heavy ion equipment, etc., among which the global The most commonly used one is the Medical Electron Linear Accelerator. Medical Electron Linear Accelerator is usually used clinically to define and plan the treatment target area based on CT images, and to give the target area a certain dose of uniform irradiation. In radiotherapy, target volume delineation, measurement prescription design, and radiotherapy plan design can all directly affect the effect of radiotherapy. However, because delineation and design work rely on technicians and radiotherapy doctors, there are many uncertainties. The positioning error is one of the important factors affecting the accuracy of radiotherapy. In addition, there are many factors that cause positioning and imaging differences during the entire radiotherapy process for patients, making it difficult for the entire radiotherapy effect to fully achieve the intended goal.
Proton and heavy particle therapy are another modality. Proton therapy, also known as "proton knife", uses neutral uncharged particles (such as neutrons) or charged particles (such as protons) to enter the human body and release energy to kill tumor cells. Currently, protons and Carbon ions. The entire treatment process can provide powerful irradiation to tumor lesions while avoiding irradiation of normal tissues to maximize the curative effect. Proton radiotherapy is currently the most cutting-edge cancer treatment technology. In the world of cancer treatment, heavy ions are another word for carbon ions (C6+). It is said that the dose concentration of heavy ions is better than that of protons, and the killing effect on cancer cells is 2-3 times that of protons. This effect can reduce the number of fractions and shorten the treatment cycle. Heavy ion therapy is also expected to be effective in treating cancers that are resistant to conventional X-ray radiation therapy, such as sarcomas and adenocarcinomas, locally advanced cancers, and deep-seated cancers. Broadly speaking, a heavy ion beam includes any beam of particles heavier than electrons. In heavy ion radiation therapy in Japan, the term "heavy ion beam" refers to a beam of nuclei (heavy ions) of any atom heavier than helium (He) or with an atomic number greater than helium. In Japan, carbon ion beams have been used for heavy ion beam therapy for nearly 20 years. Therefore, "heavy ion beam" currently refers to "carbon ion beam".
Read the full market overview
The global Radiotherapy market was valued at US$ million in 2026 and is projected to reach US$ million by 2032, implying a CAGR of xx% over 2026-2032.
The North America market for Radiotherapy is projected to increase from US$ million in 2026 to US$ million by 2032, corresponding to a CAGR of % over 2026-2032.
The Europe market for Radiotherapy is projected to increase from US$ million in 2026 to US$ million by 2032, registering a CAGR of % over 2026-2032.
The Asia Pacific market for Radiotherapy is projected to increase from US$ million in 2026 to US$ million by 2032, at a CAGR of % over 2026-2032.
Leading global manufacturers of Radiotherapy include Varian Medical Systems (Siemens Healthineers), Elekta, Hitachi, IBA(Ion Beam Applications S.A), Accuray, Mevion Medical Systems, Shanghai United Imaging Healthcare, Shinva Medical Instrument and Toshiba, among others. In 2025, the top three vendors together accounted for approximately % of global revenue.
Report Scope
This report provides a structured, data-driven view of the global Radiotherapy market, combining harmonized quantitative metrics with targeted qualitative insight to support business and growth strategy, market positioning, and capital allocation.
The Radiotherapy market size, estimates, and forecasts are presented in terms of sales volume (Units) and revenue (US$ million), with 2025 as the base year and historical and forecast data for 2021-2032. The report segments the global Radiotherapy market by Type, Application, region/country, and company, provides regional market sizes at the segment level, profiles the competitive landscape and key players and their market ranks, and reviews technology trends and new product developments relevant to Radiotherapy.
Key Companies & Market Share Insights
This section analyzes the strategies and performance of leading manufacturers in the global Radiotherapy market, including portfolio focus, innovation and product development, mergers and acquisitions, collaborations, and geographic expansion used to sustain or enhance competitive positions. It also summarizes recent corporate developments and key financial indicators and provides global revenue, price, and sales volume data by manufacturer for 2020-2025, enabling benchmarking of scale, pricing, and market share and supporting assessment of market concentration through indicators such as CR5 and CR10.
Radiotherapy Market by Company
Varian Medical Systems (Siemens Healthineers)
Elekta
Hitachi
IBA(Ion Beam Applications S.A)
Accuray
Mevion Medical Systems
Shanghai United Imaging Healthcare
Shinva Medical Instrument
Toshiba
Neusoft Medical Systems
Chengdu Linike Medical
Sumitomo Heavy Industries
Jiangsu Haiming Medical Equipment
SinoPower Accelerator
Radiotherapy Segment by Type
External Beam Radiotherapy
Internal Beam Radiotherapy
Radiotherapy Segment by Application
Lung Cancer
Breast Cancer
Rectal Cancer
Prostate Cancer
Stomach Cancer
Liver Cancer
Cervical Cancer
Lung Cancer
Head and Neck Cancer
Other
Radiotherapy Segment by Region
North America
United States
Canada
Mexico
Europe
Germany
France
U.K.
Italy
Russia
Spain
Netherlands
Switzerland
Sweden
Poland
Asia-Pacific
China
Japan
South Korea
India
Australia
Taiwan
Southeast Asia
South America
Brazil
Argentina
Chile
Colombia
Middle East & Africa
Egypt
South Africa
Israel
Türkiye
GCC Countries
Key Drivers & Barriers
High-impact rendering factors and drivers have been studied in this report to aid the readers to understand the general development. Moreover, the report includes restraints and challenges that may act as stumbling blocks on the way of the players. This will assist the users to be attentive and make informed decisions related to business. Specialists have also laid their focus on the upcoming business prospects.
Reasons to Buy This Report
1. This report will help the readers to understand the competition within the industries and strategies for the competitive environment to enhance the potential profit. The report also focuses on the competitive landscape of the global Radiotherapy market, and introduces in detail the market share, industry ranking, competitor ecosystem, market performance, new product development, operation situation, expansion, and acquisition. etc. of the main players, which helps the readers to identify the main competitors and deeply understand the competition pattern of the market.
2. This report will help stakeholders to understand the global industry status and trends of Radiotherapy and provides them with information on key market drivers, restraints, challenges, and opportunities.
3. This report will help stakeholders to understand competitors better and gain more insights to strengthen their position in their businesses. The competitive landscape section includes the market share and rank (in volume and value), competitor ecosystem, new product development, expansion, and acquisition.
4. This report stays updated with novel technology integration, features, and the latest developments in the market.
5. This report helps stakeholders to gain insights into which regions to target globally.
6. This report helps stakeholders to gain insights into the end-user perception concerning the adoption of Radiotherapy.
7. This report helps stakeholders to identify some of the key players in the market and understand their valuable contribution.
Chapter Outline
Chapter 1: Introduces the study scope of this report, executive summary of market segments by type, market size segments for North America, Europe, Asia Pacific, South America, Middle East & Africa.
Chapter 2: Introduces the market dynamics, latest developments of the market, the driving factors and restrictive factors of the market, the challenges and risks faced by manufacturers in the industry, and the analysis of relevant policies in the industry.
Chapter 3: Detailed analysis of Radiotherapy manufacturers competitive landscape, price, sales, revenue, market share and ranking, latest development plan, merger, and acquisition information, etc.
Chapter 4: Sales, revenue of Radiotherapy in regional level. It provides a quantitative analysis of the market size and development potential of each region and introduces the future development prospects, and market space in the world.
Chapter 5: Introduces market segments by application, market size segment for North America, Europe, Asia Pacific, South America, Middle East & Africa.
Chapter 6: Provides profiles of key players, introducing the basic situation of the main companies in the market in detail, including product sales, revenue, price, gross margin, product introduction, recent development, etc.
Chapter 7, 8, 9, 10 and 11: North America, Europe, Asia Pacific, South America, Middle East & Africa, sales and revenue by country.
Chapter 12: Analysis of industrial chain, key raw materials, manufacturing cost, and market dynamics.
Chapter 13: Concluding Insights of the report.
More report detail
Tables and figures
Scope & coverage.
Types
- External Beam Radiotherapy
- Internal Beam Radiotherapy
Applications
- Lung Cancer
- Breast Cancer
- Rectal Cancer
- Prostate Cancer
- Stomach Cancer
- Liver Cancer
- Cervical Cancer
- Lung Cancer
- Head and Neck Cancer
- Other
Companies covered
- Varian Medical Systems (Siemens Healthineers)
- Elekta
- Hitachi
- IBA(Ion Beam Applications S.A)
- Accuray
- Mevion Medical Systems
- Shanghai United Imaging Healthcare
- Shinva Medical Instrument
- Toshiba
- Neusoft Medical Systems
- Chengdu Linike Medical
- Sumitomo Heavy Industries
- Jiangsu Haiming Medical Equipment
- SinoPower Accelerator
Inside the report.
1 Market Overview
- 1.1 Product Definition
- 1.2 Global Market Growth Prospects
- 1.2.1 Global Radiotherapy Market Size Estimates and Forecasts (2021-2032)
- 1.2.2 Global Radiotherapy Sales Estimates and Forecasts (2021-2032)
- 1.3 Radiotherapy Market by Type
- 1.3.1 External Beam Radiotherapy
- 1.3.2 Internal Beam Radiotherapy
- 1.4 Global Radiotherapy Market Size by Type
- 1.4.1 Global Radiotherapy Market Size Overview by Type (2021-2032)
- 1.4.2 Global Radiotherapy Historic Market Size Review by Type (2021-2026)
- 1.4.3 Global Radiotherapy Forecasted Market Size by Type (2027-2032)
- 1.5 Key Regions Market Size by Type
- 1.5.1 North America Radiotherapy Sales Breakdown by Type (2021-2026)
- 1.5.2 Europe Radiotherapy Sales Breakdown by Type (2021-2026)
- 1.5.3 Asia-Pacific Radiotherapy Sales Breakdown by Type (2021-2026)
- 1.5.4 South America Radiotherapy Sales Breakdown by Type (2021-2026)
- 1.5.5 Middle East and Africa Radiotherapy Sales Breakdown by Type (2021-2026)
2 Global Market Dynamics
- 2.1 Radiotherapy Industry Trends
- 2.2 Radiotherapy Industry Drivers
- 2.3 Radiotherapy Industry Opportunities and Challenges
- 2.4 Radiotherapy Industry Restraints
3 Market Competitive Landscape by Company
- 3.1 Global Top Players by Radiotherapy Revenue (2021-2026)
- 3.2 Global Top Players by Radiotherapy Sales (2021-2026)
- 3.3 Global Top Players by Radiotherapy Price (2021-2026)
- 3.4 Global Radiotherapy Industry Company Ranking, 2024 VS 2025 VS 2026
- 3.5 Global Radiotherapy Major Company Production Sites & Headquarters
- 3.6 Global Radiotherapy Company, Product Type & Application
- 3.7 Global Radiotherapy Company Establishment Date
- 3.8 Market Competitive Analysis
- 3.8.1 Global Radiotherapy Market CR5 and HHI
- 3.8.2 Global Top 5 and 10 Radiotherapy Players Market Share by Revenue in 2025
- 3.8.3 2025 Radiotherapy Tier 1, Tier 2, and Tier 3
4 Radiotherapy Regional Status and Outlook
- 4.1 Global Radiotherapy Market Size and CAGR by Region: 2021 VS 2025 VS 2032
- 4.2 Global Radiotherapy Historic Market Size by Region
- 4.2.1 Global Radiotherapy Sales in Volume by Region (2021-2026)
- 4.2.2 Global Radiotherapy Sales in Value by Region (2021-2026)
- 4.2.3 Global Radiotherapy Sales (Volume & Value), Price and Gross Margin (2021-2026)
- 4.3 Global Radiotherapy Forecasted Market Size by Region
- 4.3.1 Global Radiotherapy Sales in Volume by Region (2027-2032)
- 4.3.2 Global Radiotherapy Sales in Value by Region (2027-2032)
- 4.3.3 Global Radiotherapy Sales (Volume & Value), Price and Gross Margin (2027-2032)
5 Radiotherapy by Application
- 5.1 Radiotherapy Market by Application
- 5.1.1 Lung Cancer
- 5.1.2 Breast Cancer
- 5.1.3 Rectal Cancer
- 5.1.4 Prostate Cancer
- 5.1.5 Stomach Cancer
- 5.1.6 Liver Cancer
- 5.1.7 Cervical Cancer
- 5.1.8 Lung Cancer
- 5.1.9 Head and Neck Cancer
- 5.1.10 Other
- 5.2 Global Radiotherapy Market Size by Application
- 5.2.1 Global Radiotherapy Market Size Overview by Application (2021-2032)
- 5.2.2 Global Radiotherapy Historic Market Size Review by Application (2021-2026)
- 5.2.3 Global Radiotherapy Forecasted Market Size by Application (2027-2032)
- 5.3 Key Regions Market Size by Application
- 5.3.1 North America Radiotherapy Sales Breakdown by Application (2021-2026)
- 5.3.2 Europe Radiotherapy Sales Breakdown by Application (2021-2026)
- 5.3.3 Asia-Pacific Radiotherapy Sales Breakdown by Application (2021-2026)
- 5.3.4 South America Radiotherapy Sales Breakdown by Application (2021-2026)
- 5.3.5 Middle East and Africa Radiotherapy Sales Breakdown by Application (2021-2026)
6 Company Profiles
- 6.1 Varian Medical Systems (Siemens Healthineers)
- 6.1.1 Varian Medical Systems (Siemens Healthineers) Company Information
- 6.1.2 Varian Medical Systems (Siemens Healthineers) Business Overview
- 6.1.3 Varian Medical Systems (Siemens Healthineers) Radiotherapy Sales, Revenue and Gross Margin (2021-2026)
- 6.1.4 Varian Medical Systems (Siemens Healthineers) Radiotherapy Product Portfolio
- 6.1.5 Varian Medical Systems (Siemens Healthineers) Recent Developments
- 6.2 Elekta
- 6.2.1 Elekta Company Information
- 6.2.2 Elekta Business Overview
- 6.2.3 Elekta Radiotherapy Sales, Revenue and Gross Margin (2021-2026)
- 6.2.4 Elekta Radiotherapy Product Portfolio
- 6.2.5 Elekta Recent Developments
- 6.3 Hitachi
- 6.3.1 Hitachi Company Information
- 6.3.2 Hitachi Business Overview
- 6.3.3 Hitachi Radiotherapy Sales, Revenue and Gross Margin (2021-2026)
- 6.3.4 Hitachi Radiotherapy Product Portfolio
- 6.3.5 Hitachi Recent Developments
- 6.4 IBA(Ion Beam Applications S.A)
- 6.4.1 IBA(Ion Beam Applications S.A) Company Information
- 6.4.2 IBA(Ion Beam Applications S.A) Business Overview
- 6.4.3 IBA(Ion Beam Applications S.A) Radiotherapy Sales, Revenue and Gross Margin (2021-2026)
- 6.4.4 IBA(Ion Beam Applications S.A) Radiotherapy Product Portfolio
- 6.4.5 IBA(Ion Beam Applications S.A) Recent Developments
- 6.5 Accuray
- 6.5.1 Accuray Company Information
- 6.5.2 Accuray Business Overview
- 6.5.3 Accuray Radiotherapy Sales, Revenue and Gross Margin (2021-2026)
- 6.5.4 Accuray Radiotherapy Product Portfolio
- 6.5.5 Accuray Recent Developments
- 6.6 Mevion Medical Systems
- 6.6.1 Mevion Medical Systems Company Information
- 6.6.2 Mevion Medical Systems Business Overview
- 6.6.3 Mevion Medical Systems Radiotherapy Sales, Revenue and Gross Margin (2021-2026)
- 6.6.4 Mevion Medical Systems Radiotherapy Product Portfolio
- 6.6.5 Mevion Medical Systems Recent Developments
- 6.7 Shanghai United Imaging Healthcare
- 6.7.1 Shanghai United Imaging Healthcare Company Information
- 6.7.2 Shanghai United Imaging Healthcare Business Overview
- 6.7.3 Shanghai United Imaging Healthcare Radiotherapy Sales, Revenue and Gross Margin (2021-2026)
- 6.7.4 Shanghai United Imaging Healthcare Radiotherapy Product Portfolio
- 6.7.5 Shanghai United Imaging Healthcare Recent Developments
- 6.8 Shinva Medical Instrument
- 6.8.1 Shinva Medical Instrument Company Information
- 6.8.2 Shinva Medical Instrument Business Overview
- 6.8.3 Shinva Medical Instrument Radiotherapy Sales, Revenue and Gross Margin (2021-2026)
- 6.8.4 Shinva Medical Instrument Radiotherapy Product Portfolio
- 6.8.5 Shinva Medical Instrument Recent Developments
- 6.9 Toshiba
- 6.9.1 Toshiba Company Information
- 6.9.2 Toshiba Business Overview
- 6.9.3 Toshiba Radiotherapy Sales, Revenue and Gross Margin (2021-2026)
- 6.9.4 Toshiba Radiotherapy Product Portfolio
- 6.9.5 Toshiba Recent Developments
- 6.10 Neusoft Medical Systems
- 6.10.1 Neusoft Medical Systems Company Information
- 6.10.2 Neusoft Medical Systems Business Overview
- 6.10.3 Neusoft Medical Systems Radiotherapy Sales, Revenue and Gross Margin (2021-2026)
- 6.10.4 Neusoft Medical Systems Radiotherapy Product Portfolio
- 6.10.5 Neusoft Medical Systems Recent Developments
- 6.11 Chengdu Linike Medical
- 6.11.1 Chengdu Linike Medical Company Information
- 6.11.2 Chengdu Linike Medical Business Overview
- 6.11.3 Chengdu Linike Medical Radiotherapy Sales, Revenue and Gross Margin (2021-2026)
- 6.11.4 Chengdu Linike Medical Radiotherapy Product Portfolio
- 6.11.5 Chengdu Linike Medical Recent Developments
- 6.12 Sumitomo Heavy Industries
- 6.12.1 Sumitomo Heavy Industries Company Information
- 6.12.2 Sumitomo Heavy Industries Business Overview
- 6.12.3 Sumitomo Heavy Industries Radiotherapy Sales, Revenue and Gross Margin (2021-2026)
- 6.12.4 Sumitomo Heavy Industries Radiotherapy Product Portfolio
- 6.12.5 Sumitomo Heavy Industries Recent Developments
- 6.13 Jiangsu Haiming Medical Equipment
- 6.13.1 Jiangsu Haiming Medical Equipment Company Information
- 6.13.2 Jiangsu Haiming Medical Equipment Business Overview
- 6.13.3 Jiangsu Haiming Medical Equipment Radiotherapy Sales, Revenue and Gross Margin (2021-2026)
- 6.13.4 Jiangsu Haiming Medical Equipment Radiotherapy Product Portfolio
- 6.13.5 Jiangsu Haiming Medical Equipment Recent Developments
- 6.14 SinoPower Accelerator
- 6.14.1 SinoPower Accelerator Company Information
- 6.14.2 SinoPower Accelerator Business Overview
- 6.14.3 SinoPower Accelerator Radiotherapy Sales, Revenue and Gross Margin (2021-2026)
- 6.14.4 SinoPower Accelerator Radiotherapy Product Portfolio
- 6.14.5 SinoPower Accelerator Recent Developments
7 North America by Country
- 7.1 North America Radiotherapy Sales by Country
- 7.1.1 North America Radiotherapy Sales Growth Rate (CAGR) by Country: 2021 VS 2025 VS 2032
- 7.1.2 North America Radiotherapy Sales by Country (2021-2026)
- 7.1.3 North America Radiotherapy Sales Forecast by Country (2027-2032)
- 7.2 North America Radiotherapy Market Size by Country
- 7.2.1 North America Radiotherapy Market Size Growth Rate (CAGR) by Country: 2021 VS 2025 VS 2032
- 7.2.2 North America Radiotherapy Market Size by Country (2021-2026)
- 7.2.3 North America Radiotherapy Market Size Forecast by Country (2027-2032)
8 Europe by Country
- 8.1 Europe Radiotherapy Sales by Country
- 8.1.1 Europe Radiotherapy Sales Growth Rate (CAGR) by Country: 2021 VS 2025 VS 2032
- 8.1.2 Europe Radiotherapy Sales by Country (2021-2026)
- 8.1.3 Europe Radiotherapy Sales Forecast by Country (2027-2032)
- 8.2 Europe Radiotherapy Market Size by Country
- 8.2.1 Europe Radiotherapy Market Size Growth Rate (CAGR) by Country: 2021 VS 2025 VS 2032
- 8.2.2 Europe Radiotherapy Market Size by Country (2021-2026)
- 8.2.3 Europe Radiotherapy Market Size Forecast by Country (2027-2032)
9 Asia-Pacific by Country
- 9.1 Asia-Pacific Radiotherapy Sales by Country
- 9.1.1 Asia-Pacific Radiotherapy Sales Growth Rate (CAGR) by Country: 2021 VS 2025 VS 2032
- 9.1.2 Asia-Pacific Radiotherapy Sales by Country (2021-2026)
- 9.1.3 Asia-Pacific Radiotherapy Sales Forecast by Country (2027-2032)
- 9.2 Asia-Pacific Radiotherapy Market Size by Country
- 9.2.1 Asia-Pacific Radiotherapy Market Size Growth Rate (CAGR) by Country: 2021 VS 2025 VS 2032
- 9.2.2 Asia-Pacific Radiotherapy Market Size by Country (2021-2026)
- 9.2.3 Asia-Pacific Radiotherapy Market Size Forecast by Country (2027-2032)
10 South America by Country
- 10.1 South America Radiotherapy Sales by Country
- 10.1.1 South America Radiotherapy Sales Growth Rate (CAGR) by Country: 2021 VS 2025 VS 2032
- 10.1.2 South America Radiotherapy Sales by Country (2021-2026)
- 10.1.3 South America Radiotherapy Sales Forecast by Country (2027-2032)
- 10.2 South America Radiotherapy Market Size by Country
- 10.2.1 South America Radiotherapy Market Size Growth Rate (CAGR) by Country: 2021 VS 2025 VS 2032
- 10.2.2 South America Radiotherapy Market Size by Country (2021-2026)
- 10.2.3 South America Radiotherapy Market Size Forecast by Country (2027-2032)
11 Middle East and Africa by Country
- 11.1 Middle East and Africa Radiotherapy Sales by Country
- 11.1.1 Middle East and Africa Radiotherapy Sales Growth Rate (CAGR) by Country: 2021 VS 2025 VS 2032
- 11.1.2 Middle East and Africa Radiotherapy Sales by Country (2021-2026)
- 11.1.3 Middle East and Africa Radiotherapy Sales Forecast by Country (2027-2032)
- 11.2 Middle East and Africa Radiotherapy Market Size by Country
- 11.2.1 Middle East and Africa Radiotherapy Market Size Growth Rate (CAGR) by Country: 2021 VS 2025 VS 2032
- 11.2.2 Middle East and Africa Radiotherapy Market Size by Country (2021-2026)
- 11.2.3 Middle East and Africa Radiotherapy Market Size Forecast by Country (2027-2032)
12 Value Chain and Sales Channels Analysis
- 12.1 Radiotherapy Value Chain Analysis
- 12.1.1 Radiotherapy Key Raw Materials
- 12.1.2 Key Raw Materials Price
- 12.1.3 Raw Materials Key Suppliers
- 12.1.4 Manufacturing Cost Structure
- 12.1.5 Radiotherapy Production Mode & Process
- 12.2 Radiotherapy Sales Channels Analysis
- 12.2.1 Direct Comparison with Distribution Share
- 12.2.2 Radiotherapy Distributors
- 12.2.3 Radiotherapy Customers
13 Concluding Insights
14 Appendix
- 14.1 Reasons for Doing This Study
- 14.2 Research Methodology
- 14.3 Research Process
- 14.4 Authors List of This Report
- 14.5 Data Source
- 14.5.1 Secondary Sources
- 14.5.2 Primary Sources
- 14.6 Disclaimer
GET THE RESEARCH
Choose your license.
Choose who needs access.
All options are for this report and research series.
PDF by email within 3–5 working days after payment confirmation.
Talk to an analyst