
Global AI Powered Code Reader Market Outlook and Growth Opportunities 2026
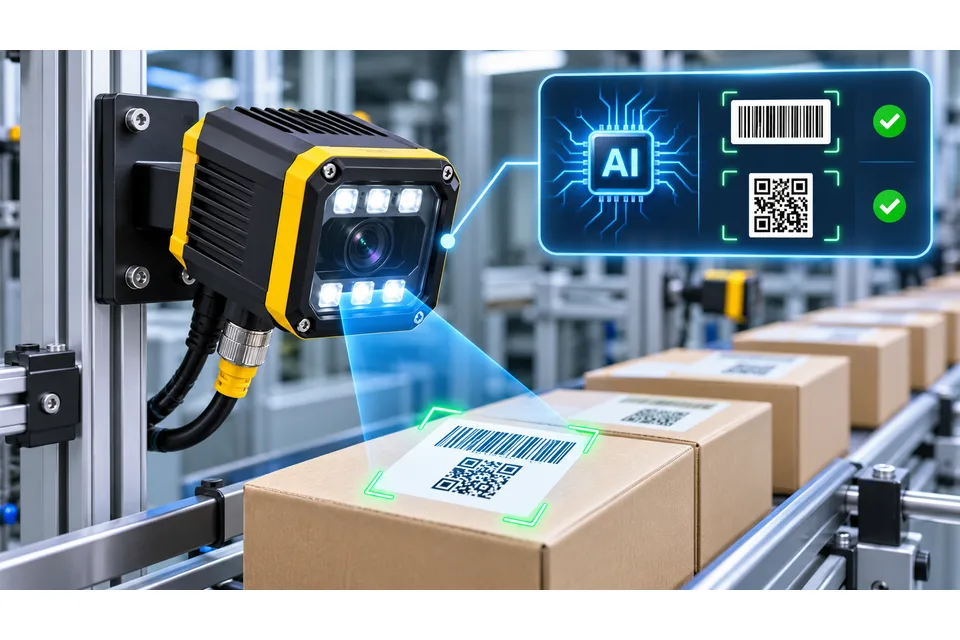
AI Powered Code Readers are electronic optical identification devices that integrate image acquisition, embedded artificial intelligence processing and barcode decoding to extract encoded information from printed, engraved, etched or otherwise marked symbols. Their operating principle is based on detecting spatial variations in reflected light, converting the optical image into digital pixel data and interpreting the geometric arrangement of bars, spaces or two dimensional code cells. A typical device incorporates a CMOS image sensor, optical lens assembly, controlled illumination, image signal processor, embedded computing hardware, memory, communication interfaces and dedicated decoding firmware. Depending on the product configuration, illumination may combine direct, diffuse, polarized or multispectral lighting to control reflections and improve the visibility of symbols on different surfaces. Artificial intelligence functions employ trained neural networks or machine learning algorithms for code localization, image enhancement, feature extraction and adaptive recognition under variations in illumination, perspective, contrast and marking condition. These functions interact with conventional geometric decoding, symbol reconstruction and error correction algorithms to recover encoded data from incomplete or degraded images. The computational architecture may incorporate dedicated neural processing units, embedded processors or specialized image processing accelerators, with image resolution, optical field of view, working distance, processing latency and available computing capacity jointly determining reading performance and operating throughput.
The principal technical distinction of AI Powered Code Readers is their ability to use learned visual representations to identify code regions and recover readable symbol structures under imaging conditions that limit conventional rule based processing. Relevant conditions include damaged labels, partially obscured symbols, uneven illumination, motion blur, reflective metallic surfaces, low contrast markings and geometric distortion. Direct Part Marking (DPM) applications introduce additional complexity because laser engraving, dot peening, chemical etching and other marking processes generate surface relief or reflectance variations whose optical appearance depends on material texture, illumination direction and viewing angle. AI assisted image processing can separate useful symbol features from background texture and adapt to variations in marking quality, while optical resolution, image exposure, illumination geometry and decoder constraints establish the physical limits of recoverable information. Commercial devices include fixed mount industrial code readers, handheld scanners, presentation scanners and mobile data collection terminals incorporating identifiable AI assisted code reading capabilities. They are deployed in automotive and electronics manufacturing, pharmaceutical and medical product identification, food and beverage processing, packaging, retail operations and automated logistics, where decoded identifiers connect physical items with production, inventory and transaction records. The product scope covers complete commercial hardware devices with integrated AI assisted barcode recognition functions, including embedded decoding firmware supplied as part of the equipment. Conventional readers without identifiable AI recognition capabilities, standalone decoding software, software development kits, external machine vision systems lacking integrated code reading functionality, dedicated barcode verification instruments and independent services fall outside the product boundary.
Product & engineering
Understand the product.
AI Powered Code Readers are electronic optical identification devices that integrate image acquisition, embedded artificial intelligence processing and barcode decoding to extract encoded information from printed, engraved, etched or otherwise marked symbols. Their operating principle is based on detecting spatial variations in reflected light, converting the optical image into digital pixel data and interpreting the geometric arrangement of bars, spaces or two dimensional code cells. A typical device incorporates a CMOS image sensor, optical lens assembly, controlled illumination, image signal processor, embedded computing hardware, memory, communication interfaces and dedicated decoding firmware. Depending on the product configuration, illumination may combine direct, diffuse, polarized or multispectral lighting to control reflections and improve the visibility of symbols on different surfaces. Artificial intelligence functions employ trained neural networks or machine learning algorithms for code localization, image enhancement, feature extraction and adaptive recognition under variations in illumination, perspective, contrast and marking condition. These functions interact with conventional geometric decoding, symbol reconstruction and error correction algorithms to recover encoded data from incomplete or degraded images. The computational architecture may incorporate dedicated neural processing units, embedded processors or specialized image processing accelerators, with image resolution, optical field of view, working distance, processing latency and available computing capacity jointly determining reading performance and operating throughput.
The principal technical distinction of AI Powered Code Readers is their ability to use learned visual representations to identify code regions and recover readable symbol structures under imaging conditions that limit conventional rule based processing. Relevant conditions include damaged labels, partially obscured symbols, uneven illumination, motion blur, reflective metallic surfaces, low contrast markings and geometric distortion. Direct Part Marking (DPM) applications introduce additional complexity because laser engraving, dot peening, chemical etching and other marking processes generate surface relief or reflectance variations whose optical appearance depends on material texture, illumination direction and viewing angle. AI assisted image processing can separate useful symbol features from background texture and adapt to variations in marking quality, while optical resolution, image exposure, illumination geometry and decoder constraints establish the physical limits of recoverable information. Commercial devices include fixed mount industrial code readers, handheld scanners, presentation scanners and mobile data collection terminals incorporating identifiable AI assisted code reading capabilities. They are deployed in automotive and electronics manufacturing, pharmaceutical and medical product identification, food and beverage processing, packaging, retail operations and automated logistics, where decoded identifiers connect physical items with production, inventory and transaction records. The product scope covers complete commercial hardware devices with integrated AI assisted barcode recognition functions, including embedded decoding firmware supplied as part of the equipment. Conventional readers without identifiable AI recognition capabilities, standalone decoding software, software development kits, external machine vision systems lacking integrated code reading functionality, dedicated barcode verification instruments and independent services fall outside the product boundary.
Selected research
Market Outlook & Growth Opportunities
Global AI Powered Code Reader Market Outlook and Growth Opportunities 2026
MARKET AT A GLANCE
Scale & outlook
- 2025
- 211.38USD million
- 2032
- 851.18USD million
Select a bar to inspect its value.
Source: APO Research, Inc.
Market perspective
According to APO Research, Inc, the global AI Powered Code Reader market was valued at USD 211.38 million in 2025, is estimated to reach USD 282.79 million in 2026 and is projected to increase to USD 851.18 million by 2032, representing a CAGR of 20.16% from 2026 to 2032. Global shipments of qualifying AI enabled code reading devices are estimated at 219,000 units in 2025, 319,000 units in 2026 and 1.315 million units in 2032, while weighted average manufacturer selling prices decline from approximately USD 965 to USD 886 and USD 647 per unit, respectively. The projected USD 568.39 million revenue increase between 2026 and 2032 reflects the deployment of AI capable fixed readers, handheld scanners and mobile data terminals across industrial traceability, automated distribution and commercial data collection. The principal economic mechanism is the reduction of unsuccessful identification events involving damaged labels, low contrast symbols, reflective surfaces and direct part markings, where manual intervention, interrupted production and repeated scanning create measurable operating costs. Estimated device shipments increase approximately 4.12 times between 2026 and 2032, while average selling prices decline by approximately 27% as embedded AI processing becomes available across a wider range of hardware configurations and procurement volumes increase.
Industrial automation and logistics provide an established customer base for advanced code reading equipment. Cognex reported consolidated revenue of USD 994.36 million in 2025, an increase of 9%, primarily reflecting stronger demand from logistics and consumer electronics customers. Its DataMan 290 and 390 series incorporate AI assisted code localization executed on dedicated neural processing units, improving the detection of difficult symbols before conventional decoding algorithms recover the encoded information. The additional inference workload can increase processing latency under relatively simple reading conditions, making the technology particularly relevant where the reduction in failed reads outweighs incremental processing time. Japan's KEYENCE applies a related approach in its SR X300 series, which incorporates a 2.3 megapixel CMOS image sensor and AI filtering developed using more than 100,000 training images. The SR X100 series does not incorporate the corresponding AI filter, establishing a distinct hardware and processing configuration within the manufacturer's code reader product range. For automotive components, electronics assembly and precision manufacturing, equipment selection therefore depends on the interaction between code contrast, surface reflectivity, working distance, production cycle time and the financial consequences of a failed identification event.
Italy's Datalogic introduced its Matrix 220 XAI industrial reader in February 2025, applying machine learning algorithms to direct part marking applications involving scratched, discolored and stamped surfaces in automotive, electronics and packaging production. These applications require reliable identification after successive manufacturing operations have altered surface texture or marking contrast, increasing the value of integrated illumination, optical imaging and embedded image processing. In China, Newland Digital Technology disclosed that shipments of its industrial identification products increased by nearly 45% in 2025, while identification equipment incorporating its AI decoding capabilities had entered small batch production. Its commercial NVH220 handheld reader combines AI assisted barcode positioning with adaptive processing for difficult industrial markings. The reported industrial shipment increase covers a broader product category, while the small batch production disclosure establishes the earlier commercial stage of its AI enabled equipment. China's electronics manufacturing and industrial traceability activities provide applications for domestically supplied readers, with competition extending from specialized fixed industrial systems toward handheld devices incorporating intelligent decoding capabilities.
Full market overview
North America and Europe remain important markets for automated warehousing, distribution infrastructure and industrial identification equipment, while China, Japan and other Asian manufacturing economies combine substantial production traceability requirements with established scanner manufacturing and electronics supply chains. Fixed readers are generally purchased according to the number of automated inspection stations, conveyor identification points and production lines, making equipment demand sensitive to factory automation investment, production capacity additions and replacement of conventional optical readers. Automotive and electronics manufacturing require recognition of permanent component markings throughout sequential production operations, whereas pharmaceutical, food and beverage, and packaging applications depend on consistent identification across production, labeling and distribution processes. Logistics operators prioritize the ability to identify irregularly oriented packages and damaged shipping labels without interrupting conveyor throughput. Retail and healthcare applications rely more heavily on handheld and mobile equipment, where purchase decisions are additionally constrained by acquisition cost, scanning latency, battery consumption and operator productivity. Advanced fixed readers can retain higher unit values because of specialized optics, lighting and processing requirements, while increasing penetration of AI functionality into handheld and mobile devices expands shipment volumes at lower average prices. The resulting product mix accounts for the projected combination of substantial unit growth and declining weighted selling prices across the global market.
This report provides an overview of the global AI Powered Code Reader market in terms of sales, revenue, and price, analyzing global market trends using historical revenue and sales data for 2021-2025, estimates for 2026, and projected CAGRs through 2032.
The study covers key producers of AI Powered Code Reader and sales in major regions and countries, assesses future market potential, and highlights priority regions and countries for segmenting the market into sub-sectors, with country-specific market value data for the U.S., Canada, Mexico, Brazil, China, Japan, South Korea, Southeast Asia, India, Germany, the U.K., Italy, the Middle East, Africa, and other countries.
The report also presents AI Powered Code Reader sales, revenue, market share, and industry ranking for the main manufacturers for 2021-2026, identifies the major stakeholders in the global market, and analyzes their competitive landscape and market positioning based on recent developments and segmental revenues.
In addition, the report analyzes segment data By Barcode Type and Application—covering sales, revenue, and price—for 2021-2032, and evaluates and forecasts the AI Powered Code Reader market size, projected growth trends, production technologies, key applications, and end-use industries.
In addition, the report analyzes segment data By Form Factor and Application—covering sales, revenue, and price—for 2021-2032, and evaluates and forecasts the AI Powered Code Reader market size, projected growth trends, production technologies, key applications, and end-use industries.
AI Powered Code Reader Segment by Company
- Cognex
- KEYENCE
- Zebra Technologies
- Brady
- Datalogic
- SICK
- Newland AIDC
- Hikrobot
- Dahua Technology
- OPT
- SEUIC
- iData
- EVOC Group
- SmartMore
- Cino
AI Powered Code Reader Segment By Barcode Type
- 1D
- 2D
- DPM
AI Powered Code Reader Segment By Form Factor
- Handheld Scanners
- Presentation Scanners
- Fixed Mount Readers
- Mobile Computers
AI Powered Code Reader Segment by Application
- Automotive
- Electronics & Semiconductors
- Pharmaceuticals
- Food & Beverage
- Printing & Packaging
- Healthcare
- Retail
- Logistics & Distribution
- Others
AI Powered Code Reader Segment by Region
- North America
- United States
- Canada
- Mexico
- Europe
- Germany
- France
- U.K.
- Italy
- Russia
- Spain
- Netherlands
- Switzerland
- Sweden
- Poland
- Asia-Pacific
- China
- Japan
- South Korea
- India
- Australia
- Taiwan
- Southeast Asia
- South America
- Brazil
- Argentina
- Chile
- Middle East & Africa
- Egypt
- South Africa
- Israel
- Türkiye
- GCC Countries
Study Objectives
- To analyze and research the global AI Powered Code Reader status and future forecast, involving, sales, revenue, growth rate (CAGR), market share, historical and forecast.
- To present the key manufacturers, sales, revenue, market share, and Recent Developments.
- To split the breakdown data by regions, type, manufacturers, and Application.
- To analyze the global and key regions AI Powered Code Reader market potential and advantage, opportunity and challenge, restraints, and risks.
- To identify AI Powered Code Reader significant trends, drivers, influence factors in global and regions.
- To analyze AI Powered Code Reader competitive developments such as expansions, agreements, new product launches, and acquisitions in the market.
Reasons to Buy This Report
- This report will help the readers to understand the competition within the industries and strategies for the competitive environment to enhance the potential profit. The report also focuses on the competitive landscape of the global AI Powered Code Reader market, and introduces in detail the market share, industry ranking, competitor ecosystem, market performance, new product development, operation situation, expansion, and acquisition. etc. of the main players, which helps the readers to identify the main competitors and deeply understand the competition pattern of the market.
- This report will help stakeholders to understand the global industry status and trends of AI Powered Code Reader and provides them with information on key market drivers, restraints, challenges, and opportunities.
- This report will help stakeholders to understand competitors better and gain more insights to strengthen their position in their businesses. The competitive landscape section includes the market share and rank (in sales and value), competitor ecosystem, new product development, expansion, and acquisition.
- This report stays updated with novel technology integration, features, and the latest developments in the market.
- This report helps stakeholders to gain insights into which regions to target globally.
- This report helps stakeholders to gain insights into the end-user perception concerning the adoption of AI Powered Code Reader.
- This report helps stakeholders to identify some of the key players in the market and understand their valuable contribution.
Chapter Outline
- Chapter 1: Provides an overview of the AI Powered Code Reader market, including product definition, global market growth prospects, sales value, sales volume, and average price forecasts (2021-2032).
- Chapter 2: Analysis key trends, drivers, challenges, and opportunities within the global AI Powered Code Reader industry.
- Chapter 3: Detailed analysis of AI Powered Code Reader manufacturers competitive landscape, price, sales and revenue market share, latest development plan, merger, and acquisition information, etc.
- Chapter 4: Provides the analysis of various market segments By Barcode Type, covering the market size and development potential of each market segment, to help readers find the blue ocean market in different market segments.
- Chapter 5: Provides the analysis of various market segments By Form Factor, covering the market size and development potential of each market segment, to help readers find the blue ocean market in different market segments.
- Chapter 6: Provides the analysis of various market segments by Application, covering the market size and development potential of each market segment, to help readers find the blue ocean market in different downstream markets.
- Chapter 7: Sales and value of AI Powered Code Reader in regional level. It provides a quantitative analysis of the market size and development potential of each region and introduces the market development, future development prospects, market space, and market size of each country in the world.
- Chapter 8: Sales and value of AI Powered Code Reader in country level. It provides sigmate data By Barcode Type, By Form Factor, and by Application for each country/region.
- Chapter 9: Provides profiles of key players, introducing the basic situation of the main companies in the market in detail, including product sales, revenue, price, gross margin, product introduction, recent development, etc.
- Chapter 10: Analysis of industrial chain, including the upstream and downstream of the industry.
- Chapter 11: Concluding Insights.
More report detail
Tables and figures
List of Tables
- Table 1. AI Powered Code Reader Industry Trends
- Table 2. AI Powered Code Reader Industry Drivers
- Table 3. AI Powered Code Reader Industry Opportunities and Challenges
- Table 4. AI Powered Code Reader Industry Restraints
- Table 5. Global AI Powered Code Reader Revenue by Company (US$ Million) & (2021-2026)
- Table 6. Global AI Powered Code Reader Revenue Share by Company (2021-2026)
- Table 7. Global AI Powered Code Reader Sales Volume by Company (k units) & (2021-2026)
- Table 8. Global AI Powered Code Reader Sales Volume Share by Company (2021-2026)
- Table 9. Global AI Powered Code Reader Average Price (USD/unit) of Company (2021-2026)
- Table 10. Global AI Powered Code Reader Company Ranking, (2024-2026) & (USD Million)
- Table 11. Global AI Powered Code Reader Key Company Manufacturing Base & Headquarters
- Table 12. Global AI Powered Code Reader Company, Product Type & Application
- Table 13. Global AI Powered Code Reader Company Establishment Date
- Table 14. Global Company Market Concentration Ratio (CR5 and HHI)
- Table 15. Global AI Powered Code Reader by Company Type (Tier 1, Tier 2, and Tier 3) & (Based on Revenue of 2025)
- Table 16. Mergers & Acquisitions, Expansion
- Table 17. Significant Companies of 1D
- Table 18. Significant Companies of 2D
- Table 19. Significant Companies of DPM
- Table 20. Global AI Powered Code Reader Sales Volume By Barcode Type 2021 VS 2025 VS 2032 (k units)
- Table 21. Global AI Powered Code Reader Sales Volume By Barcode Type (2021-2026) & (k units)
- Table 22. Global AI Powered Code Reader Sales Volume By Barcode Type (2027-2032) & (k units)
- Table 23. Global AI Powered Code Reader Sales Volume Share By Barcode Type (2021-2026)
- Table 24. Global AI Powered Code Reader Sales Volume Share By Barcode Type (2027-2032)
- Table 25. Global AI Powered Code Reader Sales Value By Barcode Type 2021 VS 2025 VS 2032 (US$ Million)
- Table 26. Global AI Powered Code Reader Sales Value By Barcode Type (2021-2026) & (US$ Million)
- Table 27. Global AI Powered Code Reader Sales Value By Barcode Type (2027-2032) & (US$ Million)
- Table 28. Global AI Powered Code Reader Sales Value Share By Barcode Type (2021-2026)
- Table 29. Global AI Powered Code Reader Sales Value Share By Barcode Type (2027-2032)
- Table 30. Significant Companies of Handheld Scanners
- Table 31. Significant Companies of Presentation Scanners
- Table 32. Significant Companies of Fixed Mount Readers
- Table 33. Significant Companies of Mobile Computers
- Table 34. Global AI Powered Code Reader Sales Volume By Form Factor 2021 VS 2025 VS 2032 (k units)
- Table 35. Global AI Powered Code Reader Sales Volume By Form Factor (2021-2026) & (k units)
- Table 36. Global AI Powered Code Reader Sales Volume By Form Factor (2027-2032) & (k units)
- Table 37. Global AI Powered Code Reader Sales Volume Share By Form Factor (2021-2026)
- Table 38. Global AI Powered Code Reader Sales Volume Share By Form Factor (2027-2032)
- Table 39. Global AI Powered Code Reader Sales Value By Form Factor 2021 VS 2025 VS 2032 (US$ Million)
- Table 40. Global AI Powered Code Reader Sales Value By Form Factor (2021-2026) & (US$ Million)
- Table 41. Global AI Powered Code Reader Sales Value By Form Factor (2027-2032) & (US$ Million)
- Table 42. Global AI Powered Code Reader Sales Value Share By Form Factor (2021-2026)
- Table 43. Global AI Powered Code Reader Sales Value Share By Form Factor (2027-2032)
- Table 44. Significant Companies of Automotive
- Table 45. Significant Companies of Electronics & Semiconductors
- Table 46. Significant Companies of Pharmaceuticals
- Table 47. Significant Companies of Food & Beverage
- Table 48. Significant Companies of Printing & Packaging
- Table 49. Significant Companies of Healthcare
- Table 50. Significant Companies of Retail
- Table 51. Significant Companies of Logistics & Distribution
- Table 52. Significant Companies of Others
- Table 53. Global AI Powered Code Reader Sales Volume by Application 2021 VS 2025 VS 2032 (k units)
- Table 54. Global AI Powered Code Reader Sales Volume by Application (2021-2026) & (k units)
- Table 55. Global AI Powered Code Reader Sales Volume by Application (2027-2032) & (k units)
- Table 56. Global AI Powered Code Reader Sales Volume Share by Application (2021-2026)
- Table 57. Global AI Powered Code Reader Sales Volume Share by Application (2027-2032)
- Table 58. Global AI Powered Code Reader Sales Value by Application 2021 VS 2025 VS 2032 (US$ Million)
- Table 59. Global AI Powered Code Reader Sales Value by Application (2021-2026) & (US$ Million)
- Table 60. Global AI Powered Code Reader Sales Value by Application (2027-2032) & (US$ Million)
- Table 61. Global AI Powered Code Reader Sales Value Share by Application (2021-2026)
- Table 62. Global AI Powered Code Reader Sales Value Share by Application (2027-2032)
- Table 63. Global AI Powered Code Reader Sales by Region: 2021 VS 2025 VS 2032 (k units)
- Table 64. Global AI Powered Code Reader Sales by Region (2021-2026) & (k units)
- Table 65. Global AI Powered Code Reader Sales Market Share by Region (2021-2026)
- Table 66. Global AI Powered Code Reader Sales by Region (2027-2032) & (k units)
- Table 67. Global AI Powered Code Reader Sales Market Share by Region (2027-2032)
- Table 68. Global AI Powered Code Reader Sales Value Comparison by Region: 2021 VS 2025 VS 2032 (US$ Million)
- Table 69. Global AI Powered Code Reader Sales Value by Region (2021-2026) & (US$ Million)
- Table 70. Global AI Powered Code Reader Sales Value Share by Region (2021-2026)
- Table 71. Global AI Powered Code Reader Sales Value by Region (2027-2032) & (US$ Million)
- Table 72. Global AI Powered Code Reader Sales Value Share by Region (2027-2032)
- Table 73. Global AI Powered Code Reader Market Average Price (USD/unit) by Region (2021-2026)
- Table 74. Global AI Powered Code Reader Market Average Price (USD/unit) by Region (2027-2032)
- Table 75. Global AI Powered Code Reader Sales by Country: 2021 VS 2025 VS 2032 (k units)
- Table 76. Global AI Powered Code Reader Sales Value by Country: 2021 VS 2025 VS 2032 (US$ Million)
- Table 77. Global AI Powered Code Reader Sales by Country (2021-2026) & (k units)
- Table 78. Global AI Powered Code Reader Sales Market Share by Country (2021-2026)
- Table 79. Global AI Powered Code Reader Sales by Country (2027-2032) & (k units)
- Table 80. Global AI Powered Code Reader Sales Market Share by Country (2027-2032)
- Table 81. Global AI Powered Code Reader Sales Value by Country (2021-2026) & (US$ Million)
- Table 82. Global AI Powered Code Reader Sales Value Market Share by Country (2021-2026)
- Table 83. Global AI Powered Code Reader Sales Value by Country (2027-2032) & (US$ Million)
- Table 84. Global AI Powered Code Reader Sales Value Market Share by Country (2027-2032)
- Table 85. Cognex Company Information
- Table 86. Cognex Business Overview
- Table 87. Cognex AI Powered Code Reader Sales (k units), Value (US$ Million), Price (USD/unit) and Gross Margin (2021-2026)
- Table 88. Cognex AI Powered Code Reader Product Portfolio
- Table 89. Cognex Recent Development
- Table 90. KEYENCE Company Information
- Table 91. KEYENCE Business Overview
- Table 92. KEYENCE AI Powered Code Reader Sales (k units), Value (US$ Million), Price (USD/unit) and Gross Margin (2021-2026)
- Table 93. KEYENCE AI Powered Code Reader Product Portfolio
- Table 94. KEYENCE Recent Development
- Table 95. Zebra Technologies Company Information
- Table 96. Zebra Technologies Business Overview
- Table 97. Zebra Technologies AI Powered Code Reader Sales (k units), Value (US$ Million), Price (USD/unit) and Gross Margin (2021-2026)
- Table 98. Zebra Technologies AI Powered Code Reader Product Portfolio
- Table 99. Zebra Technologies Recent Development
- Table 100. Brady Company Information
- Table 101. Brady Business Overview
- Table 102. Brady AI Powered Code Reader Sales (k units), Value (US$ Million), Price (USD/unit) and Gross Margin (2021-2026)
- Table 103. Brady AI Powered Code Reader Product Portfolio
- Table 104. Brady Recent Development
- Table 105. Datalogic Company Information
- Table 106. Datalogic Business Overview
- Table 107. Datalogic AI Powered Code Reader Sales (k units), Value (US$ Million), Price (USD/unit) and Gross Margin (2021-2026)
- Table 108. Datalogic AI Powered Code Reader Product Portfolio
- Table 109. Datalogic Recent Development
- Table 110. SICK Company Information
- Table 111. SICK Business Overview
- Table 112. SICK AI Powered Code Reader Sales (k units), Value (US$ Million), Price (USD/unit) and Gross Margin (2021-2026)
- Table 113. SICK AI Powered Code Reader Product Portfolio
- Table 114. SICK Recent Development
- Table 115. Newland AIDC Company Information
- Table 116. Newland AIDC Business Overview
- Table 117. Newland AIDC AI Powered Code Reader Sales (k units), Value (US$ Million), Price (USD/unit) and Gross Margin (2021-2026)
- Table 118. Newland AIDC AI Powered Code Reader Product Portfolio
- Table 119. Newland AIDC Recent Development
- Table 120. Hikrobot Company Information
- Table 121. Hikrobot Business Overview
- Table 122. Hikrobot AI Powered Code Reader Sales (k units), Value (US$ Million), Price (USD/unit) and Gross Margin (2021-2026)
- Table 123. Hikrobot AI Powered Code Reader Product Portfolio
- Table 124. Hikrobot Recent Development
- Table 125. Dahua Technology Company Information
- Table 126. Dahua Technology Business Overview
- Table 127. Dahua Technology AI Powered Code Reader Sales (k units), Value (US$ Million), Price (USD/unit) and Gross Margin (2021-2026)
- Table 128. Dahua Technology AI Powered Code Reader Product Portfolio
- Table 129. Dahua Technology Recent Development
- Table 130. OPT Company Information
- Table 131. OPT Business Overview
- Table 132. OPT AI Powered Code Reader Sales (k units), Value (US$ Million), Price (USD/unit) and Gross Margin (2021-2026)
- Table 133. OPT AI Powered Code Reader Product Portfolio
- Table 134. OPT Recent Development
- Table 135. SEUIC Company Information
- Table 136. SEUIC Business Overview
- Table 137. SEUIC AI Powered Code Reader Sales (k units), Value (US$ Million), Price (USD/unit) and Gross Margin (2021-2026)
- Table 138. SEUIC AI Powered Code Reader Product Portfolio
- Table 139. SEUIC Recent Development
- Table 140. iData Company Information
- Table 141. iData Business Overview
- Table 142. iData AI Powered Code Reader Sales (k units), Value (US$ Million), Price (USD/unit) and Gross Margin (2021-2026)
- Table 143. iData AI Powered Code Reader Product Portfolio
- Table 144. iData Recent Development
- Table 145. EVOC Group Company Information
- Table 146. EVOC Group Business Overview
- Table 147. EVOC Group AI Powered Code Reader Sales (k units), Value (US$ Million), Price (USD/unit) and Gross Margin (2021-2026)
- Table 148. EVOC Group AI Powered Code Reader Product Portfolio
- Table 149. EVOC Group Recent Development
- Table 150. SmartMore Company Information
- Table 151. SmartMore Business Overview
- Table 152. SmartMore AI Powered Code Reader Sales (k units), Value (US$ Million), Price (USD/unit) and Gross Margin (2021-2026)
- Table 153. SmartMore AI Powered Code Reader Product Portfolio
- Table 154. SmartMore Recent Development
- Table 155. Cino Company Information
- Table 156. Cino Business Overview
- Table 157. Cino AI Powered Code Reader Sales (k units), Value (US$ Million), Price (USD/unit) and Gross Margin (2021-2026)
- Table 158. Cino AI Powered Code Reader Product Portfolio
- Table 159. Cino Recent Development
- Table 160. Key Raw Materials
- Table 161. Raw Materials Key Suppliers
- Table 162. AI Powered Code Reader Distributors List
- Table 163. AI Powered Code Reader Customers List
- Table 164. Research Programs/Design for This Report
- Table 165. Authors List of This Report
- Table 166. Secondary Sources
- Table 167. Primary Sources
List of Figures
- Figure 1. AI Powered Code Reader Product Image
- Figure 2. Global AI Powered Code Reader Sales Value (US$ Million), 2021 VS 2025 VS 2032
- Figure 3. Global AI Powered Code Reader Sales Value (2021-2032) & (US$ Million)
- Figure 4. Global AI Powered Code Reader Sales (2021-2032) & (k units)
- Figure 5. Global AI Powered Code Reader Sales Average Price (USD/unit) & (2021-2032)
- Figure 6. Global AI Powered Code Reader Company Revenue Ranking in 2025 (US$ Million)
- Figure 7. Global Top 5 and 10 Company Market Share by Revenue in 2025 (US$ Million)
- Figure 8. Company Type (Tier 1, Tier 2, and Tier 3): 2021 VS 2025
- Figure 9. 1D Image
- Figure 10. 2D Image
- Figure 11. DPM Image
- Figure 12. Global AI Powered Code Reader Sales Volume By Barcode Type (2021 VS 2025 VS 2032) & (k units)
- Figure 13. Handheld Scanners Image
- Figure 14. Presentation Scanners Image
- Figure 15. Fixed Mount Readers Image
- Figure 16. Mobile Computers Image
- Figure 17. Global AI Powered Code Reader Sales Volume By Form Factor (2021 VS 2025 VS 2032) & (k units)
- Figure 18. Global AI Powered Code Reader Sales Volume Share 2021 VS 2025 VS 2032
- Figure 19. Global AI Powered Code Reader Sales Volume Share By Barcode Type (2021-2032)
- Figure 20. Global AI Powered Code Reader Sales Value By Barcode Type (2021 VS 2025 VS 2032) & (US$ Million)
- Figure 21. Global AI Powered Code Reader Sales Volume Share By Form Factor (2021-2032)
- Figure 22. Global AI Powered Code Reader Sales Value By Form Factor (2021 VS 2025 VS 2032) & (US$ Million)
- Figure 23. Global AI Powered Code Reader Sales Value Share 2021 VS 2025 VS 2032
- Figure 24. Global AI Powered Code Reader Sales Value Share By Barcode Type (2021-2032)
- Figure 25. Global AI Powered Code Reader Sales Value Share By Form Factor (2021-2032)
- Figure 26. Automotive Image
- Figure 27. Electronics & Semiconductors Image
- Figure 28. Pharmaceuticals Image
- Figure 29. Food & Beverage Image
- Figure 30. Printing & Packaging Image
- Figure 31. Healthcare Image
- Figure 32. Retail Image
- Figure 33. Logistics & Distribution Image
- Figure 34. Others Image
- Figure 35. Global AI Powered Code Reader Sales Volume by Application (2021 VS 2025 VS 2032) & (k units)
- Figure 36. Global AI Powered Code Reader Sales Volume Share 2021 VS 2025 VS 2032
- Figure 37. Global AI Powered Code Reader Sales Volume Share by Application (2021-2032)
- Figure 38. Global AI Powered Code Reader Sales Value by Application (2021 VS 2025 VS 2032) & (US$ Million)
- Figure 39. Global AI Powered Code Reader Sales Value Share 2021 VS 2025 VS 2032
- Figure 40. Global AI Powered Code Reader Sales Value Share by Application (2021-2032)
- Figure 41. Global AI Powered Code Reader Sales by Region: 2021 VS 2025 VS 2032 (k units)
- Figure 42. Global AI Powered Code Reader Sales Market Share by Region: 2021 VS 2025 VS 2032
- Figure 43. Global AI Powered Code Reader Sales Value Comparison by Region: 2021 VS 2025 VS 2032 (US$ Million)
- Figure 44. Global AI Powered Code Reader Sales Value Share by Region: 2021 VS 2025 VS 2032
- Figure 45. North America AI Powered Code Reader Sales Value (2021-2032) & (US$ Million)
- Figure 46. North America AI Powered Code Reader Sales Value Share by Country (%), 2025 VS 2032
- Figure 47. Europe AI Powered Code Reader Sales Value (2021-2032) & (US$ Million)
- Figure 48. Europe AI Powered Code Reader Sales Value Share by Country (%), 2025 VS 2032
- Figure 49. Asia-Pacific AI Powered Code Reader Sales Value (2021-2032) & (US$ Million)
- Figure 50. Asia-Pacific AI Powered Code Reader Sales Value Share by Country (%), 2025 VS 2032
- Figure 51. South America AI Powered Code Reader Sales Value (2021-2032) & (US$ Million)
- Figure 52. South America AI Powered Code Reader Sales Value Share by Country (%), 2025 VS 2032
- Figure 53. Middle East & Africa AI Powered Code Reader Sales Value (2021-2032) & (US$ Million)
- Figure 54. Middle East & Africa AI Powered Code Reader Sales Value Share by Country (%), 2025 VS 2032
- Figure 55. USA AI Powered Code Reader Sales Value Growth Rate (2021-2032) & (US$ Million)
- Figure 56. USA AI Powered Code Reader Sales Value Share By Barcode Type, 2025 VS 2032 & (%)
- Figure 57. USA AI Powered Code Reader Sales Value Share By Form Factor, 2025 VS 2032 & (%)
- Figure 58. USA AI Powered Code Reader Sales Value Share by Application, 2025 VS 2032 & (%)
- Figure 59. Canada AI Powered Code Reader Sales Value Growth Rate (2021-2032) & (US$ Million)
- Figure 60. Canada AI Powered Code Reader Sales Value Share By Barcode Type, 2025 VS 2032 & (%)
- Figure 61. Canada AI Powered Code Reader Sales Value Share By Form Factor, 2025 VS 2032 & (%)
- Figure 62. Canada AI Powered Code Reader Sales Value Share by Application, 2025 VS 2032 & (%)
- Figure 63. Mexico AI Powered Code Reader Sales Value Growth Rate (2021-2032) & (US$ Million)
- Figure 64. Mexico AI Powered Code Reader Sales Value Share By Barcode Type, 2025 VS 2032 & (%)
- Figure 65. Mexico AI Powered Code Reader Sales Value Share By Form Factor, 2025 VS 2032 & (%)
- Figure 66. Mexico AI Powered Code Reader Sales Value Share by Application, 2025 VS 2032 & (%)
- Figure 67. Germany AI Powered Code Reader Sales Value Growth Rate (2021-2032) & (US$ Million)
- Figure 68. Germany AI Powered Code Reader Sales Value Share By Barcode Type, 2025 VS 2032 & (%)
- Figure 69. Germany AI Powered Code Reader Sales Value Share By Form Factor, 2025 VS 2032 & (%)
- Figure 70. Germany AI Powered Code Reader Sales Value Share by Application, 2025 VS 2032 & (%)
- Figure 71. France AI Powered Code Reader Sales Value Growth Rate (2021-2032) & (US$ Million)
- Figure 72. France AI Powered Code Reader Sales Value Share By Barcode Type, 2025 VS 2032 & (%)
- Figure 73. France AI Powered Code Reader Sales Value Share By Form Factor, 2025 VS 2032 & (%)
- Figure 74. France AI Powered Code Reader Sales Value Share by Application, 2025 VS 2032 & (%)
- Figure 75. U.K. AI Powered Code Reader Sales Value Growth Rate (2021-2032) & (US$ Million)
- Figure 76. U.K. AI Powered Code Reader Sales Value Share By Barcode Type, 2025 VS 2032 & (%)
- Figure 77. U.K. AI Powered Code Reader Sales Value Share By Form Factor, 2025 VS 2032 & (%)
- Figure 78. U.K. AI Powered Code Reader Sales Value Share by Application, 2025 VS 2032 & (%)
- Figure 79. Italy AI Powered Code Reader Sales Value Growth Rate (2021-2032) & (US$ Million)
- Figure 80. Italy AI Powered Code Reader Sales Value Share By Barcode Type, 2025 VS 2032 & (%)
- Figure 81. Italy AI Powered Code Reader Sales Value Share By Form Factor, 2025 VS 2032 & (%)
- Figure 82. Italy AI Powered Code Reader Sales Value Share by Application, 2025 VS 2032 & (%)
- Figure 83. Spain AI Powered Code Reader Sales Value Growth Rate (2021-2032) & (US$ Million)
- Figure 84. Spain AI Powered Code Reader Sales Value Share By Barcode Type, 2025 VS 2032 & (%)
- Figure 85. Spain AI Powered Code Reader Sales Value Share By Form Factor, 2025 VS 2032 & (%)
- Figure 86. Spain AI Powered Code Reader Sales Value Share by Application, 2025 VS 2032 & (%)
- Figure 87. Russia AI Powered Code Reader Sales Value Growth Rate (2021-2032) & (US$ Million)
- Figure 88. Russia AI Powered Code Reader Sales Value Share By Barcode Type, 2025 VS 2032 & (%)
- Figure 89. Russia AI Powered Code Reader Sales Value Share By Form Factor, 2025 VS 2032 & (%)
- Figure 90. Russia AI Powered Code Reader Sales Value Share by Application, 2025 VS 2032 & (%)
- Figure 91. Netherlands AI Powered Code Reader Sales Value Growth Rate (2021-2032) & (US$ Million)
- Figure 92. Netherlands AI Powered Code Reader Sales Value Share By Barcode Type, 2025 VS 2032 & (%)
- Figure 93. Netherlands AI Powered Code Reader Sales Value Share By Form Factor, 2025 VS 2032 & (%)
- Figure 94. Netherlands AI Powered Code Reader Sales Value Share by Application, 2025 VS 2032 & (%)
- Figure 95. Nordic Countries AI Powered Code Reader Sales Value Growth Rate (2021-2032) & (US$ Million)
- Figure 96. Nordic Countries AI Powered Code Reader Sales Value Share By Barcode Type, 2025 VS 2032 & (%)
- Figure 97. Nordic Countries AI Powered Code Reader Sales Value Share By Form Factor, 2025 VS 2032 & (%)
- Figure 98. Nordic Countries AI Powered Code Reader Sales Value Share by Application, 2025 VS 2032 & (%)
- Figure 99. China AI Powered Code Reader Sales Value Growth Rate (2021-2032) & (US$ Million)
- Figure 100. China AI Powered Code Reader Sales Value Share By Barcode Type, 2025 VS 2032 & (%)
- Figure 101. China AI Powered Code Reader Sales Value Share By Form Factor, 2025 VS 2032 & (%)
- Figure 102. China AI Powered Code Reader Sales Value Share by Application, 2025 VS 2032 & (%)
- Figure 103. Japan AI Powered Code Reader Sales Value Growth Rate (2021-2032) & (US$ Million)
- Figure 104. Japan AI Powered Code Reader Sales Value Share By Barcode Type, 2025 VS 2032 & (%)
- Figure 105. Japan AI Powered Code Reader Sales Value Share By Form Factor, 2025 VS 2032 & (%)
- Figure 106. Japan AI Powered Code Reader Sales Value Share by Application, 2025 VS 2032 & (%)
- Figure 107. South Korea AI Powered Code Reader Sales Value Growth Rate (2021-2032) & (US$ Million)
- Figure 108. South Korea AI Powered Code Reader Sales Value Share By Barcode Type, 2025 VS 2032 & (%)
- Figure 109. South Korea AI Powered Code Reader Sales Value Share By Form Factor, 2025 VS 2032 & (%)
- Figure 110. South Korea AI Powered Code Reader Sales Value Share by Application, 2025 VS 2032 & (%)
- Figure 111. India AI Powered Code Reader Sales Value Growth Rate (2021-2032) & (US$ Million)
- Figure 112. India AI Powered Code Reader Sales Value Share By Barcode Type, 2025 VS 2032 & (%)
- Figure 113. India AI Powered Code Reader Sales Value Share By Form Factor, 2025 VS 2032 & (%)
- Figure 114. India AI Powered Code Reader Sales Value Share by Application, 2025 VS 2032 & (%)
- Figure 115. Australia AI Powered Code Reader Sales Value Growth Rate (2021-2032) & (US$ Million)
- Figure 116. Australia AI Powered Code Reader Sales Value Share By Barcode Type, 2025 VS 2032 & (%)
- Figure 117. Australia AI Powered Code Reader Sales Value Share By Form Factor, 2025 VS 2032 & (%)
- Figure 118. Australia AI Powered Code Reader Sales Value Share by Application, 2025 VS 2032 & (%)
- Figure 119. Southeast Asia AI Powered Code Reader Sales Value Growth Rate (2021-2032) & (US$ Million)
- Figure 120. Southeast Asia AI Powered Code Reader Sales Value Share By Barcode Type, 2025 VS 2032 & (%)
- Figure 121. Southeast Asia AI Powered Code Reader Sales Value Share By Form Factor, 2025 VS 2032 & (%)
- Figure 122. Southeast Asia AI Powered Code Reader Sales Value Share by Application, 2025 VS 2032 & (%)
- Figure 123. Brazil AI Powered Code Reader Sales Value Growth Rate (2021-2032) & (US$ Million)
- Figure 124. Brazil AI Powered Code Reader Sales Value Share By Barcode Type, 2025 VS 2032 & (%)
- Figure 125. Brazil AI Powered Code Reader Sales Value Share By Form Factor, 2025 VS 2032 & (%)
- Figure 126. Brazil AI Powered Code Reader Sales Value Share by Application, 2025 VS 2032 & (%)
- Figure 127. Argentina AI Powered Code Reader Sales Value Growth Rate (2021-2032) & (US$ Million)
- Figure 128. Argentina AI Powered Code Reader Sales Value Share By Barcode Type, 2025 VS 2032 & (%)
- Figure 129. Argentina AI Powered Code Reader Sales Value Share By Form Factor, 2025 VS 2032 & (%)
- Figure 130. Argentina AI Powered Code Reader Sales Value Share by Application, 2025 VS 2032 & (%)
- Figure 131. Chile AI Powered Code Reader Sales Value Growth Rate (2021-2032) & (US$ Million)
- Figure 132. Chile AI Powered Code Reader Sales Value Share By Barcode Type, 2025 VS 2032 & (%)
- Figure 133. Chile AI Powered Code Reader Sales Value Share By Form Factor, 2025 VS 2032 & (%)
- Figure 134. Chile AI Powered Code Reader Sales Value Share by Application, 2025 VS 2032 & (%)
- Figure 135. Colombia AI Powered Code Reader Sales Value Growth Rate (2021-2032) & (US$ Million)
- Figure 136. Colombia AI Powered Code Reader Sales Value Share By Barcode Type, 2025 VS 2032 & (%)
- Figure 137. Colombia AI Powered Code Reader Sales Value Share By Form Factor, 2025 VS 2032 & (%)
- Figure 138. Colombia AI Powered Code Reader Sales Value Share by Application, 2025 VS 2032 & (%)
- Figure 139. Peru AI Powered Code Reader Sales Value Growth Rate (2021-2032) & (US$ Million)
- Figure 140. Peru AI Powered Code Reader Sales Value Share By Barcode Type, 2025 VS 2032 & (%)
- Figure 141. Peru AI Powered Code Reader Sales Value Share By Form Factor, 2025 VS 2032 & (%)
- Figure 142. Peru AI Powered Code Reader Sales Value Share by Application, 2025 VS 2032 & (%)
- Figure 143. Saudi Arabia AI Powered Code Reader Sales Value Growth Rate (2021-2032) & (US$ Million)
- Figure 144. Saudi Arabia AI Powered Code Reader Sales Value Share By Barcode Type, 2025 VS 2032 & (%)
- Figure 145. Saudi Arabia AI Powered Code Reader Sales Value Share By Form Factor, 2025 VS 2032 & (%)
- Figure 146. Saudi Arabia AI Powered Code Reader Sales Value Share by Application, 2025 VS 2032 & (%)
- Figure 147. Israel AI Powered Code Reader Sales Value Growth Rate (2021-2032) & (US$ Million)
- Figure 148. Israel Arabia AI Powered Code Reader Sales Value Share By Barcode Type, 2025 VS 2032 & (%)
- Figure 149. Israel Arabia AI Powered Code Reader Sales Value Share By Form Factor, 2025 VS 2032 & (%)
- Figure 150. Israel Arabia AI Powered Code Reader Sales Value Share by Application, 2025 VS 2032 & (%)
- Figure 151. UAE AI Powered Code Reader Sales Value Growth Rate (2021-2032) & (US$ Million)
- Figure 152. UAE AI Powered Code Reader Sales Value Share By Barcode Type, 2025 VS 2032 & (%)
- Figure 153. UAE AI Powered Code Reader Sales Value Share By Form Factor, 2025 VS 2032 & (%)
- Figure 154. UAE AI Powered Code Reader Sales Value Share by Application, 2025 VS 2032 & (%)
- Figure 155. Turkey AI Powered Code Reader Sales Value Growth Rate (2021-2032) & (US$ Million)
- Figure 156. Turkey AI Powered Code Reader Sales Value Share By Barcode Type, 2025 VS 2032 & (%)
- Figure 157. Turkey AI Powered Code Reader Sales Value Share By Form Factor, 2025 VS 2032 & (%)
- Figure 158. Turkey AI Powered Code Reader Sales Value Share by Application, 2025 VS 2032 & (%)
- Figure 159. Iran AI Powered Code Reader Sales Value Growth Rate (2021-2032) & (US$ Million)
- Figure 160. Iran AI Powered Code Reader Sales Value Share By Barcode Type, 2025 VS 2032 & (%)
- Figure 161. Iran AI Powered Code Reader Sales Value Share By Form Factor, 2025 VS 2032 & (%)
- Figure 162. Iran AI Powered Code Reader Sales Value Share by Application, 2025 VS 2032 & (%)
- Figure 163. Egypt AI Powered Code Reader Sales Value Growth Rate (2021-2032) & (US$ Million)
- Figure 164. Egypt AI Powered Code Reader Sales Value Share By Barcode Type, 2025 VS 2032 & (%)
- Figure 165. Egypt AI Powered Code Reader Sales Value Share By Form Factor, 2025 VS 2032 & (%)
- Figure 166. Egypt AI Powered Code Reader Sales Value Share by Application, 2025 VS 2032 & (%)
- Figure 167. AI Powered Code Reader Value Chain
- Figure 168. Manufacturing Cost Structure
- Figure 169. AI Powered Code Reader Sales Mode & Process
- Figure 170. Direct Comparison with Distribution Share
- Figure 171. Distributors Profiles
- Figure 172. Years Considered
- Figure 173. Research Process
- Figure 174. Key Executives Interviewed
Scope & coverage.
By Barcode Type
- 1D
- 2D
- DPM
By Form Factor
- Handheld Scanners
- Presentation Scanners
- Fixed Mount Readers
- Mobile Computers
By Application
- Automotive
- Electronics & Semiconductors
- Pharmaceuticals
- Food & Beverage
- Printing & Packaging
- Healthcare
- Retail
- Logistics & Distribution
- Others
Companies covered
- Cognex
- KEYENCE
- Zebra Technologies
- Brady
- Datalogic
- SICK
- Newland AIDC
- Hikrobot
- Dahua Technology
- OPT
- SEUIC
- iData
- EVOC Group
- SmartMore
- Cino
Inside the report.
1 Market Overview
- 1.1 Product Definition
- 1.2 Global Market Growth Prospects
- 1.2.1 Global AI Powered Code Reader Sales Value (2021-2032)
- 1.2.2 Global AI Powered Code Reader Sales Volume (2021-2032)
- 1.2.3 Global AI Powered Code Reader Sales Average Price (2021-2032)
- 1.3 Assumptions and Limitations
- 1.4 Study Goals and Objectives
2 AI Powered Code Reader Market Dynamics
- 2.1 AI Powered Code Reader Industry Trends
- 2.2 AI Powered Code Reader Industry Drivers
- 2.3 AI Powered Code Reader Industry Opportunities and Challenges
- 2.4 AI Powered Code Reader Industry Restraints
3 AI Powered Code Reader Market by Company
- 3.1 Global AI Powered Code Reader Company Revenue Ranking in 2025
- 3.2 Global AI Powered Code Reader Revenue by Company (2021-2026)
- 3.3 Global AI Powered Code Reader Sales Volume by Company (2021-2026)
- 3.4 Global AI Powered Code Reader Average Price by Company (2021-2026)
- 3.5 Global AI Powered Code Reader Company Ranking (2024-2026)
- 3.6 Global AI Powered Code Reader Company Manufacturing Base and Headquarters
- 3.7 Global AI Powered Code Reader Company Product Type and Application
- 3.8 Global AI Powered Code Reader Company Establishment Date
- 3.9 Market Competitive Analysis
- 3.9.1 Global AI Powered Code Reader Market Concentration Ratio (CR5 and HHI)
- 3.9.2 Global Top 5 and 10 Company Market Share by Revenue in 2025
- 3.9.3 2025 AI Powered Code Reader Tier 1, Tier 2, and Tier 3 Companies
- 3.10 Mergers and Acquisitions Expansion
4 AI Powered Code Reader Market By Barcode Type
- 4.1 AI Powered Code Reader Type Introduction
- 4.1.1 1D
- 4.1.2 2D
- 4.1.3 DPM
- 4.2 Global AI Powered Code Reader Sales Volume By Barcode Type
- 4.2.1 Global AI Powered Code Reader Sales Volume By Barcode Type (2021 VS 2025 VS 2032)
- 4.2.2 Global AI Powered Code Reader Sales Volume By Barcode Type (2021-2032)
- 4.2.3 Global AI Powered Code Reader Sales Volume Share By Barcode Type (2021-2032)
- 4.3 Global AI Powered Code Reader Sales Value By Barcode Type
- 4.3.1 Global AI Powered Code Reader Sales Value By Barcode Type (2021 VS 2025 VS 2032)
- 4.3.2 Global AI Powered Code Reader Sales Value By Barcode Type (2021-2032)
- 4.3.3 Global AI Powered Code Reader Sales Value Share By Barcode Type (2021-2032)
5 AI Powered Code Reader Market By Form Factor
- 5.1 AI Powered Code Reader Type Introduction
- 5.1.1 Handheld Scanners
- 5.1.2 Presentation Scanners
- 5.1.3 Fixed Mount Readers
- 5.1.4 Mobile Computers
- 5.2 Global AI Powered Code Reader Sales Volume By Form Factor
- 5.2.1 Global AI Powered Code Reader Sales Volume By Form Factor (2021 VS 2025 VS 2032)
- 5.2.2 Global AI Powered Code Reader Sales Volume By Form Factor (2021-2032)
- 5.2.3 Global AI Powered Code Reader Sales Volume Share By Form Factor (2021-2032)
- 5.3 Global AI Powered Code Reader Sales Value By Form Factor
- 5.3.1 Global AI Powered Code Reader Sales Value By Form Factor (2021 VS 2025 VS 2032)
- 5.3.2 Global AI Powered Code Reader Sales Value By Form Factor (2021-2032)
- 5.3.3 Global AI Powered Code Reader Sales Value Share By Form Factor (2021-2032)
6 AI Powered Code Reader Market by Application
- 6.1 AI Powered Code Reader Application Introduction
- 6.1.1 Automotive
- 6.1.2 Electronics & Semiconductors
- 6.1.3 Pharmaceuticals
- 6.1.4 Food & Beverage
- 6.1.5 Printing & Packaging
- 6.1.6 Healthcare
- 6.1.7 Retail
- 6.1.8 Logistics & Distribution
- 6.1.9 Others
- 6.2 Global AI Powered Code Reader Sales Volume by Application
- 6.2.1 Global AI Powered Code Reader Sales Volume by Application (2021 VS 2025 VS 2032)
- 6.2.2 Global AI Powered Code Reader Sales Volume by Application (2021-2032)
- 6.2.3 Global AI Powered Code Reader Sales Volume Share by Application (2021-2032)
- 6.3 Global AI Powered Code Reader Sales Value by Application
- 6.3.1 Global AI Powered Code Reader Sales Value by Application (2021 VS 2025 VS 2032)
- 6.3.2 Global AI Powered Code Reader Sales Value by Application (2021-2032)
- 6.3.3 Global AI Powered Code Reader Sales Value Share by Application (2021-2032)
7 AI Powered Code Reader Regional Sales and Value Analysis
- 7.1 Global AI Powered Code Reader Sales by Region: 2021 VS 2025 VS 2032
- 7.2 Global AI Powered Code Reader Sales by Region (2021-2032)
- 7.2.1 Global AI Powered Code Reader Sales by Region: 2021-2026
- 7.2.2 Global AI Powered Code Reader Sales by Region (2027-2032)
- 7.3 Global AI Powered Code Reader Sales Value by Region: 2021 VS 2025 VS 2032
- 7.4 Global AI Powered Code Reader Sales Value by Region (2021-2032)
- 7.4.1 Global AI Powered Code Reader Sales Value by Region: 2021-2026
- 7.4.2 Global AI Powered Code Reader Sales Value by Region (2027-2032)
- 7.5 Global AI Powered Code Reader Market Price Analysis by Region (2021-2026)
- 7.6 North America
- 7.6.1 North America AI Powered Code Reader Sales Value (2021-2032)
- 7.6.2 North America AI Powered Code Reader Sales Value Share by Country, 2025 VS 2032
- 7.7 Europe
- 7.7.1 Europe AI Powered Code Reader Sales Value (2021-2032)
- 7.7.2 Europe AI Powered Code Reader Sales Value Share by Country, 2025 VS 2032
- 7.8 Asia-Pacific
- 7.8.1 Asia-Pacific AI Powered Code Reader Sales Value (2021-2032)
- 7.8.2 Asia-Pacific AI Powered Code Reader Sales Value Share by Country, 2025 VS 2032
- 7.9 South America
- 7.9.1 South America AI Powered Code Reader Sales Value (2021-2032)
- 7.9.2 South America AI Powered Code Reader Sales Value Share by Country, 2025 VS 2032
- 7.10 Middle East & Africa
- 7.10.1 Middle East & Africa AI Powered Code Reader Sales Value (2021-2032)
- 7.10.2 Middle East & Africa AI Powered Code Reader Sales Value Share by Country, 2025 VS 2032
8 AI Powered Code Reader Country-level Sales and Value Analysis
- 8.1 Global AI Powered Code Reader Sales by Country: 2021 VS 2025 VS 2032
- 8.2 Global AI Powered Code Reader Sales Value by Country: 2021 VS 2025 VS 2032
- 8.3 Global AI Powered Code Reader Sales by Country (2021-2032)
- 8.3.1 Global AI Powered Code Reader Sales by Country (2021-2026)
- 8.3.2 Global AI Powered Code Reader Sales by Country (2027-2032)
- 8.4 Global AI Powered Code Reader Sales Value by Country (2021-2032)
- 8.4.1 Global AI Powered Code Reader Sales Value by Country (2021-2026)
- 8.4.2 Global AI Powered Code Reader Sales Value by Country (2027-2032)
- 8.5 USA
- 8.5.1 USA AI Powered Code Reader Sales Value Growth Rate (2021-2032)
- 8.5.2 USA AI Powered Code Reader Sales Value Share By Barcode Type, 2025 VS 2032
- 8.5.3 USA AI Powered Code Reader Sales Value Share By Form Factor, 2025 VS 2032
- 8.5.4 USA AI Powered Code Reader Sales Value Share by Application, 2025 VS 2032
- 8.6 Canada
- 8.6.1 Canada AI Powered Code Reader Sales Value Growth Rate (2021-2032)
- 8.6.2 Canada AI Powered Code Reader Sales Value Share By Barcode Type, 2025 VS 2032
- 8.6.3 Canada AI Powered Code Reader Sales Value Share By Form Factor, 2025 VS 2032
- 8.6.4 Canada AI Powered Code Reader Sales Value Share by Application, 2025 VS 2032
- 8.7 Mexico
- 8.7.1 Mexico AI Powered Code Reader Sales Value Growth Rate (2021-2032)
- 8.7.2 Mexico AI Powered Code Reader Sales Value Share By Barcode Type, 2025 VS 2032
- 8.7.3 Mexico AI Powered Code Reader Sales Value Share By Form Factor, 2025 VS 2032
- 8.7.4 Mexico AI Powered Code Reader Sales Value Share by Application, 2025 VS 2032
- 8.8 Germany
- 8.8.1 Germany AI Powered Code Reader Sales Value Growth Rate (2021-2032)
- 8.8.2 Germany AI Powered Code Reader Sales Value Share By Barcode Type, 2025 VS 2032
- 8.8.3 Germany AI Powered Code Reader Sales Value Share By Form Factor, 2025 VS 2032
- 8.8.4 Germany AI Powered Code Reader Sales Value Share by Application, 2025 VS 2032
- 8.9 France
- 8.9.1 France AI Powered Code Reader Sales Value Growth Rate (2021-2032)
- 8.9.2 France AI Powered Code Reader Sales Value Share By Barcode Type, 2025 VS 2032
- 8.9.3 France AI Powered Code Reader Sales Value Share By Form Factor, 2025 VS 2032
- 8.9.4 France AI Powered Code Reader Sales Value Share by Application, 2025 VS 2032
- 8.10 U.K.
- 8.10.1 U.K. AI Powered Code Reader Sales Value Growth Rate (2021-2032)
- 8.10.2 U.K. AI Powered Code Reader Sales Value Share By Barcode Type, 2025 VS 2032
- 8.10.3 U.K. AI Powered Code Reader Sales Value Share By Form Factor, 2025 VS 2032
- 8.10.4 U.K. AI Powered Code Reader Sales Value Share by Application, 2025 VS 2032
- 8.11 Italy
- 8.11.1 Italy AI Powered Code Reader Sales Value Growth Rate (2021-2032)
- 8.11.2 Italy AI Powered Code Reader Sales Value Share By Barcode Type, 2025 VS 2032
- 8.11.3 Italy AI Powered Code Reader Sales Value Share By Form Factor, 2025 VS 2032
- 8.11.4 Italy AI Powered Code Reader Sales Value Share by Application, 2025 VS 2032
- 8.12 Spain
- 8.12.1 Spain AI Powered Code Reader Sales Value Growth Rate (2021-2032)
- 8.12.2 Spain AI Powered Code Reader Sales Value Share By Barcode Type, 2025 VS 2032
- 8.12.3 Spain AI Powered Code Reader Sales Value Share By Form Factor, 2025 VS 2032
- 8.12.4 Spain AI Powered Code Reader Sales Value Share by Application, 2025 VS 2032
- 8.13 Russia
- 8.13.1 Russia AI Powered Code Reader Sales Value Growth Rate (2021-2032)
- 8.13.2 Russia AI Powered Code Reader Sales Value Share By Barcode Type, 2025 VS 2032
- 8.13.3 Russia AI Powered Code Reader Sales Value Share By Form Factor, 2025 VS 2032
- 8.13.4 Russia AI Powered Code Reader Sales Value Share by Application, 2025 VS 2032
- 8.14 Netherlands
- 8.14.1 Netherlands AI Powered Code Reader Sales Value Growth Rate (2021-2032)
- 8.14.2 Netherlands AI Powered Code Reader Sales Value Share By Barcode Type, 2025 VS 2032
- 8.14.3 Netherlands AI Powered Code Reader Sales Value Share By Form Factor, 2025 VS 2032
- 8.14.4 Netherlands AI Powered Code Reader Sales Value Share by Application, 2025 VS 2032
- 8.15 Nordic Countries
- 8.15.1 Nordic Countries AI Powered Code Reader Sales Value Growth Rate (2021-2032)
- 8.15.2 Nordic Countries AI Powered Code Reader Sales Value Share By Barcode Type, 2025 VS 2032
- 8.15.3 Nordic Countries AI Powered Code Reader Sales Value Share By Form Factor, 2025 VS 2032
- 8.15.4 Nordic Countries AI Powered Code Reader Sales Value Share by Application, 2025 VS 2032
- 8.16 China
- 8.16.1 China AI Powered Code Reader Sales Value Growth Rate (2021-2032)
- 8.16.2 China AI Powered Code Reader Sales Value Share By Barcode Type, 2025 VS 2032
- 8.16.3 China AI Powered Code Reader Sales Value Share By Form Factor, 2025 VS 2032
- 8.16.4 China AI Powered Code Reader Sales Value Share by Application, 2025 VS 2032
- 8.17 Japan
- 8.17.1 Japan AI Powered Code Reader Sales Value Growth Rate (2021-2032)
- 8.17.2 Japan AI Powered Code Reader Sales Value Share By Barcode Type, 2025 VS 2032
- 8.17.3 Japan AI Powered Code Reader Sales Value Share By Form Factor, 2025 VS 2032
- 8.17.4 Japan AI Powered Code Reader Sales Value Share by Application, 2025 VS 2032
- 8.18 South Korea
- 8.18.1 South Korea AI Powered Code Reader Sales Value Growth Rate (2021-2032)
- 8.18.2 South Korea AI Powered Code Reader Sales Value Share By Barcode Type, 2025 VS 2032
- 8.18.3 South Korea AI Powered Code Reader Sales Value Share By Form Factor, 2025 VS 2032
- 8.18.4 South Korea AI Powered Code Reader Sales Value Share by Application, 2025 VS 2032
- 8.19 India
- 8.19.1 India AI Powered Code Reader Sales Value Growth Rate (2021-2032)
- 8.19.2 India AI Powered Code Reader Sales Value Share By Barcode Type, 2025 VS 2032
- 8.19.3 India AI Powered Code Reader Sales Value Share By Form Factor, 2025 VS 2032
- 8.19.4 India AI Powered Code Reader Sales Value Share by Application, 2025 VS 2032
- 8.20 Australia
- 8.20.1 Australia AI Powered Code Reader Sales Value Growth Rate (2021-2032)
- 8.20.2 Australia AI Powered Code Reader Sales Value Share By Barcode Type, 2025 VS 2032
- 8.20.3 Australia AI Powered Code Reader Sales Value Share By Form Factor, 2025 VS 2032
- 8.20.4 Australia AI Powered Code Reader Sales Value Share by Application, 2025 VS 2032
- 8.21 Southeast Asia
- 8.21.1 Southeast Asia AI Powered Code Reader Sales Value Growth Rate (2021-2032)
- 8.21.2 Southeast Asia AI Powered Code Reader Sales Value Share By Barcode Type, 2025 VS 2032
- 8.21.3 Southeast Asia AI Powered Code Reader Sales Value Share By Form Factor, 2025 VS 2032
- 8.21.4 Southeast Asia AI Powered Code Reader Sales Value Share by Application, 2025 VS 2032
- 8.22 Brazil
- 8.22.1 Brazil AI Powered Code Reader Sales Value Growth Rate (2021-2032)
- 8.22.2 Brazil AI Powered Code Reader Sales Value Share By Barcode Type, 2025 VS 2032
- 8.22.3 Brazil AI Powered Code Reader Sales Value Share By Form Factor, 2025 VS 2032
- 8.22.4 Brazil AI Powered Code Reader Sales Value Share by Application, 2025 VS 2032
- 8.23 Argentina
- 8.23.1 Argentina AI Powered Code Reader Sales Value Growth Rate (2021-2032)
- 8.23.2 Argentina AI Powered Code Reader Sales Value Share By Barcode Type, 2025 VS 2032
- 8.23.3 Argentina AI Powered Code Reader Sales Value Share By Form Factor, 2025 VS 2032
- 8.23.4 Argentina AI Powered Code Reader Sales Value Share by Application, 2025 VS 2032
- 8.24 Chile
- 8.24.1 Chile AI Powered Code Reader Sales Value Growth Rate (2021-2032)
- 8.24.2 Chile AI Powered Code Reader Sales Value Share By Barcode Type, 2025 VS 2032
- 8.24.3 Chile AI Powered Code Reader Sales Value Share By Form Factor, 2025 VS 2032
- 8.24.4 Chile AI Powered Code Reader Sales Value Share by Application, 2025 VS 2032
- 8.25 Colombia
- 8.25.1 Colombia AI Powered Code Reader Sales Value Growth Rate (2021-2032)
- 8.25.2 Colombia AI Powered Code Reader Sales Value Share By Barcode Type, 2025 VS 2032
- 8.25.3 Colombia AI Powered Code Reader Sales Value Share By Form Factor, 2025 VS 2032
- 8.25.4 Colombia AI Powered Code Reader Sales Value Share by Application, 2025 VS 2032
- 8.26 Peru
- 8.26.1 Peru AI Powered Code Reader Sales Value Growth Rate (2021-2032)
- 8.26.2 Peru AI Powered Code Reader Sales Value Share By Barcode Type, 2025 VS 2032
- 8.26.3 Peru AI Powered Code Reader Sales Value Share By Form Factor, 2025 VS 2032
- 8.26.4 Peru AI Powered Code Reader Sales Value Share by Application, 2025 VS 2032
- 8.27 Saudi Arabia
- 8.27.1 Saudi Arabia AI Powered Code Reader Sales Value Growth Rate (2021-2032)
- 8.27.2 Saudi Arabia AI Powered Code Reader Sales Value Share By Barcode Type, 2025 VS 2032
- 8.27.3 Saudi Arabia AI Powered Code Reader Sales Value Share By Form Factor, 2025 VS 2032
- 8.27.4 Saudi Arabia AI Powered Code Reader Sales Value Share by Application, 2025 VS 2032
- 8.28 Israel
- 8.28.1 Israel AI Powered Code Reader Sales Value Growth Rate (2021-2032)
- 8.28.2 Israel AI Powered Code Reader Sales Value Share By Barcode Type, 2025 VS 2032
- 8.28.3 Israel AI Powered Code Reader Sales Value Share By Form Factor, 2025 VS 2032
- 8.28.4 Israel AI Powered Code Reader Sales Value Share by Application, 2025 VS 2032
- 8.29 UAE
- 8.29.1 UAE AI Powered Code Reader Sales Value Growth Rate (2021-2032)
- 8.29.2 UAE AI Powered Code Reader Sales Value Share By Barcode Type, 2025 VS 2032
- 8.29.3 UAE AI Powered Code Reader Sales Value Share By Form Factor, 2025 VS 2032
- 8.29.4 UAE AI Powered Code Reader Sales Value Share by Application, 2025 VS 2032
- 8.30 Turkey
- 8.30.1 Turkey AI Powered Code Reader Sales Value Growth Rate (2021-2032)
- 8.30.2 Turkey AI Powered Code Reader Sales Value Share By Barcode Type, 2025 VS 2032
- 8.30.3 Turkey AI Powered Code Reader Sales Value Share By Form Factor, 2025 VS 2032
- 8.30.4 Turkey AI Powered Code Reader Sales Value Share by Application, 2025 VS 2032
- 8.31 Iran
- 8.31.1 Iran AI Powered Code Reader Sales Value Growth Rate (2021-2032)
- 8.31.2 Iran AI Powered Code Reader Sales Value Share By Barcode Type, 2025 VS 2032
- 8.31.3 Iran AI Powered Code Reader Sales Value Share By Form Factor, 2025 VS 2032
- 8.31.4 Iran AI Powered Code Reader Sales Value Share by Application, 2025 VS 2032
- 8.32 Egypt
- 8.32.1 Egypt AI Powered Code Reader Sales Value Growth Rate (2021-2032)
- 8.32.2 Egypt AI Powered Code Reader Sales Value Share By Barcode Type, 2025 VS 2032
- 8.32.3 Egypt AI Powered Code Reader Sales Value Share By Form Factor, 2025 VS 2032
- 8.32.4 Egypt AI Powered Code Reader Sales Value Share by Application, 2025 VS 2032
9 Company Profiles
- 9.1 Cognex
- 9.1.1 Cognex Company Information
- 9.1.2 Cognex Business Overview
- 9.1.3 Cognex AI Powered Code Reader Sales, Value and Gross Margin (2021-2026)
- 9.1.4 Cognex AI Powered Code Reader Product Portfolio
- 9.1.5 Cognex Recent Developments
- 9.2 KEYENCE
- 9.2.1 KEYENCE Company Information
- 9.2.2 KEYENCE Business Overview
- 9.2.3 KEYENCE AI Powered Code Reader Sales, Value and Gross Margin (2021-2026)
- 9.2.4 KEYENCE AI Powered Code Reader Product Portfolio
- 9.2.5 KEYENCE Recent Developments
- 9.3 Zebra Technologies
- 9.3.1 Zebra Technologies Company Information
- 9.3.2 Zebra Technologies Business Overview
- 9.3.3 Zebra Technologies AI Powered Code Reader Sales, Value and Gross Margin (2021-2026)
- 9.3.4 Zebra Technologies AI Powered Code Reader Product Portfolio
- 9.3.5 Zebra Technologies Recent Developments
- 9.4 Brady
- 9.4.1 Brady Company Information
- 9.4.2 Brady Business Overview
- 9.4.3 Brady AI Powered Code Reader Sales, Value and Gross Margin (2021-2026)
- 9.4.4 Brady AI Powered Code Reader Product Portfolio
- 9.4.5 Brady Recent Developments
- 9.5 Datalogic
- 9.5.1 Datalogic Company Information
- 9.5.2 Datalogic Business Overview
- 9.5.3 Datalogic AI Powered Code Reader Sales, Value and Gross Margin (2021-2026)
- 9.5.4 Datalogic AI Powered Code Reader Product Portfolio
- 9.5.5 Datalogic Recent Developments
- 9.6 SICK
- 9.6.1 SICK Company Information
- 9.6.2 SICK Business Overview
- 9.6.3 SICK AI Powered Code Reader Sales, Value and Gross Margin (2021-2026)
- 9.6.4 SICK AI Powered Code Reader Product Portfolio
- 9.6.5 SICK Recent Developments
- 9.7 Newland AIDC
- 9.7.1 Newland AIDC Company Information
- 9.7.2 Newland AIDC Business Overview
- 9.7.3 Newland AIDC AI Powered Code Reader Sales, Value and Gross Margin (2021-2026)
- 9.7.4 Newland AIDC AI Powered Code Reader Product Portfolio
- 9.7.5 Newland AIDC Recent Developments
- 9.8 Hikrobot
- 9.8.1 Hikrobot Company Information
- 9.8.2 Hikrobot Business Overview
- 9.8.3 Hikrobot AI Powered Code Reader Sales, Value and Gross Margin (2021-2026)
- 9.8.4 Hikrobot AI Powered Code Reader Product Portfolio
- 9.8.5 Hikrobot Recent Developments
- 9.9 Dahua Technology
- 9.9.1 Dahua Technology Company Information
- 9.9.2 Dahua Technology Business Overview
- 9.9.3 Dahua Technology AI Powered Code Reader Sales, Value and Gross Margin (2021-2026)
- 9.9.4 Dahua Technology AI Powered Code Reader Product Portfolio
- 9.9.5 Dahua Technology Recent Developments
- 9.10 OPT
- 9.10.1 OPT Company Information
- 9.10.2 OPT Business Overview
- 9.10.3 OPT AI Powered Code Reader Sales, Value and Gross Margin (2021-2026)
- 9.10.4 OPT AI Powered Code Reader Product Portfolio
- 9.10.5 OPT Recent Developments
- 9.11 SEUIC
- 9.11.1 SEUIC Company Information
- 9.11.2 SEUIC Business Overview
- 9.11.3 SEUIC AI Powered Code Reader Sales, Value and Gross Margin (2021-2026)
- 9.11.4 SEUIC AI Powered Code Reader Product Portfolio
- 9.11.5 SEUIC Recent Developments
- 9.12 iData
- 9.12.1 iData Company Information
- 9.12.2 iData Business Overview
- 9.12.3 iData AI Powered Code Reader Sales, Value and Gross Margin (2021-2026)
- 9.12.4 iData AI Powered Code Reader Product Portfolio
- 9.12.5 iData Recent Developments
- 9.13 EVOC Group
- 9.13.1 EVOC Group Company Information
- 9.13.2 EVOC Group Business Overview
- 9.13.3 EVOC Group AI Powered Code Reader Sales, Value and Gross Margin (2021-2026)
- 9.13.4 EVOC Group AI Powered Code Reader Product Portfolio
- 9.13.5 EVOC Group Recent Developments
- 9.14 SmartMore
- 9.14.1 SmartMore Company Information
- 9.14.2 SmartMore Business Overview
- 9.14.3 SmartMore AI Powered Code Reader Sales, Value and Gross Margin (2021-2026)
- 9.14.4 SmartMore AI Powered Code Reader Product Portfolio
- 9.14.5 SmartMore Recent Developments
- 9.15 Cino
- 9.15.1 Cino Company Information
- 9.15.2 Cino Business Overview
- 9.15.3 Cino AI Powered Code Reader Sales, Value and Gross Margin (2021-2026)
- 9.15.4 Cino AI Powered Code Reader Product Portfolio
- 9.15.5 Cino Recent Developments
10 Value Chain and Sales Channels Analysis
- 10.1 AI Powered Code Reader Value Chain Analysis
- 10.1.1 AI Powered Code Reader Key Raw Materials
- 10.1.2 Raw Materials Key Suppliers
- 10.1.3 Manufacturing Cost Structure
- 10.1.4 AI Powered Code Reader Sales Mode & Process
- 10.2 AI Powered Code Reader Sales Channels Analysis
- 10.2.1 Direct Comparison with Distribution Share
- 10.2.2 AI Powered Code Reader Distributors
- 10.2.3 AI Powered Code Reader Customers
11 Concluding Insights
12 Appendix
- 12.1 Reasons for Doing This Study
- 12.2 Research Methodology
- 12.3 Research Process
- 12.4 Authors List of This Report
- 12.5 Data Source
- 12.5.1 Secondary Sources
- 12.5.2 Primary Sources
GET THE RESEARCH
Choose your license.
PDF by email within 3–5 working days after payment confirmation.
Talk to an analyst