APO RESEARCH · REPORT
Wood Preservative Treatment Chemicals
Wood Preservative Treatment Chemicals are regulated chemical systems used to protect lumber, poles, ties, piles, engineered wood and other wood products against biological deterioration caused by decay fungi, molds, sapstain fungi, termites, wood boring insects and marine borers.
Product & engineering
Understand the product.
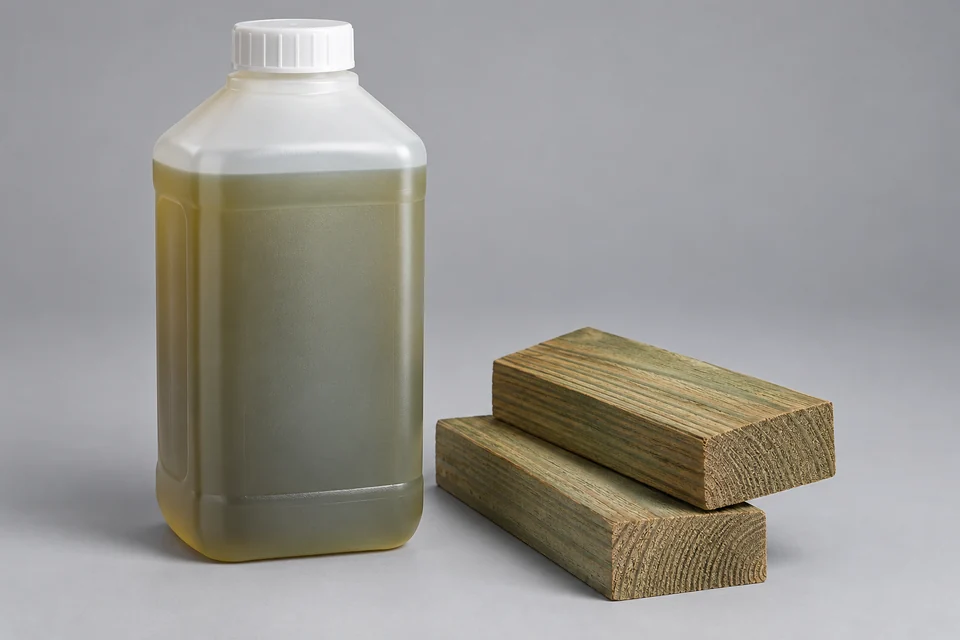
Wood Preservative Treatment Chemicals are regulated chemical systems used to protect lumber, poles, ties, piles, engineered wood and other wood products against biological deterioration caused by decay fungi, molds, sapstain fungi, termites, wood boring insects and marine borers. The category covers preservative concentrates, working solutions, oil borne formulations, organic solvent formulations, borate treatments, copper based waterborne systems and legacy chromated arsenical systems used in industrial impregnation, surface treatment, remedial treatment and specialty wood protection. These chemicals extend the service life of wood by delivering fungicidal, insecticidal or fixation chemistry into the wood structure, usually before the treated wood is placed into outdoor, ground contact, freshwater, marine, utility, agricultural or structural service.
The industry is defined by the interaction between active chemistry, carrier system, treatment process and exposure class. Copper based systems such as ACQ, copper azole, micronized copper and copper HDO dominate much of the residential and commercial outdoor lumber market because copper provides broad fungal protection, while quaternary ammonium compounds, azoles or other cobiocides extend activity against insects and selected decay organisms. Borate preservatives, mainly disodium octaborate tetrahydrate and related boron compounds, are widely used where leaching risk is controlled, especially framing lumber, sill plates, sheathing, engineered wood and interior or protected structural components. Oil borne preservatives such as creosote and copper naphthenate remain important in heavy duty applications including railroad ties, utility poles, bridge timbers, marine piles and ground contact industrial wood. Organic solvent and organic biocide systems use azoles, isothiazolinones, DCOI, permethrin, imidacloprid and related active ingredients for millwork, joinery, aboveground wood, sapstain control, engineered wood and specialist applications where appearance, dimensional stability or lower metal loading is required. Chromated arsenicals, especially CCA, have lost most residential use in North America and Europe, yet remain relevant in permitted industrial uses and some regional markets because chromium fixation, copper fungicidal activity and arsenical insecticidal activity give high durability under severe exposure.
Commercial treatment is mainly carried out in pressure treatment cylinders using controlled vacuum, pressure, solution concentration, temperature, time and post treatment conditioning. The process forces preservative into the sapwood zone to meet specified retention and penetration targets for the intended use class. Waterborne copper and borate systems are usually supplied as concentrates or ready to dilute products and applied in aqueous solution. Oil borne and creosote systems use petroleum oil, coal tar distillate or oil type carriers and are selected where deep penetration, water resistance and long field life are more important than odor, color or handling profile. Organic solvent systems use lighter carriers and lower active loadings, often for appearance sensitive wood products. Manufacturing includes active ingredient synthesis or sourcing, concentrate blending, stabilization, corrosion control, fixation chemistry management, quality testing for assay and pH, and compatibility control with wood species, fasteners, adhesives, coatings and treatment equipment.
The value chain begins with copper compounds, borates, coal tar distillates, petroleum carriers, triazole fungicides, quaternary ammonium compounds, isothiazolinones, insecticides, emulsifiers, fixation aids and process additives. Formulators convert these materials into registered preservative systems, treatment plants impregnate wood to defined retention levels, and treated wood enters residential decking and fencing, commercial landscape and agricultural uses, utility distribution networks, railroad infrastructure, marine construction, transportation assets and heavy industrial timber. Regulation is central to the category because many wood preservatives are pesticide or biocidal products, and their permitted uses depend on active ingredient risk assessment, label restrictions, worker exposure controls, environmental release limits and disposal requirements. Current market development is therefore shaped by the replacement of arsenical and pentachlorophenol systems in many uses, wider adoption of copper azole and micronized copper, continued demand for creosote and copper naphthenate in heavy duty infrastructure, and stronger scrutiny of leaching, corrosion, worker safety and treated wood end of life management.
Composition, supplied form and processing history determine the usable material. Evaluate the property required by the actual application with the specified test method; a chemistry name alone does not define a finished grade.
What turns activity into demand
Qualified formulation or component output creates material purchases through loading, process yield and the supplied mass basis. Raw material, formulated blend and finished-part revenues describe separate transaction stages.
The commercial boundary
For Wood Preservative Treatment Chemicals, distinguish the supplied product from its inputs and the complete application. Report types and applications may overlap; retain the selected edition's product definition, geography, period, unit and transaction basis when comparing estimates.
Which conditions determine usable wood preservative treatment chemicals performance?
Wood Preservative Treatment Chemicals are regulated chemical systems used to protect lumber, poles, ties, piles, engineered wood and other wood products against biological deterioration caused by decay fungi, molds, sapstain fungi, termites, wood boring insects and marine borers. Match formulation and impurity limits to the converting process, then verify the property after processing or curing. Compare like-for-like dry or as-supplied quantities; a finished component and its raw material represent different transaction stages.
Selected research
Market Outlook & Growth Opportunities
Global Wood Preservative Treatment Chemicals Market Outlook and Growth Opportunities 2026
Market perspective
Wood Preservative Treatment Chemicals are regulated chemical systems used to protect lumber, poles, ties, piles, engineered wood and other wood products against biological deterioration caused by decay fungi, molds, sapstain fungi, termites, wood boring insects and marine borers. The category covers preservative concentrates, working solutions, oil borne formulations, organic solvent formulations, borate treatments, copper based waterborne systems and legacy chromated arsenical systems used in industrial impregnation, surface treatment, remedial treatment and specialty wood protection. These chemicals extend the service life of wood by delivering fungicidal, insecticidal or fixation chemistry into the wood structure, usually before the treated wood is placed into outdoor, ground contact, freshwater, marine, utility, agricultural or structural service.
The industry is defined by the interaction between active chemistry, carrier system, treatment process and exposure class. Copper based systems such as ACQ, copper azole, micronized copper and copper HDO dominate much of the residential and commercial outdoor lumber market because copper provides broad fungal protection, while quaternary ammonium compounds, azoles or other cobiocides extend activity against insects and selected decay organisms. Borate preservatives, mainly disodium octaborate tetrahydrate and related boron compounds, are widely used where leaching risk is controlled, especially framing lumber, sill plates, sheathing, engineered wood and interior or protected structural components. Oil borne preservatives such as creosote and copper naphthenate remain important in heavy duty applications including railroad ties, utility poles, bridge timbers, marine piles and ground contact industrial wood. Organic solvent and organic biocide systems use azoles, isothiazolinones, DCOI, permethrin, imidacloprid and related active ingredients for millwork, joinery, aboveground wood, sapstain control, engineered wood and specialist applications where appearance, dimensional stability or lower metal loading is required. Chromated arsenicals, especially CCA, have lost most residential use in North America and Europe, yet remain relevant in permitted industrial uses and some regional markets because chromium fixation, copper fungicidal activity and arsenical insecticidal activity give high durability under severe exposure.
Commercial treatment is mainly carried out in pressure treatment cylinders using controlled vacuum, pressure, solution concentration, temperature, time and post treatment conditioning. The process forces preservative into the sapwood zone to meet specified retention and penetration targets for the intended use class. Waterborne copper and borate systems are usually supplied as concentrates or ready to dilute products and applied in aqueous solution. Oil borne and creosote systems use petroleum oil, coal tar distillate or oil type carriers and are selected where deep penetration, water resistance and long field life are more important than odor, color or handling profile. Organic solvent systems use lighter carriers and lower active loadings, often for appearance sensitive wood products. Manufacturing includes active ingredient synthesis or sourcing, concentrate blending, stabilization, corrosion control, fixation chemistry management, quality testing for assay and pH, and compatibility control with wood species, fasteners, adhesives, coatings and treatment equipment.
Read the full market overview
The value chain begins with copper compounds, borates, coal tar distillates, petroleum carriers, triazole fungicides, quaternary ammonium compounds, isothiazolinones, insecticides, emulsifiers, fixation aids and process additives. Formulators convert these materials into registered preservative systems, treatment plants impregnate wood to defined retention levels, and treated wood enters residential decking and fencing, commercial landscape and agricultural uses, utility distribution networks, railroad infrastructure, marine construction, transportation assets and heavy industrial timber. Regulation is central to the category because many wood preservatives are pesticide or biocidal products, and their permitted uses depend on active ingredient risk assessment, label restrictions, worker exposure controls, environmental release limits and disposal requirements. Current market development is therefore shaped by the replacement of arsenical and pentachlorophenol systems in many uses, wider adoption of copper azole and micronized copper, continued demand for creosote and copper naphthenate in heavy duty infrastructure, and stronger scrutiny of leaching, corrosion, worker safety and treated wood end of life management.
The global wood preservative treatment chemicals market generated USD 1,643.55 million in 2025 on sales of 537.80 kt, implying an average realized price of USD 3,056 per ton. Revenue fell 7.23% and volume fell 6.02% from 2024, extending a correction that began after the 2022-2023 pricing peak. The market reaches USD 1,752.33 million and 553.65 kt in 2026, then reach USD 2,141.78 million and 676.24 kt by 2032. Forecast revenue and volume CAGRs are nearly identical at 3.40% and 3.39%, respectively; the outlook is therefore volume-led instead of dependent on sustained price inflation.
The market is a heterogeneous preservative pool. Copper-based products represented 32.75% of 2025 volume but 49.19% of revenue because their average price, USD 4,590 per ton, was well above the market average. Creosote remained the largest chemistry by volume at 36.09%, but generated only 13.95% of revenue at USD 1,181 per ton. Arsenical systems accounted for 13.79% of volume and 15.67% of revenue. Organic biocides represented 11.94% of volume and 16.28% of revenue, while borates remained a stable 5% niche. This mix explains why chemistry substitution can change market value materially even when total treated tonnage moves slowly.
The forecast embeds a continued shift toward copper-based and organic-biocide systems. Copper-based revenue is projected to rise from USD 808.46 million in 2025 to USD 1,076.66 million in 2032, taking 50.27% of market value. Organic-biocide revenue is forecast to reach USD 390.02 million and 18.21% of the market, the fastest value growth among the principal chemistries. Creosote and arsenical products continue to grow in absolute value after 2026, but lose share as their addressable uses remain concentrated in heavy-duty and restricted industrial applications. Borates retain a narrow but durable position where protected-service conditions permit a low-cost, low-color treatment.
Demand is split between infrastructure wood and construction-linked treated lumber. Industrial, utility, and transportation applications consumed 270.89 kt in 2025, or 50.37% of volume, but generated 38.12% of revenue because the segment includes high-volume creosote-treated ties and other lower-priced heavy-duty systems. Residential applications generated the largest revenue pool at USD 650.68 million despite representing 30.42% of volume, reflecting a copper-rich mix and an average price of USD 3,977 per ton. Residential is also the fastest-growing major application through 2032, while industrial, utility, and transportation remains the anchor volume base.
North America is the controlling demand region. It accounted for 49.32% of global volume and 52.82% of revenue in 2025, and is projected to reach 51.88% of volume and 53.58% of revenue by 2032. Europe represented 18.49% of volume and 20.62% of revenue in 2025, supported by the highest regional average price among the major markets. China, Asia excluding China, and South America, the Middle East, and Africa collectively represented 32.19% of 2025 volume but only 26.56% of revenue. The forecast widens this value gap because North America and Europe grow faster than China and the combined emerging-region block.
Production is more concentrated than consumption. North America and Europe supplied 74.21% of global output in 2025, compared with 67.81% of global demand. North America produced 15.78 kt more than it consumed and Europe produced 18.68 kt more; Asia excluding China ran an 8.72 kt deficit, while South America, the Middle East, and Africa ran a 30.20 kt deficit. These balances are commercially important: regional market access depends not only on formulation ownership but also on freight economics, local concentrate dilution or tolling capability, inventory placement, and the ability to support treatment plants when imported supply is disrupted.
Supplier concentration is high at the top and fragmented below it. Koppers Holdings and Arxada generated 51.36% of global revenue and 48.60% of sales volume in 2025. Adding Viance, Lanxess, and Wolman Wood and Fire Protection GmbH lifts the top-five shares to 62.35% of revenue and 58.59% of volume. Koppers' revenue share exceeds its volume share because of a higher-value mix and broad exposure across copper-based residential systems and heavy-duty infrastructure preservatives. Arxada combines global wood-protection brands with copper, arsenical, DCOIT, borate, fire-retardant, and specialty systems. Below the leaders, regional suppliers compete through local registrations, treatment-plant relationships, technical service, niche chemistry, and lower logistics cost instead of scale alone.
Revenue rose to USD 1,807.63 million in 2023 as average price reached USD 3,110 per ton. Sales volume then declined to 537.80 kt in 2025 and average price settled at USD 3,056 per ton, reducing revenue to USD 1,643.55 million. The 2026 market records a recovery in throughput and price; the 2032 forecast maintains average price near USD 3,167 per ton.
Copper-based and organic-biocide products account for 79.9% of forecast revenue growth from 2026 to 2032. North America and Europe provide 81.3% of the global revenue increase. Supplier performance will depend on qualified product portfolios, copper and active-ingredient pass-through, treatment-plant penetration, supply continuity, and exposure to residential lumber, railroad ties, utility poles, and agricultural wood.
This report provides an overview of the global Wood Preservative Treatment Chemicals market in terms of sales, revenue, and price, analyzing global market trends using historical revenue and sales data for 2021-2025, estimates for 2026, and projected CAGRs through 2032.
The study covers key producers of Wood Preservative Treatment Chemicals and sales in major regions and countries, assesses future market potential, and highlights priority regions and countries for segmenting the market into sub-sectors, with country-specific market value data for the U.S., Canada, Mexico, Brazil, China, Japan, South Korea, Southeast Asia, India, Germany, the U.K., Italy, the Middle East, Africa, and other countries.
The report also presents Wood Preservative Treatment Chemicals sales, revenue, market share, and industry ranking for the main manufacturers for 2021-2026, identifies the major stakeholders in the global market, and analyzes their competitive landscape and market positioning based on recent developments and segmental revenues.
In addition, the report analyzes segment data by Type and Application—covering sales, revenue, and price—for 2021-2032, and evaluates and forecasts the Wood Preservative Treatment Chemicals market size, projected growth trends, production technologies, key applications, and end-use industries.
Wood Preservative Treatment Chemicals Segment by Company
Koppers Holdings
Arxada
Viance
Lanxess
Wolman Wood and Fire Protection GmbH
Dolphin Bay Chemicals
U.S. Borax
Osaka Gas Chemicals
Nisus Corporation
RÜTGERS Organics GmbH
Groupe Berkem
Kurt Obermeier GmbH
Remmers
Nippon Soda
Koshii Preserving
Chemipro Kasei Kaisha
Copper Care Wood Preservatives
Dainihon Wood Preserving
Sherwood Corporation
Janssen PMP
Wood Preservative Treatment Chemicals Segment by Type
Copper Based
Creosote Based
Arsenical Based
Organic Biocide Based
Borate Based
Wood Preservative Treatment Chemicals Segment by Application
Industrial, Utility and Transportation
Residential
Commercial and Agricultural
Wood Preservative Treatment Chemicals Segment by Region
North America
United States
Canada
Mexico
Europe
Germany
France
U.K.
Italy
Russia
Spain
Netherlands
Switzerland
Sweden
Poland
Asia-Pacific
China
Japan
South Korea
India
Australia
Taiwan
Southeast Asia
South America
Brazil
Argentina
Chile
Colombia
Middle East & Africa
Egypt
South Africa
Israel
Türkiye
GCC Countries
Study Objectives
1. To analyze and research the global Wood Preservative Treatment Chemicals status and future forecast, involving, sales, revenue, growth rate (CAGR), market share, historical and forecast.
2. To present the key manufacturers, sales, revenue, market share, and Recent Developments.
3. To split the breakdown data by regions, type, manufacturers, and Application.
4. To analyze the global and key regions Wood Preservative Treatment Chemicals market potential and advantage, opportunity and challenge, restraints, and risks.
5. To identify Wood Preservative Treatment Chemicals significant trends, drivers, influence factors in global and regions.
6. To analyze Wood Preservative Treatment Chemicals competitive developments such as expansions, agreements, new product launches, and acquisitions in the market.
Reasons to Buy This Report
1. This report will help the readers to understand the competition within the industries and strategies for the competitive environment to enhance the potential profit. The report also focuses on the competitive landscape of the global Wood Preservative Treatment Chemicals market, and introduces in detail the market share, industry ranking, competitor ecosystem, market performance, new product development, operation situation, expansion, and acquisition. etc. of the main players, which helps the readers to identify the main competitors and deeply understand the competition pattern of the market.
2. This report will help stakeholders to understand the global industry status and trends of Wood Preservative Treatment Chemicals and provides them with information on key market drivers, restraints, challenges, and opportunities.
3. This report will help stakeholders to understand competitors better and gain more insights to strengthen their position in their businesses. The competitive landscape section includes the market share and rank (in sales and value), competitor ecosystem, new product development, expansion, and acquisition.
4. This report stays updated with novel technology integration, features, and the latest developments in the market.
5. This report helps stakeholders to gain insights into which regions to target globally.
6. This report helps stakeholders to gain insights into the end-user perception concerning the adoption of Wood Preservative Treatment Chemicals.
7. This report helps stakeholders to identify some of the key players in the market and understand their valuable contribution.
Chapter Outline
Chapter 1: Provides an overview of the Wood Preservative Treatment Chemicals market, including product definition, global market growth prospects, sales value, sales volume, and average price forecasts (2021-2032).
Chapter 2: Analysis key trends, drivers, challenges, and opportunities within the global Wood Preservative Treatment Chemicals industry.
Chapter 3: Detailed analysis of Wood Preservative Treatment Chemicals manufacturers competitive landscape, price, sales and revenue market share, latest development plan, merger, and acquisition information, etc.
Chapter 4: Provides the analysis of various market segments by type, covering the market size and development potential of each market segment, to help readers find the blue ocean market in different market segments.
Chapter 5: Provides the analysis of various market segments by application, covering the market size and development potential of each market segment, to help readers find the blue ocean market in different downstream markets.
Chapter 6: Sales and value of Wood Preservative Treatment Chemicals in regional level. It provides a quantitative analysis of the market size and development potential of each region and introduces the market development, future development prospects, market space, and market size of each country in the world.
Chapter 7: Sales and value of Wood Preservative Treatment Chemicals in country level. It provides sigmate data by type, and by application for each country/region.
Chapter 8: Provides profiles of key players, introducing the basic situation of the main companies in the market in detail, including product sales, revenue, price, gross margin, product introduction, recent development, etc.
Chapter 9: Analysis of industrial chain, including the upstream and downstream of the industry.
Chapter 10: Concluding Insights.
More report detail
Tables and figures
Scope & coverage.
Types
- Copper Based
- Creosote Based
- Arsenical Based
- Organic Biocide Based
- Borate Based
Applications
- Industrial, Utility and Transportation
- Residential
- Commercial and Agricultural
Companies covered
- Koppers Holdings
- Arxada
- Viance
- Lanxess
- Wolman Wood and Fire Protection GmbH
- Dolphin Bay Chemicals
- U.S. Borax
- Osaka Gas Chemicals
- Nisus Corporation
- RÜTGERS Organics GmbH
- Groupe Berkem
- Kurt Obermeier GmbH
- Remmers
- Nippon Soda
- Koshii Preserving
- Chemipro Kasei Kaisha
- Copper Care Wood Preservatives
- Dainihon Wood Preserving
- Sherwood Corporation
- Janssen PMP
Inside the report.
1 Market Overview
- 1.1 Product Definition
- 1.2 Global Market Growth Prospects
- 1.2.1 Global Wood Preservative Treatment Chemicals Sales Value (2021-2032)
- 1.2.2 Global Wood Preservative Treatment Chemicals Sales Volume (2021-2032)
- 1.2.3 Global Wood Preservative Treatment Chemicals Sales Average Price (2021-2032)
- 1.3 Assumptions and Limitations
- 1.4 Study Goals and Objectives
2 Wood Preservative Treatment Chemicals Market Dynamics
- 2.1 Wood Preservative Treatment Chemicals Industry Trends
- 2.2 Wood Preservative Treatment Chemicals Industry Drivers
- 2.3 Wood Preservative Treatment Chemicals Industry Opportunities and Challenges
- 2.4 Wood Preservative Treatment Chemicals Industry Restraints
3 Wood Preservative Treatment Chemicals Market by Company
- 3.1 Global Wood Preservative Treatment Chemicals Company Revenue Ranking in 2025
- 3.2 Global Wood Preservative Treatment Chemicals Revenue by Company (2021-2026)
- 3.3 Global Wood Preservative Treatment Chemicals Sales Volume by Company (2021-2026)
- 3.4 Global Wood Preservative Treatment Chemicals Average Price by Company (2021-2026)
- 3.5 Global Wood Preservative Treatment Chemicals Company Ranking (2024-2026)
- 3.6 Global Wood Preservative Treatment Chemicals Company Manufacturing Base and Headquarters
- 3.7 Global Wood Preservative Treatment Chemicals Company Product Type and Application
- 3.8 Global Wood Preservative Treatment Chemicals Company Establishment Date
- 3.9 Market Competitive Analysis
- 3.9.1 Global Wood Preservative Treatment Chemicals Market Concentration Ratio (CR5 and HHI)
- 3.9.2 Global Top 5 and 10 Company Market Share by Revenue in 2025
- 3.9.3 2025 Wood Preservative Treatment Chemicals Tier 1, Tier 2, and Tier 3 Companies
- 3.10 Mergers and Acquisitions Expansion
4 Wood Preservative Treatment Chemicals Market by Type
- 4.1 Wood Preservative Treatment Chemicals Type Introduction
- 4.1.1 Copper Based
- 4.1.2 Creosote Based
- 4.1.3 Arsenical Based
- 4.1.4 Organic Biocide Based
- 4.1.5 Borate Based
- 4.2 Global Wood Preservative Treatment Chemicals Sales Volume by Type
- 4.2.1 Global Wood Preservative Treatment Chemicals Sales Volume by Type (2021 VS 2025 VS 2032)
- 4.2.2 Global Wood Preservative Treatment Chemicals Sales Volume by Type (2021-2032)
- 4.2.3 Global Wood Preservative Treatment Chemicals Sales Volume Share by Type (2021-2032)
- 4.3 Global Wood Preservative Treatment Chemicals Sales Value by Type
- 4.3.1 Global Wood Preservative Treatment Chemicals Sales Value by Type (2021 VS 2025 VS 2032)
- 4.3.2 Global Wood Preservative Treatment Chemicals Sales Value by Type (2021-2032)
- 4.3.3 Global Wood Preservative Treatment Chemicals Sales Value Share by Type (2021-2032)
5 Wood Preservative Treatment Chemicals Market by Application
- 5.1 Wood Preservative Treatment Chemicals Application Introduction
- 5.1.1 Industrial, Utility and Transportation
- 5.1.2 Residential
- 5.1.3 Commercial and Agricultural
- 5.2 Global Wood Preservative Treatment Chemicals Sales Volume by Application
- 5.2.1 Global Wood Preservative Treatment Chemicals Sales Volume by Application (2021 VS 2025 VS 2032)
- 5.2.2 Global Wood Preservative Treatment Chemicals Sales Volume by Application (2021-2032)
- 5.2.3 Global Wood Preservative Treatment Chemicals Sales Volume Share by Application (2021-2032)
- 5.3 Global Wood Preservative Treatment Chemicals Sales Value by Application
- 5.3.1 Global Wood Preservative Treatment Chemicals Sales Value by Application (2021 VS 2025 VS 2032)
- 5.3.2 Global Wood Preservative Treatment Chemicals Sales Value by Application (2021-2032)
- 5.3.3 Global Wood Preservative Treatment Chemicals Sales Value Share by Application (2021-2032)
6 Wood Preservative Treatment Chemicals Regional Sales and Value Analysis
- 6.1 Global Wood Preservative Treatment Chemicals Sales by Region: 2021 VS 2025 VS 2032
- 6.2 Global Wood Preservative Treatment Chemicals Sales by Region (2021-2032)
- 6.2.1 Global Wood Preservative Treatment Chemicals Sales by Region: 2021-2026
- 6.2.2 Global Wood Preservative Treatment Chemicals Sales by Region (2027-2032)
- 6.3 Global Wood Preservative Treatment Chemicals Sales Value by Region: 2021 VS 2025 VS 2032
- 6.4 Global Wood Preservative Treatment Chemicals Sales Value by Region (2021-2032)
- 6.4.1 Global Wood Preservative Treatment Chemicals Sales Value by Region: 2021-2026
- 6.4.2 Global Wood Preservative Treatment Chemicals Sales Value by Region (2027-2032)
- 6.5 Global Wood Preservative Treatment Chemicals Market Price Analysis by Region (2021-2026)
- 6.6 North America
- 6.6.1 North America Wood Preservative Treatment Chemicals Sales Value (2021-2032)
- 6.6.2 North America Wood Preservative Treatment Chemicals Sales Value Share by Country, 2025 VS 2032
- 6.7 Europe
- 6.7.1 Europe Wood Preservative Treatment Chemicals Sales Value (2021-2032)
- 6.7.2 Europe Wood Preservative Treatment Chemicals Sales Value Share by Country, 2025 VS 2032
- 6.8 Asia-Pacific
- 6.8.1 Asia-Pacific Wood Preservative Treatment Chemicals Sales Value (2021-2032)
- 6.8.2 Asia-Pacific Wood Preservative Treatment Chemicals Sales Value Share by Country, 2025 VS 2032
- 6.9 South America
- 6.9.1 South America Wood Preservative Treatment Chemicals Sales Value (2021-2032)
- 6.9.2 South America Wood Preservative Treatment Chemicals Sales Value Share by Country, 2025 VS 2032
- 6.10 Middle East & Africa
- 6.10.1 Middle East & Africa Wood Preservative Treatment Chemicals Sales Value (2021-2032)
- 6.10.2 Middle East & Africa Wood Preservative Treatment Chemicals Sales Value Share by Country, 2025 VS 2032
7 Wood Preservative Treatment Chemicals Country-level Sales and Value Analysis
- 7.1 Global Wood Preservative Treatment Chemicals Sales by Country: 2021 VS 2025 VS 2032
- 7.2 Global Wood Preservative Treatment Chemicals Sales Value by Country: 2021 VS 2025 VS 2032
- 7.3 Global Wood Preservative Treatment Chemicals Sales by Country (2021-2032)
- 7.3.1 Global Wood Preservative Treatment Chemicals Sales by Country (2021-2026)
- 7.3.2 Global Wood Preservative Treatment Chemicals Sales by Country (2027-2032)
- 7.4 Global Wood Preservative Treatment Chemicals Sales Value by Country (2021-2032)
- 7.4.1 Global Wood Preservative Treatment Chemicals Sales Value by Country (2021-2026)
- 7.4.2 Global Wood Preservative Treatment Chemicals Sales Value by Country (2027-2032)
- 7.5 USA
- 7.5.1 USA Wood Preservative Treatment Chemicals Sales Value Growth Rate (2021-2032)
- 7.5.2 USA Wood Preservative Treatment Chemicals Sales Value Share by Type, 2025 VS 2032
- 7.5.3 USA Wood Preservative Treatment Chemicals Sales Value Share by Application, 2025 VS 2032
- 7.6 Canada
- 7.6.1 Canada Wood Preservative Treatment Chemicals Sales Value Growth Rate (2021-2032)
- 7.6.2 Canada Wood Preservative Treatment Chemicals Sales Value Share by Type, 2025 VS 2032
- 7.6.3 Canada Wood Preservative Treatment Chemicals Sales Value Share by Application, 2025 VS 2032
- 7.7 Mexico
- 7.6.1 Mexico Wood Preservative Treatment Chemicals Sales Value Growth Rate (2021-2032)
- 7.6.2 Mexico Wood Preservative Treatment Chemicals Sales Value Share by Type, 2025 VS 2032
- 7.6.3 Mexico Wood Preservative Treatment Chemicals Sales Value Share by Application, 2025 VS 2032
- 7.8 Germany
- 7.8.1 Germany Wood Preservative Treatment Chemicals Sales Value Growth Rate (2021-2032)
- 7.8.2 Germany Wood Preservative Treatment Chemicals Sales Value Share by Type, 2025 VS 2032
- 7.8.3 Germany Wood Preservative Treatment Chemicals Sales Value Share by Application, 2025 VS 2032
- 7.9 France
- 7.9.1 France Wood Preservative Treatment Chemicals Sales Value Growth Rate (2021-2032)
- 7.9.2 France Wood Preservative Treatment Chemicals Sales Value Share by Type, 2025 VS 2032
- 7.9.3 France Wood Preservative Treatment Chemicals Sales Value Share by Application, 2025 VS 2032
- 7.10 U.K.
- 7.10.1 U.K. Wood Preservative Treatment Chemicals Sales Value Growth Rate (2021-2032)
- 7.10.2 U.K. Wood Preservative Treatment Chemicals Sales Value Share by Type, 2025 VS 2032
- 7.10.3 U.K. Wood Preservative Treatment Chemicals Sales Value Share by Application, 2025 VS 2032
- 7.11 Italy
- 7.11.1 Italy Wood Preservative Treatment Chemicals Sales Value Growth Rate (2021-2032)
- 7.11.2 Italy Wood Preservative Treatment Chemicals Sales Value Share by Type, 2025 VS 2032
- 7.11.3 Italy Wood Preservative Treatment Chemicals Sales Value Share by Application, 2025 VS 2032
- 7.12 Spain
- 7.12.1 Spain Wood Preservative Treatment Chemicals Sales Value Growth Rate (2021-2032)
- 7.12.2 Spain Wood Preservative Treatment Chemicals Sales Value Share by Type, 2025 VS 2032
- 7.12.3 Spain Wood Preservative Treatment Chemicals Sales Value Share by Application, 2025 VS 2032
- 7.13 Russia
- 7.13.1 Russia Wood Preservative Treatment Chemicals Sales Value Growth Rate (2021-2032)
- 7.13.2 Russia Wood Preservative Treatment Chemicals Sales Value Share by Type, 2025 VS 2032
- 7.13.3 Russia Wood Preservative Treatment Chemicals Sales Value Share by Application, 2025 VS 2032
- 7.14 Netherlands
- 7.14.1 Netherlands Wood Preservative Treatment Chemicals Sales Value Growth Rate (2021-2032)
- 7.14.2 Netherlands Wood Preservative Treatment Chemicals Sales Value Share by Type, 2025 VS 2032
- 7.14.3 Netherlands Wood Preservative Treatment Chemicals Sales Value Share by Application, 2025 VS 2032
- 7.15 Nordic Countries
- 7.15.1 Nordic Countries Wood Preservative Treatment Chemicals Sales Value Growth Rate (2021-2032)
- 7.15.2 Nordic Countries Wood Preservative Treatment Chemicals Sales Value Share by Type, 2025 VS 2032
- 7.15.3 Nordic Countries Wood Preservative Treatment Chemicals Sales Value Share by Application, 2025 VS 2032
- 7.16 China
- 7.16.1 China Wood Preservative Treatment Chemicals Sales Value Growth Rate (2021-2032)
- 7.16.2 China Wood Preservative Treatment Chemicals Sales Value Share by Type, 2025 VS 2032
- 7.16.3 China Wood Preservative Treatment Chemicals Sales Value Share by Application, 2025 VS 2032
- 7.17 Japan
- 7.17.1 Japan Wood Preservative Treatment Chemicals Sales Value Growth Rate (2021-2032)
- 7.17.2 Japan Wood Preservative Treatment Chemicals Sales Value Share by Type, 2025 VS 2032
- 7.17.3 Japan Wood Preservative Treatment Chemicals Sales Value Share by Application, 2025 VS 2032
- 7.18 South Korea
- 7.18.1 South Korea Wood Preservative Treatment Chemicals Sales Value Growth Rate (2021-2032)
- 7.18.2 South Korea Wood Preservative Treatment Chemicals Sales Value Share by Type, 2025 VS 2032
- 7.18.3 South Korea Wood Preservative Treatment Chemicals Sales Value Share by Application, 2025 VS 2032
- 7.19 India
- 7.19.1 India Wood Preservative Treatment Chemicals Sales Value Growth Rate (2021-2032)
- 7.19.2 India Wood Preservative Treatment Chemicals Sales Value Share by Type, 2025 VS 2032
- 7.19.3 India Wood Preservative Treatment Chemicals Sales Value Share by Application, 2025 VS 2032
- 7.20 Australia
- 7.20.1 Australia Wood Preservative Treatment Chemicals Sales Value Growth Rate (2021-2032)
- 7.20.2 Australia Wood Preservative Treatment Chemicals Sales Value Share by Type, 2025 VS 2032
- 7.20.3 Australia Wood Preservative Treatment Chemicals Sales Value Share by Application, 2025 VS 2032
- 7.21 Southeast Asia
- 7.21.1 Southeast Asia Wood Preservative Treatment Chemicals Sales Value Growth Rate (2021-2032)
- 7.21.2 Southeast Asia Wood Preservative Treatment Chemicals Sales Value Share by Type, 2025 VS 2032
- 7.21.3 Southeast Asia Wood Preservative Treatment Chemicals Sales Value Share by Application, 2025 VS 2032
- 7.22 Brazil
- 7.22.1 Brazil Wood Preservative Treatment Chemicals Sales Value Growth Rate (2021-2032)
- 7.22.2 Brazil Wood Preservative Treatment Chemicals Sales Value Share by Type, 2025 VS 2032
- 7.22.3 Brazil Wood Preservative Treatment Chemicals Sales Value Share by Application, 2025 VS 2032
- 7.23 Argentina
- 7.23.1 Argentina Wood Preservative Treatment Chemicals Sales Value Growth Rate (2021-2032)
- 7.23.2 Argentina Wood Preservative Treatment Chemicals Sales Value Share by Type, 2025 VS 2032
- 7.23.3 Argentina Wood Preservative Treatment Chemicals Sales Value Share by Application, 2025 VS 2032
- 7.24 Chile
- 7.24.1 Chile Wood Preservative Treatment Chemicals Sales Value Growth Rate (2021-2032)
- 7.24.2 Chile Wood Preservative Treatment Chemicals Sales Value Share by Type, 2025 VS 2032
- 7.24.3 Chile Wood Preservative Treatment Chemicals Sales Value Share by Application, 2025 VS 2032
- 7.25 Colombia
- 7.25.1 Colombia Wood Preservative Treatment Chemicals Sales Value Growth Rate (2021-2032)
- 7.25.2 Colombia Wood Preservative Treatment Chemicals Sales Value Share by Type, 2025 VS 2032
- 7.25.3 Colombia Wood Preservative Treatment Chemicals Sales Value Share by Application, 2025 VS 2032
- 7.26 Peru
- 7.26.1 Peru Wood Preservative Treatment Chemicals Sales Value Growth Rate (2021-2032)
- 7.26.2 Peru Wood Preservative Treatment Chemicals Sales Value Share by Type, 2025 VS 2032
- 7.26.3 Peru Wood Preservative Treatment Chemicals Sales Value Share by Application, 2025 VS 2032
- 7.27 Saudi Arabia
- 7.27.1 Saudi Arabia Wood Preservative Treatment Chemicals Sales Value Growth Rate (2021-2032)
- 7.27.2 Saudi Arabia Wood Preservative Treatment Chemicals Sales Value Share by Type, 2025 VS 2032
- 7.27.3 Saudi Arabia Wood Preservative Treatment Chemicals Sales Value Share by Application, 2025 VS 2032
- 7.28 Israel
- 7.28.1 Israel Wood Preservative Treatment Chemicals Sales Value Growth Rate (2021-2032)
- 7.28.2 Israel Wood Preservative Treatment Chemicals Sales Value Share by Type, 2025 VS 2032
- 7.28.3 Israel Wood Preservative Treatment Chemicals Sales Value Share by Application, 2025 VS 2032
- 7.29 UAE
- 7.29.1 UAE Wood Preservative Treatment Chemicals Sales Value Growth Rate (2021-2032)
- 7.29.2 UAE Wood Preservative Treatment Chemicals Sales Value Share by Type, 2025 VS 2032
- 7.29.3 UAE Wood Preservative Treatment Chemicals Sales Value Share by Application, 2025 VS 2032
- 7.30 Turkey
- 7.30.1 Turkey Wood Preservative Treatment Chemicals Sales Value Growth Rate (2021-2032)
- 7.30.2 Turkey Wood Preservative Treatment Chemicals Sales Value Share by Type, 2025 VS 2032
- 7.30.3 Turkey Wood Preservative Treatment Chemicals Sales Value Share by Application, 2025 VS 2032
- 7.31 Iran
- 7.31.1 Iran Wood Preservative Treatment Chemicals Sales Value Growth Rate (2021-2032)
- 7.31.2 Iran Wood Preservative Treatment Chemicals Sales Value Share by Type, 2025 VS 2032
- 7.31.3 Iran Wood Preservative Treatment Chemicals Sales Value Share by Application, 2025 VS 2032
- 7.32 Egypt
- 7.32.1 Egypt Wood Preservative Treatment Chemicals Sales Value Growth Rate (2021-2032)
- 7.32.2 Egypt Wood Preservative Treatment Chemicals Sales Value Share by Type, 2025 VS 2032
- 7.32.3 Egypt Wood Preservative Treatment Chemicals Sales Value Share by Application, 2025 VS 2032
8 Company Profiles
- 8.1 Koppers Holdings
- 8.1.1 Koppers Holdings Company Information
- 8.1.2 Koppers Holdings Business Overview
- 8.1.3 Koppers Holdings Wood Preservative Treatment Chemicals Sales, Value and Gross Margin (2021-2026)
- 8.1.4 Koppers Holdings Wood Preservative Treatment Chemicals Product Portfolio
- 8.1.5 Koppers Holdings Recent Developments
- 8.2 Arxada
- 8.2.1 Arxada Company Information
- 8.2.2 Arxada Business Overview
- 8.2.3 Arxada Wood Preservative Treatment Chemicals Sales, Value and Gross Margin (2021-2026)
- 8.2.4 Arxada Wood Preservative Treatment Chemicals Product Portfolio
- 8.2.5 Arxada Recent Developments
- 8.3 Viance
- 8.3.1 Viance Company Information
- 8.3.2 Viance Business Overview
- 8.3.3 Viance Wood Preservative Treatment Chemicals Sales, Value and Gross Margin (2021-2026)
- 8.3.4 Viance Wood Preservative Treatment Chemicals Product Portfolio
- 8.3.5 Viance Recent Developments
- 8.4 Lanxess
- 8.4.1 Lanxess Company Information
- 8.4.2 Lanxess Business Overview
- 8.4.3 Lanxess Wood Preservative Treatment Chemicals Sales, Value and Gross Margin (2021-2026)
- 8.4.4 Lanxess Wood Preservative Treatment Chemicals Product Portfolio
- 8.4.5 Lanxess Recent Developments
- 8.5 Wolman Wood and Fire Protection GmbH
- 8.5.1 Wolman Wood and Fire Protection GmbH Company Information
- 8.5.2 Wolman Wood and Fire Protection GmbH Business Overview
- 8.5.3 Wolman Wood and Fire Protection GmbH Wood Preservative Treatment Chemicals Sales, Value and Gross Margin (2021-2026)
- 8.5.4 Wolman Wood and Fire Protection GmbH Wood Preservative Treatment Chemicals Product Portfolio
- 8.5.5 Wolman Wood and Fire Protection GmbH Recent Developments
- 8.6 Dolphin Bay Chemicals
- 8.6.1 Dolphin Bay Chemicals Company Information
- 8.6.2 Dolphin Bay Chemicals Business Overview
- 8.6.3 Dolphin Bay Chemicals Wood Preservative Treatment Chemicals Sales, Value and Gross Margin (2021-2026)
- 8.6.4 Dolphin Bay Chemicals Wood Preservative Treatment Chemicals Product Portfolio
- 8.6.5 Dolphin Bay Chemicals Recent Developments
- 8.7 U.S. Borax
- 8.7.1 U.S. Borax Company Information
- 8.7.2 U.S. Borax Business Overview
- 8.7.3 U.S. Borax Wood Preservative Treatment Chemicals Sales, Value and Gross Margin (2021-2026)
- 8.7.4 U.S. Borax Wood Preservative Treatment Chemicals Product Portfolio
- 8.7.5 U.S. Borax Recent Developments
- 8.8 Osaka Gas Chemicals
- 8.8.1 Osaka Gas Chemicals Company Information
- 8.8.2 Osaka Gas Chemicals Business Overview
- 8.8.3 Osaka Gas Chemicals Wood Preservative Treatment Chemicals Sales, Value and Gross Margin (2021-2026)
- 8.8.4 Osaka Gas Chemicals Wood Preservative Treatment Chemicals Product Portfolio
- 8.8.5 Osaka Gas Chemicals Recent Developments
- 8.9 Nisus Corporation
- 8.9.1 Nisus Corporation Company Information
- 8.9.2 Nisus Corporation Business Overview
- 8.9.3 Nisus Corporation Wood Preservative Treatment Chemicals Sales, Value and Gross Margin (2021-2026)
- 8.9.4 Nisus Corporation Wood Preservative Treatment Chemicals Product Portfolio
- 8.9.5 Nisus Corporation Recent Developments
- 8.10 RÜTGERS Organics GmbH
- 8.10.1 RÜTGERS Organics GmbH Company Information
- 8.10.2 RÜTGERS Organics GmbH Business Overview
- 8.10.3 RÜTGERS Organics GmbH Wood Preservative Treatment Chemicals Sales, Value and Gross Margin (2021-2026)
- 8.10.4 RÜTGERS Organics GmbH Wood Preservative Treatment Chemicals Product Portfolio
- 8.10.5 RÜTGERS Organics GmbH Recent Developments
- 8.11 Groupe Berkem
- 8.11.1 Groupe Berkem Company Information
- 8.11.2 Groupe Berkem Business Overview
- 8.11.3 Groupe Berkem Wood Preservative Treatment Chemicals Sales, Value and Gross Margin (2021-2026)
- 8.11.4 Groupe Berkem Wood Preservative Treatment Chemicals Product Portfolio
- 8.11.5 Groupe Berkem Recent Developments
- 8.12 Kurt Obermeier GmbH
- 8.12.1 Kurt Obermeier GmbH Company Information
- 8.12.2 Kurt Obermeier GmbH Business Overview
- 8.12.3 Kurt Obermeier GmbH Wood Preservative Treatment Chemicals Sales, Value and Gross Margin (2021-2026)
- 8.12.4 Kurt Obermeier GmbH Wood Preservative Treatment Chemicals Product Portfolio
- 8.12.5 Kurt Obermeier GmbH Recent Developments
- 8.13 Remmers
- 8.13.1 Remmers Company Information
- 8.13.2 Remmers Business Overview
- 8.13.3 Remmers Wood Preservative Treatment Chemicals Sales, Value and Gross Margin (2021-2026)
- 8.13.4 Remmers Wood Preservative Treatment Chemicals Product Portfolio
- 8.13.5 Remmers Recent Developments
- 8.14 Nippon Soda
- 8.14.1 Nippon Soda Company Information
- 8.14.2 Nippon Soda Business Overview
- 8.14.3 Nippon Soda Wood Preservative Treatment Chemicals Sales, Value and Gross Margin (2021-2026)
- 8.14.4 Nippon Soda Wood Preservative Treatment Chemicals Product Portfolio
- 8.14.5 Nippon Soda Recent Developments
- 8.15 Koshii Preserving
- 8.15.1 Koshii Preserving Company Information
- 8.15.2 Koshii Preserving Business Overview
- 8.15.3 Koshii Preserving Wood Preservative Treatment Chemicals Sales, Value and Gross Margin (2021-2026)
- 8.15.4 Koshii Preserving Wood Preservative Treatment Chemicals Product Portfolio
- 8.15.5 Koshii Preserving Recent Developments
- 8.16 Chemipro Kasei Kaisha
- 8.16.1 Chemipro Kasei Kaisha Company Information
- 8.16.2 Chemipro Kasei Kaisha Business Overview
- 8.16.3 Chemipro Kasei Kaisha Wood Preservative Treatment Chemicals Sales, Value and Gross Margin (2021-2026)
- 8.16.4 Chemipro Kasei Kaisha Wood Preservative Treatment Chemicals Product Portfolio
- 8.16.5 Chemipro Kasei Kaisha Recent Developments
- 8.17 Copper Care Wood Preservatives
- 8.17.1 Copper Care Wood Preservatives Company Information
- 8.17.2 Copper Care Wood Preservatives Business Overview
- 8.17.3 Copper Care Wood Preservatives Wood Preservative Treatment Chemicals Sales, Value and Gross Margin (2021-2026)
- 8.17.4 Copper Care Wood Preservatives Wood Preservative Treatment Chemicals Product Portfolio
- 8.17.5 Copper Care Wood Preservatives Recent Developments
- 8.18 Dainihon Wood Preserving
- 8.18.1 Dainihon Wood Preserving Company Information
- 8.18.2 Dainihon Wood Preserving Business Overview
- 8.18.3 Dainihon Wood Preserving Wood Preservative Treatment Chemicals Sales, Value and Gross Margin (2021-2026)
- 8.18.4 Dainihon Wood Preserving Wood Preservative Treatment Chemicals Product Portfolio
- 8.18.5 Dainihon Wood Preserving Recent Developments
- 8.19 Sherwood Corporation
- 8.19.1 Sherwood Corporation Company Information
- 8.19.2 Sherwood Corporation Business Overview
- 8.19.3 Sherwood Corporation Wood Preservative Treatment Chemicals Sales, Value and Gross Margin (2021-2026)
- 8.19.4 Sherwood Corporation Wood Preservative Treatment Chemicals Product Portfolio
- 8.19.5 Sherwood Corporation Recent Developments
- 8.20 Janssen PMP
- 8.20.1 Janssen PMP Company Information
- 8.20.2 Janssen PMP Business Overview
- 8.20.3 Janssen PMP Wood Preservative Treatment Chemicals Sales, Value and Gross Margin (2021-2026)
- 8.20.4 Janssen PMP Wood Preservative Treatment Chemicals Product Portfolio
- 8.20.5 Janssen PMP Recent Developments
9 Value Chain and Sales Channels Analysis
- 9.1 Wood Preservative Treatment Chemicals Value Chain Analysis
- 9.1.1 Wood Preservative Treatment Chemicals Key Raw Materials
- 9.1.2 Raw Materials Key Suppliers
- 9.1.3 Manufacturing Cost Structure
- 9.1.4 Wood Preservative Treatment Chemicals Sales Mode & Process
- 9.2 Wood Preservative Treatment Chemicals Sales Channels Analysis
- 9.2.1 Direct Comparison with Distribution Share
- 9.2.2 Wood Preservative Treatment Chemicals Distributors
- 9.2.3 Wood Preservative Treatment Chemicals Customers
10 Concluding Insights
11 Appendix
- 11.1 Reasons for Doing This Study
- 11.2 Research Methodology
- 11.3 Research Process
- 11.4 Authors List of This Report
- 11.5 Data Source
- 11.5.1 Secondary Sources
- 11.5.2 Primary Sources
GET THE RESEARCH
Choose your license.
Choose who needs access.
All options are for this report and research series.
PDF by email within 3–5 working days after payment confirmation.
Talk to an analyst