
APO RESEARCH · REPORT
AI Toys
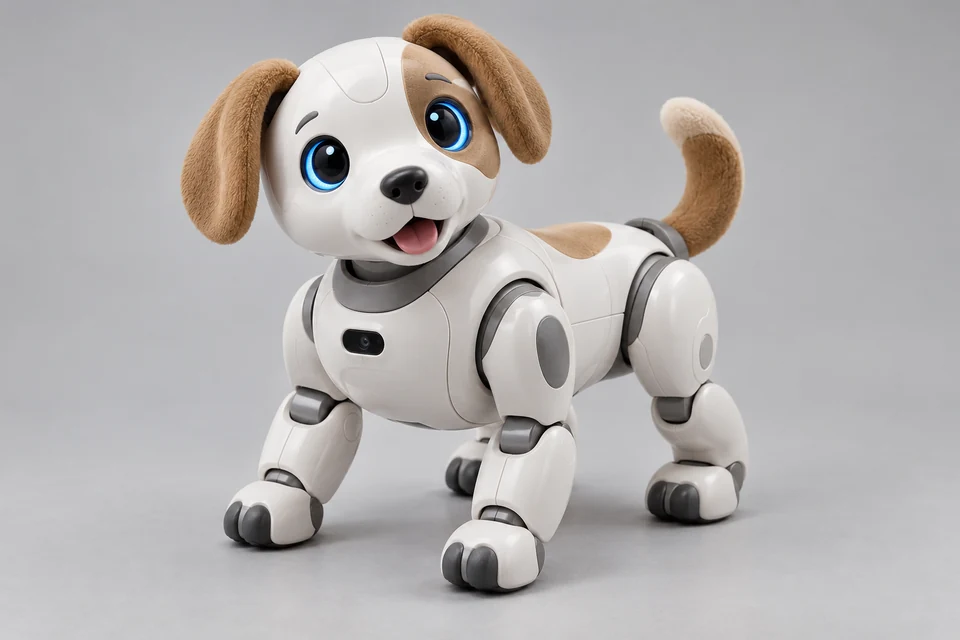
AI toys incorporate computation to respond to input through a defined play interaction.
Product & engineering
Understand the product.
AI Toys are physical play objects in which artificial intelligence interprets user input, environmental signals or interaction history and generates context responsive behavior. Their functional architecture links sensors, computational models, memory and controlled outputs, enabling speech, movement, expression, game decisions or learning activities to vary according to observed conditions. The distinguishing technical property is computational inference that selects, adapts or generates responses beyond a fixed sequence of prerecorded actions.
AI functions may include speech and image recognition, natural language processing, machine learning, computer vision, planning, generative models and adaptive behavioral control. Inputs are commonly acquired through microphones, cameras, touch sensors, motion sensors or connected devices, while responses are expressed through speech, displays, lighting, mechanical movement or digital content. Computation may reside within the toy, operate through connected cloud infrastructure or be distributed between them. AI Toys encompass companion, educational and gaming forms, with intelligence expressed respectively through social interaction, adaptive learning activity or responsive play and competition.
The finished product is defined by the task it performs, its construction and the user interface. Accessories, complete products and repair or subscription services can share a use case while remaining different transaction objects.
What turns activity into demand
Active users, fitted products and replacement cycles connect use to purchases. Accessories, the main product and paid services may be related but should retain distinct transaction boundaries.
The commercial boundary
For AI Toys, distinguish the supplied product from its inputs and the complete application. Report types and applications may overlap; retain the selected edition's product definition, geography, period, unit and transaction basis when comparing estimates.
What defines the supplied ai toys offering?
AI toys incorporate computation to respond to input through a defined play interaction. Check the actual load, fit, material, service life and interface requirements. Product count, installed stock and replacement activity should be reconciled; a visual resemblance or marketing class does not make products technically equivalent.
Selected research
Market Outlook & Growth Opportunities
Global AI Toys Market Outlook and Growth Opportunities 2026
Market perspective
According to APO Research, Inc, global AI Toys revenue is estimated at 8,119.95 MUSD in 2025 and projected to reach 9,743.94 MUSD in 2026 and 25,020.45 MUSD by 2032, representing a CAGR of 17.02% from 2026 to 2032. Demand encompasses conversational play, adaptive educational activities, physical board games and robotic interaction. These applications have different purchasing economics. Conversational toys depend on character appeal and sustained engagement, educational products require suitable learning content, and robotic products must deliver sufficient interaction quality to justify additional mechanical cost. Revenue growth consequently depends on both unit expansion and the changing mix of products across these applications.
Manufacturer activity illustrates the different routes to commercialization. Haivivi combines conversational electronics with plush toys and licensed characters, while Robopoet works with Tuya on connected emotional companions. SenseRobot integrates game algorithms, visual recognition and robotic manipulation into physical board games. Makeblock incorporates speech and visual recognition into coding activities. Mattel’s collaboration with OpenAI adds established toy brands and content development capabilities to this competitive environment. Across these approaches, access to AI models is one component of product development. Character consistency, interaction reliability, content quality and distribution remain separate commercial requirements.
Hardware architecture determines manufacturing cost and the obligations that follow a sale. Conversational plush products require audio electronics, connectivity, power management and durable integration with the textile enclosure. Motorized robots add actuators, transmissions, sensors and assembly requirements. Connected products also incur continuing expenditure on inference, voice services, software maintenance and content management. Bundling extended access into the purchase price increases the importance of forecasting usage and service costs over the product’s operating life. High engagement can improve customer retention while increasing the cost of fulfilling the original sale.
Full market overview
China’s electronics and toy manufacturing supply chains facilitate the integration of modules, molded components, textiles and final assembly. Overseas expansion adds language adaptation, regional content, distribution and aftersales requirements. Household purchases and institutional procurement also create different sales patterns: household demand depends on individual product appeal, while educational procurement requires teaching suitability and ongoing technical assistance. Sustaining the projected growth requires commercially successful products beyond initial launches, reliable replenishment orders and service arrangements that remain viable as the installed base expands.
This report provides an overview of the global AI Toys market in terms of sales, revenue, and price, analyzing global market trends using historical revenue and sales data for 2021-2025, estimates for 2026, and projected CAGRs through 2032.
The study covers key producers of AI Toys and sales in major regions and countries, assesses future market potential, and highlights priority regions and countries for segmenting the market into sub-sectors, with country-specific market value data for the U.S., Canada, Mexico, Brazil, China, Japan, South Korea, Southeast Asia, India, Germany, the U.K., Italy, the Middle East, Africa, and other countries.
The report also presents AI Toys sales, revenue, market share, and industry ranking for the main manufacturers for 2021-2026, identifies the major stakeholders in the global market, and analyzes their competitive landscape and market positioning based on recent developments and segmental revenues.
In addition, the report analyzes segment data by Type and Application—covering sales, revenue, and price—for 2021-2032, and evaluates and forecasts the AI Toys market size, projected growth trends, production technologies, key applications, and end-use industries.
AI Toys Segment by Company
- Sony
- Panasonic
- Sharp
- Casio
- MIXI
- Alpha Group
- UBTECH Robotics
- Zhejiang Jinke Tom Culture Industry
- Shifeng Cultural Development
- Makeblock
- Robosen Robotics
- SenseRobot
- Matatalab
- Miko
- GROOVE X
- KEYi Tech
- Elephant Robotics
- Haivivi
- Robopoet
- Yukai Engineering
- Ropet
- LivingAI
- Energize Lab
- Shanghai SiliconPear Technology
- Curio Interactive
- Robotical
AI Toys Segment by Type
- AI Companion Toys
- AI Educational Toys
- AI Gaming Toys
AI Toys Segment by Application
- Households
- Educational Institutions
- Care Facilities
- Other Settings
AI Toys Segment by Region
- North America
- United States
- Canada
- Mexico
- Europe
- Germany
- France
- U.K.
- Italy
- Russia
- Spain
- Netherlands
- Switzerland
- Sweden
- Poland
- Asia-Pacific
- China
- Japan
- South Korea
- India
- Australia
- Taiwan
- Southeast Asia
- South America
- Brazil
- Argentina
- Chile
- Colombia
- Middle East & Africa
- Egypt
- South Africa
- Israel
- Türkiye
- GCC Countries
Study Objectives
- To analyze and research the global AI Toys status and future forecast, involving, sales, revenue, growth rate (CAGR), market share, historical and forecast.
- To present the key manufacturers, sales, revenue, market share, and Recent Developments.
- To split the breakdown data by regions, type, manufacturers, and Application.
- To analyze the global and key regions AI Toys market potential and advantage, opportunity and challenge, restraints, and risks.
- To identify AI Toys significant trends, drivers, influence factors in global and regions.
- To analyze AI Toys competitive developments such as expansions, agreements, new product launches, and acquisitions in the market.
Reasons to Buy This Report
- This report will help the readers to understand the competition within the industries and strategies for the competitive environment to enhance the potential profit. The report also focuses on the competitive landscape of the global AI Toys market, and introduces in detail the market share, industry ranking, competitor ecosystem, market performance, new product development, operation situation, expansion, and acquisition. etc. of the main players, which helps the readers to identify the main competitors and deeply understand the competition pattern of the market.
- This report will help stakeholders to understand the global industry status and trends of AI Toys and provides them with information on key market drivers, restraints, challenges, and opportunities.
- This report will help stakeholders to understand competitors better and gain more insights to strengthen their position in their businesses. The competitive landscape section includes the market share and rank (in sales and value), competitor ecosystem, new product development, expansion, and acquisition.
- This report stays updated with novel technology integration, features, and the latest developments in the market.
- This report helps stakeholders to gain insights into which regions to target globally.
- This report helps stakeholders to gain insights into the end-user perception concerning the adoption of AI Toys.
- This report helps stakeholders to identify some of the key players in the market and understand their valuable contribution.
Chapter Outline
- Chapter 1: Provides an overview of the AI Toys market, including product definition, global market growth prospects, sales value, sales volume, and average price forecasts (2021-2032).
- Chapter 2: Analysis key trends, drivers, challenges, and opportunities within the global AI Toys industry.
- Chapter 3: Detailed analysis of AI Toys manufacturers competitive landscape, price, sales and revenue market share, latest development plan, merger, and acquisition information, etc.
- Chapter 4: Provides the analysis of various market segments by type, covering the market size and development potential of each market segment, to help readers find the blue ocean market in different market segments.
- Chapter 5: Provides the analysis of various market segments by application, covering the market size and development potential of each market segment, to help readers find the blue ocean market in different downstream markets.
- Chapter 6: Sales and value of AI Toys in regional level. It provides a quantitative analysis of the market size and development potential of each region and introduces the market development, future development prospects, market space, and market size of each country in the world.
- Chapter 7: Sales and value of AI Toys in country level. It provides sigmate data by type, and by application for each country/region.
- Chapter 8: Provides profiles of key players, introducing the basic situation of the main companies in the market in detail, including product sales, revenue, price, gross margin, product introduction, recent development, etc.
- Chapter 9: Analysis of industrial chain, including the upstream and downstream of the industry.
- Chapter 10: Concluding Insights.
More report detail
Tables and figures
List of Tables
- Table 1. AI Toys Industry Trends
- Table 2. AI Toys Industry Drivers
- Table 3. AI Toys Industry Opportunities and Challenges
- Table 4. AI Toys Industry Restraints
- Table 5. Global AI Toys Revenue by Company (US$ Million) & (2021-2026)
- Table 6. Global AI Toys Revenue Share by Company (2021-2026)
- Table 7. Global AI Toys Sales Volume by Company (k units) & (2021-2026)
- Table 8. Global AI Toys Sales Volume Share by Company (2021-2026)
- Table 9. Global AI Toys Average Price (USD/unit) of Company (2021-2026)
- Table 10. Global AI Toys Company Ranking, (2024-2026) & (USD Million)
- Table 11. Global AI Toys Key Company Manufacturing Base & Headquarters
- Table 12. Global AI Toys Company, Product Type & Application
- Table 13. Global AI Toys Company Establishment Date
- Table 14. Global Company Market Concentration Ratio (CR5 and HHI)
- Table 15. Global AI Toys by Company Type (Tier 1, Tier 2, and Tier 3) & (Based on Revenue of 2025)
- Table 16. Mergers & Acquisitions, Expansion
- Table 17. Significant Companies of AI Companion Toys
- Table 18. Significant Companies of AI Educational Toys
- Table 19. Significant Companies of AI Gaming Toys
- Table 20. Global AI Toys Sales Volume by Type 2021 VS 2025 VS 2032 (k units)
- Table 21. Global AI Toys Sales Volume by Type (2021-2026) & (k units)
- Table 22. Global AI Toys Sales Volume by Type (2027-2032) & (k units)
- Table 23. Global AI Toys Sales Volume Share by Type (2021-2026)
- Table 24. Global AI Toys Sales Volume Share by Type (2027-2032)
- Table 25. Global AI Toys Sales Value by Type 2021 VS 2025 VS 2032 (US$ Million)
- Table 26. Global AI Toys Sales Value by Type (2021-2026) & (US$ Million)
- Table 27. Global AI Toys Sales Value by Type (2027-2032) & (US$ Million)
- Table 28. Global AI Toys Sales Value Share by Type (2021-2026)
- Table 29. Global AI Toys Sales Value Share by Type (2027-2032)
- Table 30. Significant Companies of Households
- Table 31. Significant Companies of Educational Institutions
- Table 32. Significant Companies of Care Facilities
- Table 33. Significant Companies of Other Settings
- Table 34. Global AI Toys Sales Volume by Application 2021 VS 2025 VS 2032 (k units)
- Table 35. Global AI Toys Sales Volume by Application (2021-2026) & (k units)
- Table 36. Global AI Toys Sales Volume by Application (2027-2032) & (k units)
- Table 37. Global AI Toys Sales Volume Share by Application (2021-2026)
- Table 38. Global AI Toys Sales Volume Share by Application (2027-2032)
- Table 39. Global AI Toys Sales Value by Application 2021 VS 2025 VS 2032 (US$ Million)
- Table 40. Global AI Toys Sales Value by Application (2021-2026) & (US$ Million)
- Table 41. Global AI Toys Sales Value by Application (2027-2032) & (US$ Million)
- Table 42. Global AI Toys Sales Value Share by Application (2021-2026)
- Table 43. Global AI Toys Sales Value Share by Application (2027-2032)
- Table 44. Global AI Toys Sales by Region: 2021 VS 2025 VS 2032 (k units)
- Table 45. Global AI Toys Sales by Region (2021-2026) & (k units)
- Table 46. Global AI Toys Sales Market Share by Region (2021-2026)
- Table 47. Global AI Toys Sales by Region (2027-2032) & (k units)
- Table 48. Global AI Toys Sales Market Share by Region (2027-2032)
- Table 49. Global AI Toys Sales Value Comparison by Region: 2021 VS 2025 VS 2032 (US$ Million)
- Table 50. Global AI Toys Sales Value by Region (2021-2026) & (US$ Million)
- Table 51. Global AI Toys Sales Value Share by Region (2021-2026)
- Table 52. Global AI Toys Sales Value by Region (2027-2032) & (US$ Million)
- Table 53. Global AI Toys Sales Value Share by Region (2027-2032)
- Table 54. Global AI Toys Market Average Price (USD/unit) by Region (2021-2026)
- Table 55. Global AI Toys Market Average Price (USD/unit) by Region (2027-2032)
- Table 56. Global AI Toys Sales by Country: 2021 VS 2025 VS 2032 (k units)
- Table 57. Global AI Toys Sales Value by Country: 2021 VS 2025 VS 2032 (US$ Million)
- Table 58. Global AI Toys Sales by Country (2021-2026) & (k units)
- Table 59. Global AI Toys Sales Market Share by Country (2021-2026)
- Table 60. Global AI Toys Sales by Country (2027-2032) & (k units)
- Table 61. Global AI Toys Sales Market Share by Country (2027-2032)
- Table 62. Global AI Toys Sales Value by Country (2021-2026) & (US$ Million)
- Table 63. Global AI Toys Sales Value Market Share by Country (2021-2026)
- Table 64. Global AI Toys Sales Value by Country (2027-2032) & (US$ Million)
- Table 65. Global AI Toys Sales Value Market Share by Country (2027-2032)
- Table 66. Sony Company Information
- Table 67. Sony Business Overview
- Table 68. Sony AI Toys Sales (k units), Value (US$ Million), Price (USD/unit) and Gross Margin (2021-2026)
- Table 69. Sony AI Toys Product Portfolio
- Table 70. Sony Recent Development
- Table 71. Panasonic Company Information
- Table 72. Panasonic Business Overview
- Table 73. Panasonic AI Toys Sales (k units), Value (US$ Million), Price (USD/unit) and Gross Margin (2021-2026)
- Table 74. Panasonic AI Toys Product Portfolio
- Table 75. Panasonic Recent Development
- Table 76. Sharp Company Information
- Table 77. Sharp Business Overview
- Table 78. Sharp AI Toys Sales (k units), Value (US$ Million), Price (USD/unit) and Gross Margin (2021-2026)
- Table 79. Sharp AI Toys Product Portfolio
- Table 80. Sharp Recent Development
- Table 81. Casio Company Information
- Table 82. Casio Business Overview
- Table 83. Casio AI Toys Sales (k units), Value (US$ Million), Price (USD/unit) and Gross Margin (2021-2026)
- Table 84. Casio AI Toys Product Portfolio
- Table 85. Casio Recent Development
- Table 86. MIXI Company Information
- Table 87. MIXI Business Overview
- Table 88. MIXI AI Toys Sales (k units), Value (US$ Million), Price (USD/unit) and Gross Margin (2021-2026)
- Table 89. MIXI AI Toys Product Portfolio
- Table 90. MIXI Recent Development
- Table 91. Alpha Group Company Information
- Table 92. Alpha Group Business Overview
- Table 93. Alpha Group AI Toys Sales (k units), Value (US$ Million), Price (USD/unit) and Gross Margin (2021-2026)
- Table 94. Alpha Group AI Toys Product Portfolio
- Table 95. Alpha Group Recent Development
- Table 96. UBTECH Robotics Company Information
- Table 97. UBTECH Robotics Business Overview
- Table 98. UBTECH Robotics AI Toys Sales (k units), Value (US$ Million), Price (USD/unit) and Gross Margin (2021-2026)
- Table 99. UBTECH Robotics AI Toys Product Portfolio
- Table 100. UBTECH Robotics Recent Development
- Table 101. Zhejiang Jinke Tom Culture Industry Company Information
- Table 102. Zhejiang Jinke Tom Culture Industry Business Overview
- Table 103. Zhejiang Jinke Tom Culture Industry AI Toys Sales (k units), Value (US$ Million), Price (USD/unit) and Gross Margin (2021-2026)
- Table 104. Zhejiang Jinke Tom Culture Industry AI Toys Product Portfolio
- Table 105. Zhejiang Jinke Tom Culture Industry Recent Development
- Table 106. Shifeng Cultural Development Company Information
- Table 107. Shifeng Cultural Development Business Overview
- Table 108. Shifeng Cultural Development AI Toys Sales (k units), Value (US$ Million), Price (USD/unit) and Gross Margin (2021-2026)
- Table 109. Shifeng Cultural Development AI Toys Product Portfolio
- Table 110. Shifeng Cultural Development Recent Development
- Table 111. Makeblock Company Information
- Table 112. Makeblock Business Overview
- Table 113. Makeblock AI Toys Sales (k units), Value (US$ Million), Price (USD/unit) and Gross Margin (2021-2026)
- Table 114. Makeblock AI Toys Product Portfolio
- Table 115. Makeblock Recent Development
- Table 116. Robosen Robotics Company Information
- Table 117. Robosen Robotics Business Overview
- Table 118. Robosen Robotics AI Toys Sales (k units), Value (US$ Million), Price (USD/unit) and Gross Margin (2021-2026)
- Table 119. Robosen Robotics AI Toys Product Portfolio
- Table 120. Robosen Robotics Recent Development
- Table 121. SenseRobot Company Information
- Table 122. SenseRobot Business Overview
- Table 123. SenseRobot AI Toys Sales (k units), Value (US$ Million), Price (USD/unit) and Gross Margin (2021-2026)
- Table 124. SenseRobot AI Toys Product Portfolio
- Table 125. SenseRobot Recent Development
- Table 126. Matatalab Company Information
- Table 127. Matatalab Business Overview
- Table 128. Matatalab AI Toys Sales (k units), Value (US$ Million), Price (USD/unit) and Gross Margin (2021-2026)
- Table 129. Matatalab AI Toys Product Portfolio
- Table 130. Matatalab Recent Development
- Table 131. Miko Company Information
- Table 132. Miko Business Overview
- Table 133. Miko AI Toys Sales (k units), Value (US$ Million), Price (USD/unit) and Gross Margin (2021-2026)
- Table 134. Miko AI Toys Product Portfolio
- Table 135. Miko Recent Development
- Table 136. GROOVE X Company Information
- Table 137. GROOVE X Business Overview
- Table 138. GROOVE X AI Toys Sales (k units), Value (US$ Million), Price (USD/unit) and Gross Margin (2021-2026)
- Table 139. GROOVE X AI Toys Product Portfolio
- Table 140. GROOVE X Recent Development
- Table 141. KEYi Tech Company Information
- Table 142. KEYi Tech Business Overview
- Table 143. KEYi Tech AI Toys Sales (k units), Value (US$ Million), Price (USD/unit) and Gross Margin (2021-2026)
- Table 144. KEYi Tech AI Toys Product Portfolio
- Table 145. KEYi Tech Recent Development
- Table 146. Elephant Robotics Company Information
- Table 147. Elephant Robotics Business Overview
- Table 148. Elephant Robotics AI Toys Sales (k units), Value (US$ Million), Price (USD/unit) and Gross Margin (2021-2026)
- Table 149. Elephant Robotics AI Toys Product Portfolio
- Table 150. Elephant Robotics Recent Development
- Table 151. Haivivi Company Information
- Table 152. Haivivi Business Overview
- Table 153. Haivivi AI Toys Sales (k units), Value (US$ Million), Price (USD/unit) and Gross Margin (2021-2026)
- Table 154. Haivivi AI Toys Product Portfolio
- Table 155. Haivivi Recent Development
- Table 156. Robopoet Company Information
- Table 157. Robopoet Business Overview
- Table 158. Robopoet AI Toys Sales (k units), Value (US$ Million), Price (USD/unit) and Gross Margin (2021-2026)
- Table 159. Robopoet AI Toys Product Portfolio
- Table 160. Robopoet Recent Development
- Table 161. Yukai Engineering Company Information
- Table 162. Yukai Engineering Business Overview
- Table 163. Yukai Engineering AI Toys Sales (k units), Value (US$ Million), Price (USD/unit) and Gross Margin (2021-2026)
- Table 164. Yukai Engineering AI Toys Product Portfolio
- Table 165. Yukai Engineering Recent Development
- Table 166. Ropet Company Information
- Table 167. Ropet Business Overview
- Table 168. Ropet AI Toys Sales (k units), Value (US$ Million), Price (USD/unit) and Gross Margin (2021-2026)
- Table 169. Ropet AI Toys Product Portfolio
- Table 170. Ropet Recent Development
- Table 171. LivingAI Company Information
- Table 172. LivingAI Business Overview
- Table 173. LivingAI AI Toys Sales (k units), Value (US$ Million), Price (USD/unit) and Gross Margin (2021-2026)
- Table 174. LivingAI AI Toys Product Portfolio
- Table 175. LivingAI Recent Development
- Table 176. Energize Lab Company Information
- Table 177. Energize Lab Business Overview
- Table 178. Energize Lab AI Toys Sales (k units), Value (US$ Million), Price (USD/unit) and Gross Margin (2021-2026)
- Table 179. Energize Lab AI Toys Product Portfolio
- Table 180. Energize Lab Recent Development
- Table 181. Shanghai SiliconPear Technology Company Information
- Table 182. Shanghai SiliconPear Technology Business Overview
- Table 183. Shanghai SiliconPear Technology AI Toys Sales (k units), Value (US$ Million), Price (USD/unit) and Gross Margin (2021-2026)
- Table 184. Shanghai SiliconPear Technology AI Toys Product Portfolio
- Table 185. Shanghai SiliconPear Technology Recent Development
- Table 186. Curio Interactive Company Information
- Table 187. Curio Interactive Business Overview
- Table 188. Curio Interactive AI Toys Sales (k units), Value (US$ Million), Price (USD/unit) and Gross Margin (2021-2026)
- Table 189. Curio Interactive AI Toys Product Portfolio
- Table 190. Curio Interactive Recent Development
- Table 191. Robotical Company Information
- Table 192. Robotical Business Overview
- Table 193. Robotical AI Toys Sales (k units), Value (US$ Million), Price (USD/unit) and Gross Margin (2021-2026)
- Table 194. Robotical AI Toys Product Portfolio
- Table 195. Robotical Recent Development
- Table 196. Key Raw Materials
- Table 197. Raw Materials Key Suppliers
- Table 198. AI Toys Distributors List
- Table 199. AI Toys Customers List
- Table 200. Research Programs/Design for This Report
- Table 201. Authors List of This Report
- Table 202. Secondary Sources
- Table 203. Primary Sources
List of Figures
- Figure 1. AI Toys Product Image
- Figure 2. Global AI Toys Sales Value (US$ Million), 2021 VS 2025 VS 2032
- Figure 3. Global AI Toys Sales Value (2021-2032) & (US$ Million)
- Figure 4. Global AI Toys Sales (2021-2032) & (k units)
- Figure 5. Global AI Toys Sales Average Price (USD/unit) & (2021-2032)
- Figure 6. Global AI Toys Company Revenue Ranking in 2025 (US$ Million)
- Figure 7. Global Top 5 and 10 Company Market Share by Revenue in 2025 (US$ Million)
- Figure 8. Company Type (Tier 1, Tier 2, and Tier 3): 2021 VS 2025
- Figure 9. AI Companion Toys Image
- Figure 10. AI Educational Toys Image
- Figure 11. AI Gaming Toys Image
- Figure 12. Global AI Toys Sales Volume by Type (2021 VS 2025 VS 2032) & (k units)
- Figure 13. Global AI Toys Sales Volume Share 2021 VS 2025 VS 2032
- Figure 14. Global AI Toys Sales Volume Share by Type (2021-2032)
- Figure 15. Global AI Toys Sales Value by Type (2021 VS 2025 VS 2032) & (US$ Million)
- Figure 16. Global AI Toys Sales Value Share 2021 VS 2025 VS 2032
- Figure 17. Global AI Toys Sales Value Share by Type (2021-2032)
- Figure 18. Households Image
- Figure 19. Educational Institutions Image
- Figure 20. Care Facilities Image
- Figure 21. Other Settings Image
- Figure 22. Global AI Toys Sales Volume by Application (2021 VS 2025 VS 2032) & (k units)
- Figure 23. Global AI Toys Sales Volume Share 2021 VS 2025 VS 2032
- Figure 24. Global AI Toys Sales Volume Share by Application (2021-2032)
- Figure 25. Global AI Toys Sales Value by Application (2021 VS 2025 VS 2032) & (US$ Million)
- Figure 26. Global AI Toys Sales Value Share 2021 VS 2025 VS 2032
- Figure 27. Global AI Toys Sales Value Share by Application (2021-2032)
- Figure 28. Global AI Toys Sales by Region: 2021 VS 2025 VS 2032 (k units)
- Figure 29. Global AI Toys Sales Market Share by Region: 2021 VS 2025 VS 2032
- Figure 30. Global AI Toys Sales Value Comparison by Region: 2021 VS 2025 VS 2032 (US$ Million)
- Figure 31. Global AI Toys Sales Value Share by Region: 2021 VS 2025 VS 2032
- Figure 32. North America AI Toys Sales Value (2021-2032) & (US$ Million)
- Figure 33. North America AI Toys Sales Value Share by Country (%), 2025 VS 2032
- Figure 34. Europe AI Toys Sales Value (2021-2032) & (US$ Million)
- Figure 35. Europe AI Toys Sales Value Share by Country (%), 2025 VS 2032
- Figure 36. Asia-Pacific AI Toys Sales Value (2021-2032) & (US$ Million)
- Figure 37. Asia-Pacific AI Toys Sales Value Share by Country (%), 2025 VS 2032
- Figure 38. South America AI Toys Sales Value (2021-2032) & (US$ Million)
- Figure 39. South America AI Toys Sales Value Share by Country (%), 2025 VS 2032
- Figure 40. Middle East & Africa AI Toys Sales Value (2021-2032) & (US$ Million)
- Figure 41. Middle East & Africa AI Toys Sales Value Share by Country (%), 2025 VS 2032
- Figure 42. USA AI Toys Sales Value Growth Rate (2021-2032) & (US$ Million)
- Figure 43. USA AI Toys Sales Value Share by Type, 2025 VS 2032 & (%)
- Figure 44. USA AI Toys Sales Value Share by Application, 2025 VS 2032 & (%)
- Figure 45. Canada AI Toys Sales Value Growth Rate (2021-2032) & (US$ Million)
- Figure 46. Canada AI Toys Sales Value Share by Type, 2025 VS 2032 & (%)
- Figure 47. Canada AI Toys Sales Value Share by Application, 2025 VS 2032 & (%)
- Figure 48. Mexico AI Toys Sales Value Growth Rate (2021-2032) & (US$ Million)
- Figure 49. Mexico AI Toys Sales Value Share by Type, 2025 VS 2032 & (%)
- Figure 50. Mexico AI Toys Sales Value Share by Application, 2025 VS 2032 & (%)
- Figure 51. Germany AI Toys Sales Value Growth Rate (2021-2032) & (US$ Million)
- Figure 52. Germany AI Toys Sales Value Share by Type, 2025 VS 2032 & (%)
- Figure 53. Germany AI Toys Sales Value Share by Application, 2025 VS 2032 & (%)
- Figure 54. France AI Toys Sales Value Growth Rate (2021-2032) & (US$ Million)
- Figure 55. France AI Toys Sales Value Share by Type, 2025 VS 2032 & (%)
- Figure 56. France AI Toys Sales Value Share by Application, 2025 VS 2032 & (%)
- Figure 57. U.K. AI Toys Sales Value Growth Rate (2021-2032) & (US$ Million)
- Figure 58. U.K. AI Toys Sales Value Share by Type, 2025 VS 2032 & (%)
- Figure 59. U.K. AI Toys Sales Value Share by Application, 2025 VS 2032 & (%)
- Figure 60. Italy AI Toys Sales Value Growth Rate (2021-2032) & (US$ Million)
- Figure 61. Italy AI Toys Sales Value Share by Type, 2025 VS 2032 & (%)
- Figure 62. Italy AI Toys Sales Value Share by Application, 2025 VS 2032 & (%)
- Figure 63. Spain AI Toys Sales Value Growth Rate (2021-2032) & (US$ Million)
- Figure 64. Spain AI Toys Sales Value Share by Type, 2025 VS 2032 & (%)
- Figure 65. Spain AI Toys Sales Value Share by Application, 2025 VS 2032 & (%)
- Figure 66. Russia AI Toys Sales Value Growth Rate (2021-2032) & (US$ Million)
- Figure 67. Russia AI Toys Sales Value Share by Type, 2025 VS 2032 & (%)
- Figure 68. Russia AI Toys Sales Value Share by Application, 2025 VS 2032 & (%)
- Figure 69. Netherlands AI Toys Sales Value Growth Rate (2021-2032) & (US$ Million)
- Figure 70. Netherlands AI Toys Sales Value Share by Type, 2025 VS 2032 & (%)
- Figure 71. Netherlands AI Toys Sales Value Share by Application, 2025 VS 2032 & (%)
- Figure 72. Nordic Countries AI Toys Sales Value Growth Rate (2021-2032) & (US$ Million)
- Figure 73. Nordic Countries AI Toys Sales Value Share by Type, 2025 VS 2032 & (%)
- Figure 74. Nordic Countries AI Toys Sales Value Share by Application, 2025 VS 2032 & (%)
- Figure 75. China AI Toys Sales Value Growth Rate (2021-2032) & (US$ Million)
- Figure 76. China AI Toys Sales Value Share by Type, 2025 VS 2032 & (%)
- Figure 77. China AI Toys Sales Value Share by Application, 2025 VS 2032 & (%)
- Figure 78. Japan AI Toys Sales Value Growth Rate (2021-2032) & (US$ Million)
- Figure 79. Japan AI Toys Sales Value Share by Type, 2025 VS 2032 & (%)
- Figure 80. Japan AI Toys Sales Value Share by Application, 2025 VS 2032 & (%)
- Figure 81. South Korea AI Toys Sales Value Growth Rate (2021-2032) & (US$ Million)
- Figure 82. South Korea AI Toys Sales Value Share by Type, 2025 VS 2032 & (%)
- Figure 83. South Korea AI Toys Sales Value Share by Application, 2025 VS 2032 & (%)
- Figure 84. India AI Toys Sales Value Growth Rate (2021-2032) & (US$ Million)
- Figure 85. India AI Toys Sales Value Share by Type, 2025 VS 2032 & (%)
- Figure 86. India AI Toys Sales Value Share by Application, 2025 VS 2032 & (%)
- Figure 87. Australia AI Toys Sales Value Growth Rate (2021-2032) & (US$ Million)
- Figure 88. Australia AI Toys Sales Value Share by Type, 2025 VS 2032 & (%)
- Figure 89. Australia AI Toys Sales Value Share by Application, 2025 VS 2032 & (%)
- Figure 90. Southeast Asia AI Toys Sales Value Growth Rate (2021-2032) & (US$ Million)
- Figure 91. Southeast Asia AI Toys Sales Value Share by Type, 2025 VS 2032 & (%)
- Figure 92. Southeast Asia AI Toys Sales Value Share by Application, 2025 VS 2032 & (%)
- Figure 93. Brazil AI Toys Sales Value Growth Rate (2021-2032) & (US$ Million)
- Figure 94. Brazil AI Toys Sales Value Share by Type, 2025 VS 2032 & (%)
- Figure 95. Brazil AI Toys Sales Value Share by Application, 2025 VS 2032 & (%)
- Figure 96. Argentina AI Toys Sales Value Growth Rate (2021-2032) & (US$ Million)
- Figure 97. Argentina AI Toys Sales Value Share by Type, 2025 VS 2032 & (%)
- Figure 98. Argentina AI Toys Sales Value Share by Application, 2025 VS 2032 & (%)
- Figure 99. Chile AI Toys Sales Value Growth Rate (2021-2032) & (US$ Million)
- Figure 100. Chile AI Toys Sales Value Share by Type, 2025 VS 2032 & (%)
- Figure 101. Chile AI Toys Sales Value Share by Application, 2025 VS 2032 & (%)
- Figure 102. Colombia AI Toys Sales Value Growth Rate (2021-2032) & (US$ Million)
- Figure 103. Colombia AI Toys Sales Value Share by Type, 2025 VS 2032 & (%)
- Figure 104. Colombia AI Toys Sales Value Share by Application, 2025 VS 2032 & (%)
- Figure 105. Peru AI Toys Sales Value Growth Rate (2021-2032) & (US$ Million)
- Figure 106. Peru AI Toys Sales Value Share by Type, 2025 VS 2032 & (%)
- Figure 107. Peru AI Toys Sales Value Share by Application, 2025 VS 2032 & (%)
- Figure 108. Saudi Arabia AI Toys Sales Value Growth Rate (2021-2032) & (US$ Million)
- Figure 109. Saudi Arabia AI Toys Sales Value Share by Type, 2025 VS 2032 & (%)
- Figure 110. Saudi Arabia AI Toys Sales Value Share by Application, 2025 VS 2032 & (%)
- Figure 111. Israel AI Toys Sales Value Growth Rate (2021-2032) & (US$ Million)
- Figure 112. Israel Arabia AI Toys Sales Value Share by Type, 2025 VS 2032 & (%)
- Figure 113. Israel Arabia AI Toys Sales Value Share by Application, 2025 VS 2032 & (%)
- Figure 114. UAE AI Toys Sales Value Growth Rate (2021-2032) & (US$ Million)
- Figure 115. UAE AI Toys Sales Value Share by Type, 2025 VS 2032 & (%)
- Figure 116. UAE AI Toys Sales Value Share by Application, 2025 VS 2032 & (%)
- Figure 117. Turkey AI Toys Sales Value Growth Rate (2021-2032) & (US$ Million)
- Figure 118. Turkey AI Toys Sales Value Share by Type, 2025 VS 2032 & (%)
- Figure 119. Turkey AI Toys Sales Value Share by Application, 2025 VS 2032 & (%)
- Figure 120. Iran AI Toys Sales Value Growth Rate (2021-2032) & (US$ Million)
- Figure 121. Iran AI Toys Sales Value Share by Type, 2025 VS 2032 & (%)
- Figure 122. Iran AI Toys Sales Value Share by Application, 2025 VS 2032 & (%)
- Figure 123. Egypt AI Toys Sales Value Growth Rate (2021-2032) & (US$ Million)
- Figure 124. Egypt AI Toys Sales Value Share by Type, 2025 VS 2032 & (%)
- Figure 125. Egypt AI Toys Sales Value Share by Application, 2025 VS 2032 & (%)
- Figure 126. AI Toys Value Chain
- Figure 127. Manufacturing Cost Structure
- Figure 128. AI Toys Sales Mode & Process
- Figure 129. Direct Comparison with Distribution Share
- Figure 130. Distributors Profiles
- Figure 131. Years Considered
- Figure 132. Research Process
- Figure 133. Key Executives Interviewed
Scope & coverage.
Types
- AI Companion Toys
- AI Educational Toys
- AI Gaming Toys
Applications
- Households
- Educational Institutions
- Care Facilities
- Other Settings
Companies covered
- Sony
- Panasonic
- Sharp
- Casio
- MIXI
- Alpha Group
- UBTECH Robotics
- Zhejiang Jinke Tom Culture Industry
- Shifeng Cultural Development
- Makeblock
- Robosen Robotics
- SenseRobot
- Matatalab
- Miko
- GROOVE X
- KEYi Tech
- Elephant Robotics
- Haivivi
- Robopoet
- Yukai Engineering
- Ropet
- LivingAI
- Energize Lab
- Shanghai SiliconPear Technology
- Curio Interactive
- Robotical
Inside the report.
1 Market Overview
- 1.1 Product Definition
- 1.2 Global Market Growth Prospects
- 1.2.1 Global AI Toys Sales Value (2021-2032)
- 1.2.2 Global AI Toys Sales Volume (2021-2032)
- 1.2.3 Global AI Toys Sales Average Price (2021-2032)
- 1.3 Assumptions and Limitations
- 1.4 Study Goals and Objectives
2 AI Toys Market Dynamics
- 2.1 AI Toys Industry Trends
- 2.2 AI Toys Industry Drivers
- 2.3 AI Toys Industry Opportunities and Challenges
- 2.4 AI Toys Industry Restraints
3 AI Toys Market by Company
- 3.1 Global AI Toys Company Revenue Ranking in 2025
- 3.2 Global AI Toys Revenue by Company (2021-2026)
- 3.3 Global AI Toys Sales Volume by Company (2021-2026)
- 3.4 Global AI Toys Average Price by Company (2021-2026)
- 3.5 Global AI Toys Company Ranking (2024-2026)
- 3.6 Global AI Toys Company Manufacturing Base and Headquarters
- 3.7 Global AI Toys Company Product Type and Application
- 3.8 Global AI Toys Company Establishment Date
- 3.9 Market Competitive Analysis
- 3.9.1 Global AI Toys Market Concentration Ratio (CR5 and HHI)
- 3.9.2 Global Top 5 and 10 Company Market Share by Revenue in 2025
- 3.9.3 2025 AI Toys Tier 1, Tier 2, and Tier 3 Companies
- 3.10 Mergers and Acquisitions Expansion
4 AI Toys Market by Type
- 4.1 AI Toys Type Introduction
- 4.1.1 AI Companion Toys
- 4.1.2 AI Educational Toys
- 4.1.3 AI Gaming Toys
- 4.2 Global AI Toys Sales Volume by Type
- 4.2.1 Global AI Toys Sales Volume by Type (2021 VS 2025 VS 2032)
- 4.2.2 Global AI Toys Sales Volume by Type (2021-2032)
- 4.2.3 Global AI Toys Sales Volume Share by Type (2021-2032)
- 4.3 Global AI Toys Sales Value by Type
- 4.3.1 Global AI Toys Sales Value by Type (2021 VS 2025 VS 2032)
- 4.3.2 Global AI Toys Sales Value by Type (2021-2032)
- 4.3.3 Global AI Toys Sales Value Share by Type (2021-2032)
5 AI Toys Market by Application
- 5.1 AI Toys Application Introduction
- 5.1.1 Households
- 5.1.2 Educational Institutions
- 5.1.3 Care Facilities
- 5.1.4 Other Settings
- 5.2 Global AI Toys Sales Volume by Application
- 5.2.1 Global AI Toys Sales Volume by Application (2021 VS 2025 VS 2032)
- 5.2.2 Global AI Toys Sales Volume by Application (2021-2032)
- 5.2.3 Global AI Toys Sales Volume Share by Application (2021-2032)
- 5.3 Global AI Toys Sales Value by Application
- 5.3.1 Global AI Toys Sales Value by Application (2021 VS 2025 VS 2032)
- 5.3.2 Global AI Toys Sales Value by Application (2021-2032)
- 5.3.3 Global AI Toys Sales Value Share by Application (2021-2032)
6 AI Toys Regional Sales and Value Analysis
- 6.1 Global AI Toys Sales by Region: 2021 VS 2025 VS 2032
- 6.2 Global AI Toys Sales by Region (2021-2032)
- 6.2.1 Global AI Toys Sales by Region: 2021-2026
- 6.2.2 Global AI Toys Sales by Region (2027-2032)
- 6.3 Global AI Toys Sales Value by Region: 2021 VS 2025 VS 2032
- 6.4 Global AI Toys Sales Value by Region (2021-2032)
- 6.4.1 Global AI Toys Sales Value by Region: 2021-2026
- 6.4.2 Global AI Toys Sales Value by Region (2027-2032)
- 6.5 Global AI Toys Market Price Analysis by Region (2021-2026)
- 6.6 North America
- 6.6.1 North America AI Toys Sales Value (2021-2032)
- 6.6.2 North America AI Toys Sales Value Share by Country, 2025 VS 2032
- 6.7 Europe
- 6.7.1 Europe AI Toys Sales Value (2021-2032)
- 6.7.2 Europe AI Toys Sales Value Share by Country, 2025 VS 2032
- 6.8 Asia-Pacific
- 6.8.1 Asia-Pacific AI Toys Sales Value (2021-2032)
- 6.8.2 Asia-Pacific AI Toys Sales Value Share by Country, 2025 VS 2032
- 6.9 South America
- 6.9.1 South America AI Toys Sales Value (2021-2032)
- 6.9.2 South America AI Toys Sales Value Share by Country, 2025 VS 2032
- 6.10 Middle East & Africa
- 6.10.1 Middle East & Africa AI Toys Sales Value (2021-2032)
- 6.10.2 Middle East & Africa AI Toys Sales Value Share by Country, 2025 VS 2032
7 AI Toys Country-level Sales and Value Analysis
- 7.1 Global AI Toys Sales by Country: 2021 VS 2025 VS 2032
- 7.2 Global AI Toys Sales Value by Country: 2021 VS 2025 VS 2032
- 7.3 Global AI Toys Sales by Country (2021-2032)
- 7.3.1 Global AI Toys Sales by Country (2021-2026)
- 7.3.2 Global AI Toys Sales by Country (2027-2032)
- 7.4 Global AI Toys Sales Value by Country (2021-2032)
- 7.4.1 Global AI Toys Sales Value by Country (2021-2026)
- 7.4.2 Global AI Toys Sales Value by Country (2027-2032)
- 7.5 USA
- 7.5.1 USA AI Toys Sales Value Growth Rate (2021-2032)
- 7.5.2 USA AI Toys Sales Value Share by Type, 2025 VS 2032
- 7.5.3 USA AI Toys Sales Value Share by Application, 2025 VS 2032
- 7.6 Canada
- 7.6.1 Canada AI Toys Sales Value Growth Rate (2021-2032)
- 7.6.2 Canada AI Toys Sales Value Share by Type, 2025 VS 2032
- 7.6.3 Canada AI Toys Sales Value Share by Application, 2025 VS 2032
- 7.7 Mexico
- 7.6.1 Mexico AI Toys Sales Value Growth Rate (2021-2032)
- 7.6.2 Mexico AI Toys Sales Value Share by Type, 2025 VS 2032
- 7.6.3 Mexico AI Toys Sales Value Share by Application, 2025 VS 2032
- 7.8 Germany
- 7.8.1 Germany AI Toys Sales Value Growth Rate (2021-2032)
- 7.8.2 Germany AI Toys Sales Value Share by Type, 2025 VS 2032
- 7.8.3 Germany AI Toys Sales Value Share by Application, 2025 VS 2032
- 7.9 France
- 7.9.1 France AI Toys Sales Value Growth Rate (2021-2032)
- 7.9.2 France AI Toys Sales Value Share by Type, 2025 VS 2032
- 7.9.3 France AI Toys Sales Value Share by Application, 2025 VS 2032
- 7.10 U.K.
- 7.10.1 U.K. AI Toys Sales Value Growth Rate (2021-2032)
- 7.10.2 U.K. AI Toys Sales Value Share by Type, 2025 VS 2032
- 7.10.3 U.K. AI Toys Sales Value Share by Application, 2025 VS 2032
- 7.11 Italy
- 7.11.1 Italy AI Toys Sales Value Growth Rate (2021-2032)
- 7.11.2 Italy AI Toys Sales Value Share by Type, 2025 VS 2032
- 7.11.3 Italy AI Toys Sales Value Share by Application, 2025 VS 2032
- 7.12 Spain
- 7.12.1 Spain AI Toys Sales Value Growth Rate (2021-2032)
- 7.12.2 Spain AI Toys Sales Value Share by Type, 2025 VS 2032
- 7.12.3 Spain AI Toys Sales Value Share by Application, 2025 VS 2032
- 7.13 Russia
- 7.13.1 Russia AI Toys Sales Value Growth Rate (2021-2032)
- 7.13.2 Russia AI Toys Sales Value Share by Type, 2025 VS 2032
- 7.13.3 Russia AI Toys Sales Value Share by Application, 2025 VS 2032
- 7.14 Netherlands
- 7.14.1 Netherlands AI Toys Sales Value Growth Rate (2021-2032)
- 7.14.2 Netherlands AI Toys Sales Value Share by Type, 2025 VS 2032
- 7.14.3 Netherlands AI Toys Sales Value Share by Application, 2025 VS 2032
- 7.15 Nordic Countries
- 7.15.1 Nordic Countries AI Toys Sales Value Growth Rate (2021-2032)
- 7.15.2 Nordic Countries AI Toys Sales Value Share by Type, 2025 VS 2032
- 7.15.3 Nordic Countries AI Toys Sales Value Share by Application, 2025 VS 2032
- 7.16 China
- 7.16.1 China AI Toys Sales Value Growth Rate (2021-2032)
- 7.16.2 China AI Toys Sales Value Share by Type, 2025 VS 2032
- 7.16.3 China AI Toys Sales Value Share by Application, 2025 VS 2032
- 7.17 Japan
- 7.17.1 Japan AI Toys Sales Value Growth Rate (2021-2032)
- 7.17.2 Japan AI Toys Sales Value Share by Type, 2025 VS 2032
- 7.17.3 Japan AI Toys Sales Value Share by Application, 2025 VS 2032
- 7.18 South Korea
- 7.18.1 South Korea AI Toys Sales Value Growth Rate (2021-2032)
- 7.18.2 South Korea AI Toys Sales Value Share by Type, 2025 VS 2032
- 7.18.3 South Korea AI Toys Sales Value Share by Application, 2025 VS 2032
- 7.19 India
- 7.19.1 India AI Toys Sales Value Growth Rate (2021-2032)
- 7.19.2 India AI Toys Sales Value Share by Type, 2025 VS 2032
- 7.19.3 India AI Toys Sales Value Share by Application, 2025 VS 2032
- 7.20 Australia
- 7.20.1 Australia AI Toys Sales Value Growth Rate (2021-2032)
- 7.20.2 Australia AI Toys Sales Value Share by Type, 2025 VS 2032
- 7.20.3 Australia AI Toys Sales Value Share by Application, 2025 VS 2032
- 7.21 Southeast Asia
- 7.21.1 Southeast Asia AI Toys Sales Value Growth Rate (2021-2032)
- 7.21.2 Southeast Asia AI Toys Sales Value Share by Type, 2025 VS 2032
- 7.21.3 Southeast Asia AI Toys Sales Value Share by Application, 2025 VS 2032
- 7.22 Brazil
- 7.22.1 Brazil AI Toys Sales Value Growth Rate (2021-2032)
- 7.22.2 Brazil AI Toys Sales Value Share by Type, 2025 VS 2032
- 7.22.3 Brazil AI Toys Sales Value Share by Application, 2025 VS 2032
- 7.23 Argentina
- 7.23.1 Argentina AI Toys Sales Value Growth Rate (2021-2032)
- 7.23.2 Argentina AI Toys Sales Value Share by Type, 2025 VS 2032
- 7.23.3 Argentina AI Toys Sales Value Share by Application, 2025 VS 2032
- 7.24 Chile
- 7.24.1 Chile AI Toys Sales Value Growth Rate (2021-2032)
- 7.24.2 Chile AI Toys Sales Value Share by Type, 2025 VS 2032
- 7.24.3 Chile AI Toys Sales Value Share by Application, 2025 VS 2032
- 7.25 Colombia
- 7.25.1 Colombia AI Toys Sales Value Growth Rate (2021-2032)
- 7.25.2 Colombia AI Toys Sales Value Share by Type, 2025 VS 2032
- 7.25.3 Colombia AI Toys Sales Value Share by Application, 2025 VS 2032
- 7.26 Peru
- 7.26.1 Peru AI Toys Sales Value Growth Rate (2021-2032)
- 7.26.2 Peru AI Toys Sales Value Share by Type, 2025 VS 2032
- 7.26.3 Peru AI Toys Sales Value Share by Application, 2025 VS 2032
- 7.27 Saudi Arabia
- 7.27.1 Saudi Arabia AI Toys Sales Value Growth Rate (2021-2032)
- 7.27.2 Saudi Arabia AI Toys Sales Value Share by Type, 2025 VS 2032
- 7.27.3 Saudi Arabia AI Toys Sales Value Share by Application, 2025 VS 2032
- 7.28 Israel
- 7.28.1 Israel AI Toys Sales Value Growth Rate (2021-2032)
- 7.28.2 Israel AI Toys Sales Value Share by Type, 2025 VS 2032
- 7.28.3 Israel AI Toys Sales Value Share by Application, 2025 VS 2032
- 7.29 UAE
- 7.29.1 UAE AI Toys Sales Value Growth Rate (2021-2032)
- 7.29.2 UAE AI Toys Sales Value Share by Type, 2025 VS 2032
- 7.29.3 UAE AI Toys Sales Value Share by Application, 2025 VS 2032
- 7.30 Turkey
- 7.30.1 Turkey AI Toys Sales Value Growth Rate (2021-2032)
- 7.30.2 Turkey AI Toys Sales Value Share by Type, 2025 VS 2032
- 7.30.3 Turkey AI Toys Sales Value Share by Application, 2025 VS 2032
- 7.31 Iran
- 7.31.1 Iran AI Toys Sales Value Growth Rate (2021-2032)
- 7.31.2 Iran AI Toys Sales Value Share by Type, 2025 VS 2032
- 7.31.3 Iran AI Toys Sales Value Share by Application, 2025 VS 2032
- 7.32 Egypt
- 7.32.1 Egypt AI Toys Sales Value Growth Rate (2021-2032)
- 7.32.2 Egypt AI Toys Sales Value Share by Type, 2025 VS 2032
- 7.32.3 Egypt AI Toys Sales Value Share by Application, 2025 VS 2032
8 Company Profiles
- 8.1 Sony
- 8.1.1 Sony Company Information
- 8.1.2 Sony Business Overview
- 8.1.3 Sony AI Toys Sales, Value and Gross Margin (2021-2026)
- 8.1.4 Sony AI Toys Product Portfolio
- 8.1.5 Sony Recent Developments
- 8.2 Panasonic
- 8.2.1 Panasonic Company Information
- 8.2.2 Panasonic Business Overview
- 8.2.3 Panasonic AI Toys Sales, Value and Gross Margin (2021-2026)
- 8.2.4 Panasonic AI Toys Product Portfolio
- 8.2.5 Panasonic Recent Developments
- 8.3 Sharp
- 8.3.1 Sharp Company Information
- 8.3.2 Sharp Business Overview
- 8.3.3 Sharp AI Toys Sales, Value and Gross Margin (2021-2026)
- 8.3.4 Sharp AI Toys Product Portfolio
- 8.3.5 Sharp Recent Developments
- 8.4 Casio
- 8.4.1 Casio Company Information
- 8.4.2 Casio Business Overview
- 8.4.3 Casio AI Toys Sales, Value and Gross Margin (2021-2026)
- 8.4.4 Casio AI Toys Product Portfolio
- 8.4.5 Casio Recent Developments
- 8.5 MIXI
- 8.5.1 MIXI Company Information
- 8.5.2 MIXI Business Overview
- 8.5.3 MIXI AI Toys Sales, Value and Gross Margin (2021-2026)
- 8.5.4 MIXI AI Toys Product Portfolio
- 8.5.5 MIXI Recent Developments
- 8.6 Alpha Group
- 8.6.1 Alpha Group Company Information
- 8.6.2 Alpha Group Business Overview
- 8.6.3 Alpha Group AI Toys Sales, Value and Gross Margin (2021-2026)
- 8.6.4 Alpha Group AI Toys Product Portfolio
- 8.6.5 Alpha Group Recent Developments
- 8.7 UBTECH Robotics
- 8.7.1 UBTECH Robotics Company Information
- 8.7.2 UBTECH Robotics Business Overview
- 8.7.3 UBTECH Robotics AI Toys Sales, Value and Gross Margin (2021-2026)
- 8.7.4 UBTECH Robotics AI Toys Product Portfolio
- 8.7.5 UBTECH Robotics Recent Developments
- 8.8 Zhejiang Jinke Tom Culture Industry
- 8.8.1 Zhejiang Jinke Tom Culture Industry Company Information
- 8.8.2 Zhejiang Jinke Tom Culture Industry Business Overview
- 8.8.3 Zhejiang Jinke Tom Culture Industry AI Toys Sales, Value and Gross Margin (2021-2026)
- 8.8.4 Zhejiang Jinke Tom Culture Industry AI Toys Product Portfolio
- 8.8.5 Zhejiang Jinke Tom Culture Industry Recent Developments
- 8.9 Shifeng Cultural Development
- 8.9.1 Shifeng Cultural Development Company Information
- 8.9.2 Shifeng Cultural Development Business Overview
- 8.9.3 Shifeng Cultural Development AI Toys Sales, Value and Gross Margin (2021-2026)
- 8.9.4 Shifeng Cultural Development AI Toys Product Portfolio
- 8.9.5 Shifeng Cultural Development Recent Developments
- 8.10 Makeblock
- 8.10.1 Makeblock Company Information
- 8.10.2 Makeblock Business Overview
- 8.10.3 Makeblock AI Toys Sales, Value and Gross Margin (2021-2026)
- 8.10.4 Makeblock AI Toys Product Portfolio
- 8.10.5 Makeblock Recent Developments
- 8.11 Robosen Robotics
- 8.11.1 Robosen Robotics Company Information
- 8.11.2 Robosen Robotics Business Overview
- 8.11.3 Robosen Robotics AI Toys Sales, Value and Gross Margin (2021-2026)
- 8.11.4 Robosen Robotics AI Toys Product Portfolio
- 8.11.5 Robosen Robotics Recent Developments
- 8.12 SenseRobot
- 8.12.1 SenseRobot Company Information
- 8.12.2 SenseRobot Business Overview
- 8.12.3 SenseRobot AI Toys Sales, Value and Gross Margin (2021-2026)
- 8.12.4 SenseRobot AI Toys Product Portfolio
- 8.12.5 SenseRobot Recent Developments
- 8.13 Matatalab
- 8.13.1 Matatalab Company Information
- 8.13.2 Matatalab Business Overview
- 8.13.3 Matatalab AI Toys Sales, Value and Gross Margin (2021-2026)
- 8.13.4 Matatalab AI Toys Product Portfolio
- 8.13.5 Matatalab Recent Developments
- 8.14 Miko
- 8.14.1 Miko Company Information
- 8.14.2 Miko Business Overview
- 8.14.3 Miko AI Toys Sales, Value and Gross Margin (2021-2026)
- 8.14.4 Miko AI Toys Product Portfolio
- 8.14.5 Miko Recent Developments
- 8.15 GROOVE X
- 8.15.1 GROOVE X Company Information
- 8.15.2 GROOVE X Business Overview
- 8.15.3 GROOVE X AI Toys Sales, Value and Gross Margin (2021-2026)
- 8.15.4 GROOVE X AI Toys Product Portfolio
- 8.15.5 GROOVE X Recent Developments
- 8.16 KEYi Tech
- 8.16.1 KEYi Tech Company Information
- 8.16.2 KEYi Tech Business Overview
- 8.16.3 KEYi Tech AI Toys Sales, Value and Gross Margin (2021-2026)
- 8.16.4 KEYi Tech AI Toys Product Portfolio
- 8.16.5 KEYi Tech Recent Developments
- 8.17 Elephant Robotics
- 8.17.1 Elephant Robotics Company Information
- 8.17.2 Elephant Robotics Business Overview
- 8.17.3 Elephant Robotics AI Toys Sales, Value and Gross Margin (2021-2026)
- 8.17.4 Elephant Robotics AI Toys Product Portfolio
- 8.17.5 Elephant Robotics Recent Developments
- 8.18 Haivivi
- 8.18.1 Haivivi Company Information
- 8.18.2 Haivivi Business Overview
- 8.18.3 Haivivi AI Toys Sales, Value and Gross Margin (2021-2026)
- 8.18.4 Haivivi AI Toys Product Portfolio
- 8.18.5 Haivivi Recent Developments
- 8.19 Robopoet
- 8.19.1 Robopoet Company Information
- 8.19.2 Robopoet Business Overview
- 8.19.3 Robopoet AI Toys Sales, Value and Gross Margin (2021-2026)
- 8.19.4 Robopoet AI Toys Product Portfolio
- 8.19.5 Robopoet Recent Developments
- 8.20 Yukai Engineering
- 8.20.1 Yukai Engineering Company Information
- 8.20.2 Yukai Engineering Business Overview
- 8.20.3 Yukai Engineering AI Toys Sales, Value and Gross Margin (2021-2026)
- 8.20.4 Yukai Engineering AI Toys Product Portfolio
- 8.20.5 Yukai Engineering Recent Developments
- 8.21 Ropet
- 8.21.1 Ropet Company Information
- 8.21.2 Ropet Business Overview
- 8.21.3 Ropet AI Toys Sales, Value and Gross Margin (2021-2026)
- 8.21.4 Ropet AI Toys Product Portfolio
- 8.21.5 Ropet Recent Developments
- 8.22 LivingAI
- 8.22.1 LivingAI Company Information
- 8.22.2 LivingAI Business Overview
- 8.22.3 LivingAI AI Toys Sales, Value and Gross Margin (2021-2026)
- 8.22.4 LivingAI AI Toys Product Portfolio
- 8.22.5 LivingAI Recent Developments
- 8.23 Energize Lab
- 8.23.1 Energize Lab Company Information
- 8.23.2 Energize Lab Business Overview
- 8.23.3 Energize Lab AI Toys Sales, Value and Gross Margin (2021-2026)
- 8.23.4 Energize Lab AI Toys Product Portfolio
- 8.23.5 Energize Lab Recent Developments
- 8.24 Shanghai SiliconPear Technology
- 8.24.1 Shanghai SiliconPear Technology Company Information
- 8.24.2 Shanghai SiliconPear Technology Business Overview
- 8.24.3 Shanghai SiliconPear Technology AI Toys Sales, Value and Gross Margin (2021-2026)
- 8.24.4 Shanghai SiliconPear Technology AI Toys Product Portfolio
- 8.24.5 Shanghai SiliconPear Technology Recent Developments
- 8.25 Curio Interactive
- 8.25.1 Curio Interactive Company Information
- 8.25.2 Curio Interactive Business Overview
- 8.25.3 Curio Interactive AI Toys Sales, Value and Gross Margin (2021-2026)
- 8.25.4 Curio Interactive AI Toys Product Portfolio
- 8.25.5 Curio Interactive Recent Developments
- 8.26 Robotical
- 8.26.1 Robotical Company Information
- 8.26.2 Robotical Business Overview
- 8.26.3 Robotical AI Toys Sales, Value and Gross Margin (2021-2026)
- 8.26.4 Robotical AI Toys Product Portfolio
- 8.26.5 Robotical Recent Developments
9 Value Chain and Sales Channels Analysis
- 9.1 AI Toys Value Chain Analysis
- 9.1.1 AI Toys Key Raw Materials
- 9.1.2 Raw Materials Key Suppliers
- 9.1.3 Manufacturing Cost Structure
- 9.1.4 AI Toys Sales Mode & Process
- 9.2 AI Toys Sales Channels Analysis
- 9.2.1 Direct Comparison with Distribution Share
- 9.2.2 AI Toys Distributors
- 9.2.3 AI Toys Customers
10 Concluding Insights
11 Appendix
- 11.1 Reasons for Doing This Study
- 11.2 Research Methodology
- 11.3 Research Process
- 11.4 Authors List of This Report
- 11.5 Data Source
- 11.5.1 Secondary Sources
- 11.5.2 Primary Sources
GET THE RESEARCH
Choose your license.
PDF by email within 3–5 working days after payment confirmation.
Talk to an analyst